Current trend
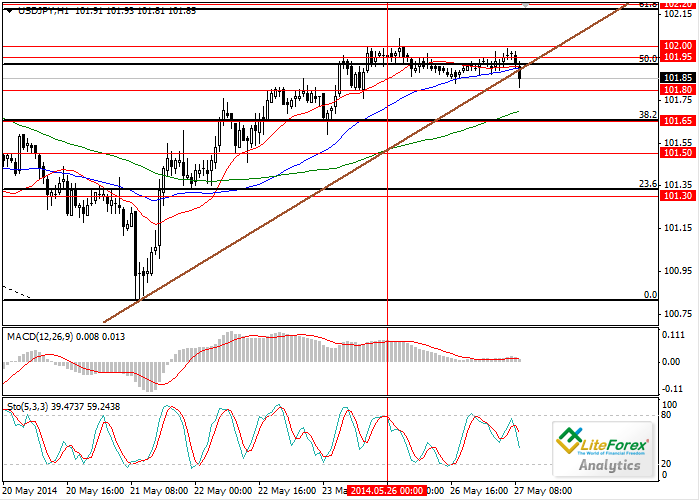
Last week the pair had reached the local highs at the level of 100.80. Last time the price has been at this level this February. After the failure to break down this level last week, downtrend in the pair has shifted into the uptrend. Last Friday trading session completed at the level of 101.95. Yesterday, trading was sluggish in the narrow sideways channel. It is likely that the pair will be able to reach the level of 102.20; however, further growth is hardly possible without additional drivers.
Technical indicators give mixed signals. Average moving lines with the periods of 20 and 50 act as support levels and are being tested by the price. If the price does not break down these levels, it will give us a buy signal. MACD histogram is near the zero line. Stochastic is directed downwards, indicating the decline.
Levels of support and resistance
Support levels: 101.80, 101.65, 101.50 and 101.30.
Resistance levels: 101.95,102,2 and 102.35.
Trading tips
It makes sense to open short positions below the level of 101.65 with the target of 101.00. It is also advisable to place limited sell orders at the level of 102.20. Long positions can be opened above the level of 102.35.
Ilya Lashenko
LiteForex Investments Limited Analyst