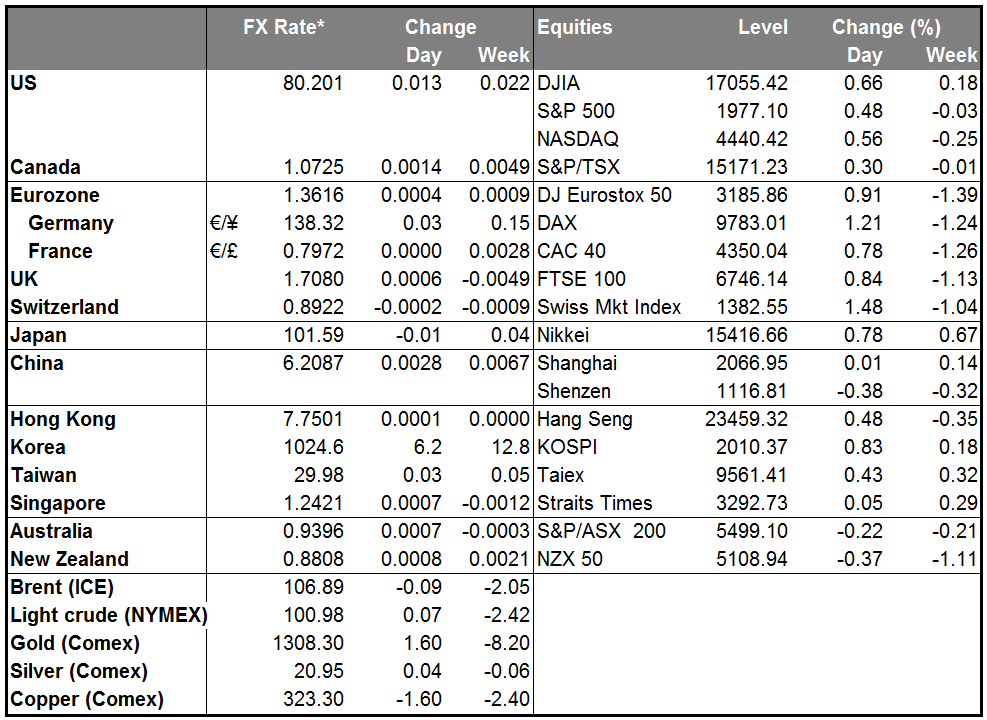
EUR/USD keeps the picture neutral
EUR/USD edged marginally higher, remaining near the two moving averages, between the support zone of 1.3580 and the resistance of 1.3650 (R1). Taking this into account and that both the 50- and the 200-period moving averages are pointing sideways, I would maintain my neutral stance today. Only a dip below 1.3580 (S1) could confirm a forthcoming lower low and trigger further bearish extensions. I would expect such a dip to pave the way towards the psychological barrier of 1.3500 (S2). On the daily chart, both the 14-day RSI and the daily MACD remain near their neutral levels, supporting my flat view, at least for now.
• Support: 1.3580 (S1), 1.3500 (S2), 1.3475 (S3)
• Resistance: 1.3650 (R1), 1.3685 (R2), 1.3745 (R3)
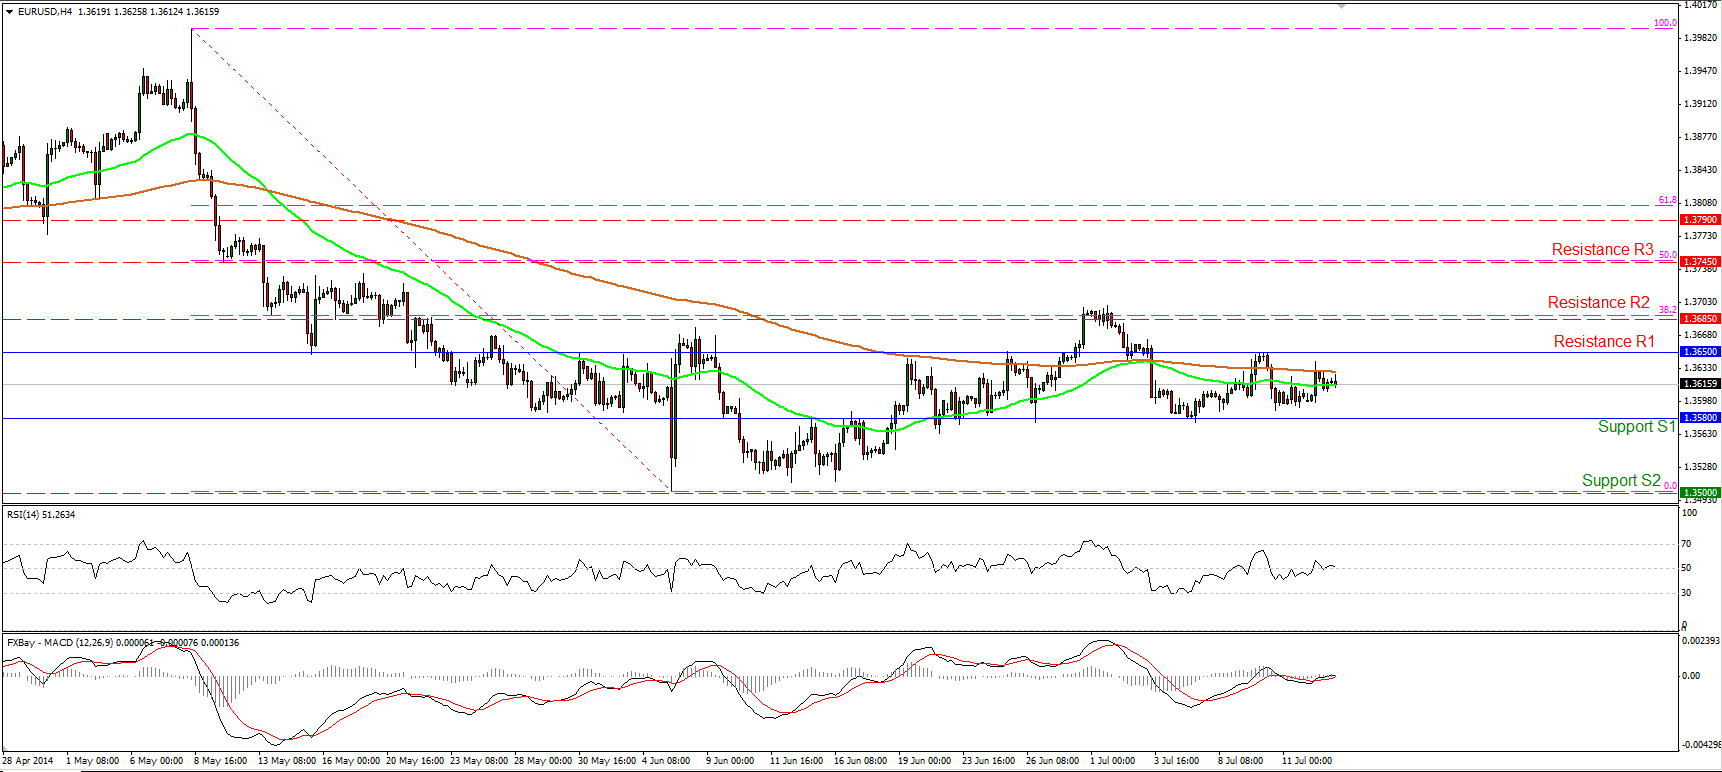
Are USD/JPY bulls going for 101.85?
USD/JPY moved significantly higher after finding support at 101.10 (S2), last week. The rate emerged above the 101.40 barrier and I would expect the upside to continue towards the resistance of 101.85 (R1) or towards the upper boundary of the purple downward sloping channel. The MACD lies above its signal line and seems ready to obtain a positive sign soon, while the RSI crossed above its 50 level, magnifying the case for the continuation of the upside wave. However, the pair is trading within the purple downside channel and as a result, the overall short-term path remains to the downside. On the daily chart, I can see a morning star candle pattern favoring further upside correction.
• Support: 101.40 (S1), 101.10 (S2), 100.80 (S3)
• Resistance: 101.85 (R1), 102.25 (R2), 102.65 (R3)
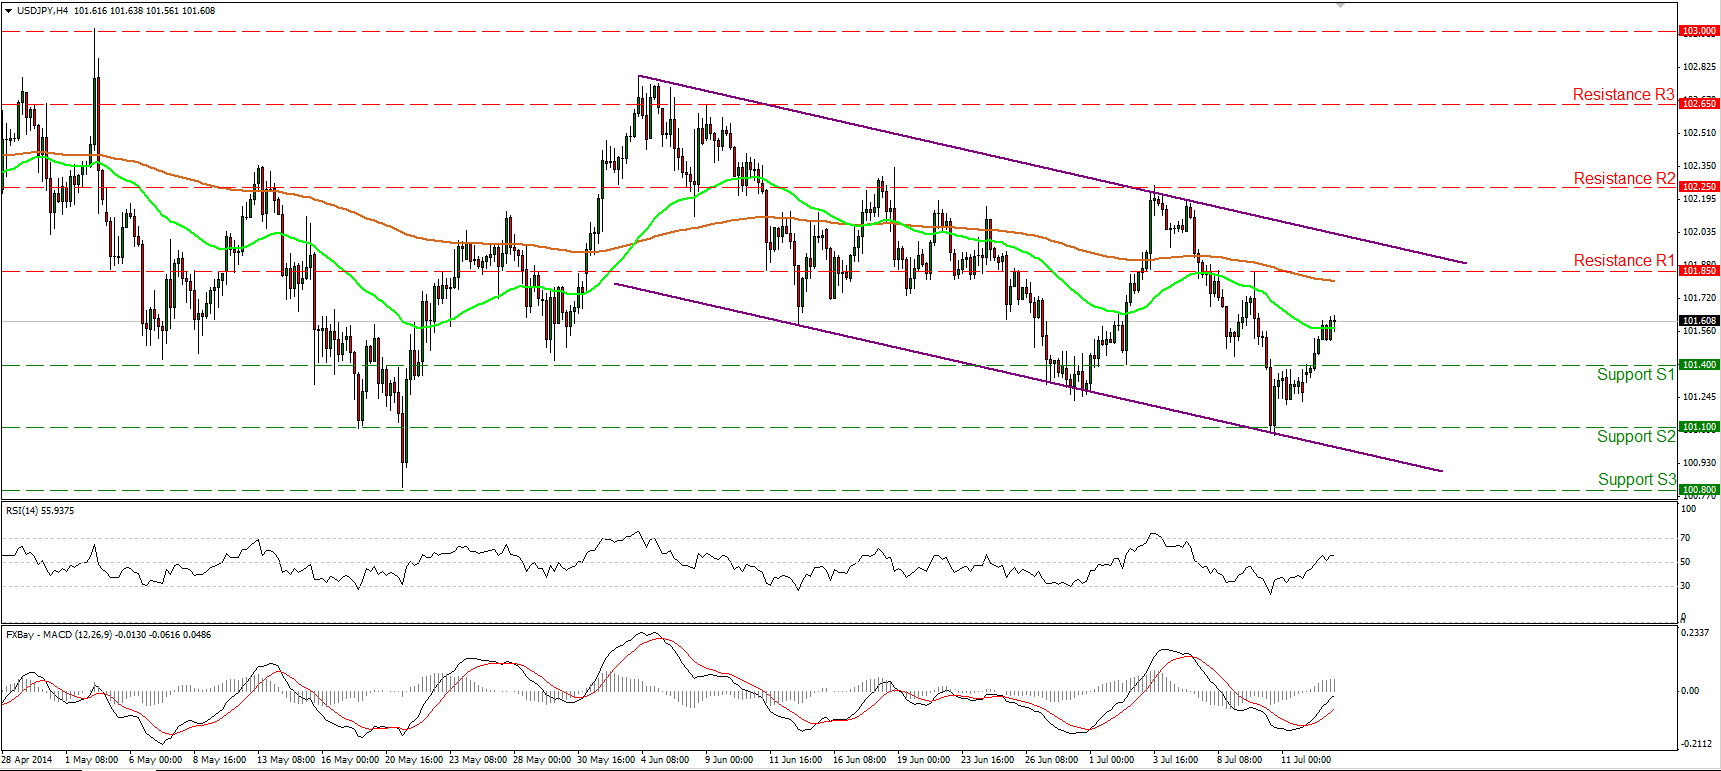
EUR/GBP in a correcting mode
EUR/GBP continued moving higher, confirming the bullish engulfing candle pattern identified on the daily chart and the positive divergence between our momentum studies and the price action. The pair violated the resistance zone (turned into support) of 0.7960 (S1) and thus I would expect the advance to continue, perhaps towards the blue downtrend line or the 0.8030 (R1) hurdle. Nevertheless, as long as the pair is forming lower highs and lower lows below the blue downtrend line drawn from back the 11th of April, I consider the overall outlook to be to the downside and any further advances as renewed selling opportunities. Only a decisive move above 0.8030 (R1) would be a reason to reconsider our analysis
• Support: 0.7915 (S1), 0.7830 (S2), 0.7760 (S3)
• Resistance: 0.7960 (R1), 0.8030 (R2), 0.8080 (R3)
Gold tumbles, breaking the uptrend line
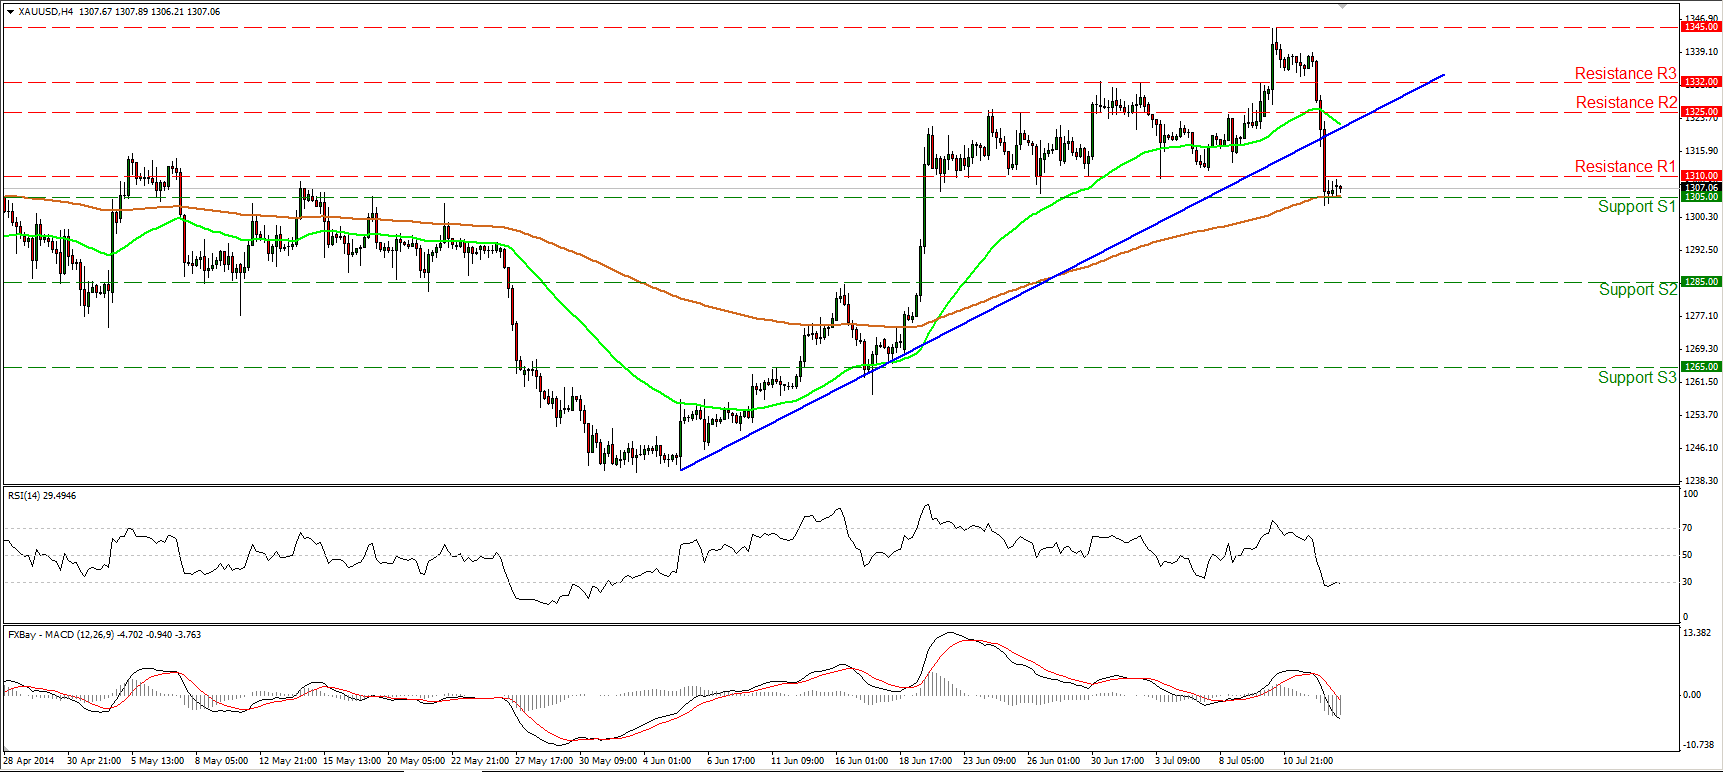
Gold collapsed on Monday, breaking below the blue uptrend line, drawn from back the 5th of June. Nevertheless, the plunge was halted by the support zone of 1305 (S1) and the 200-period moving average. The MACD lies below both its signal and zero lines, confirming yesterday’s negative momentum. Although we may experience further declines, I would wait for a clear move below that strong support zone to trigger further extensions and perhaps target the 1285 (S2) barrier. On the daily chart, the 1305 (S1) barrier is near the 50-period moving average, corroborating my view that a break below 1305 (S1) is needed for further declines.
• Support: 1305 (S1), 1285 (S2), 1265 (S3)
• Resistance: 1310 (R1), 1325 (R2), 1332 (R3)
WTI bounces from 100.40
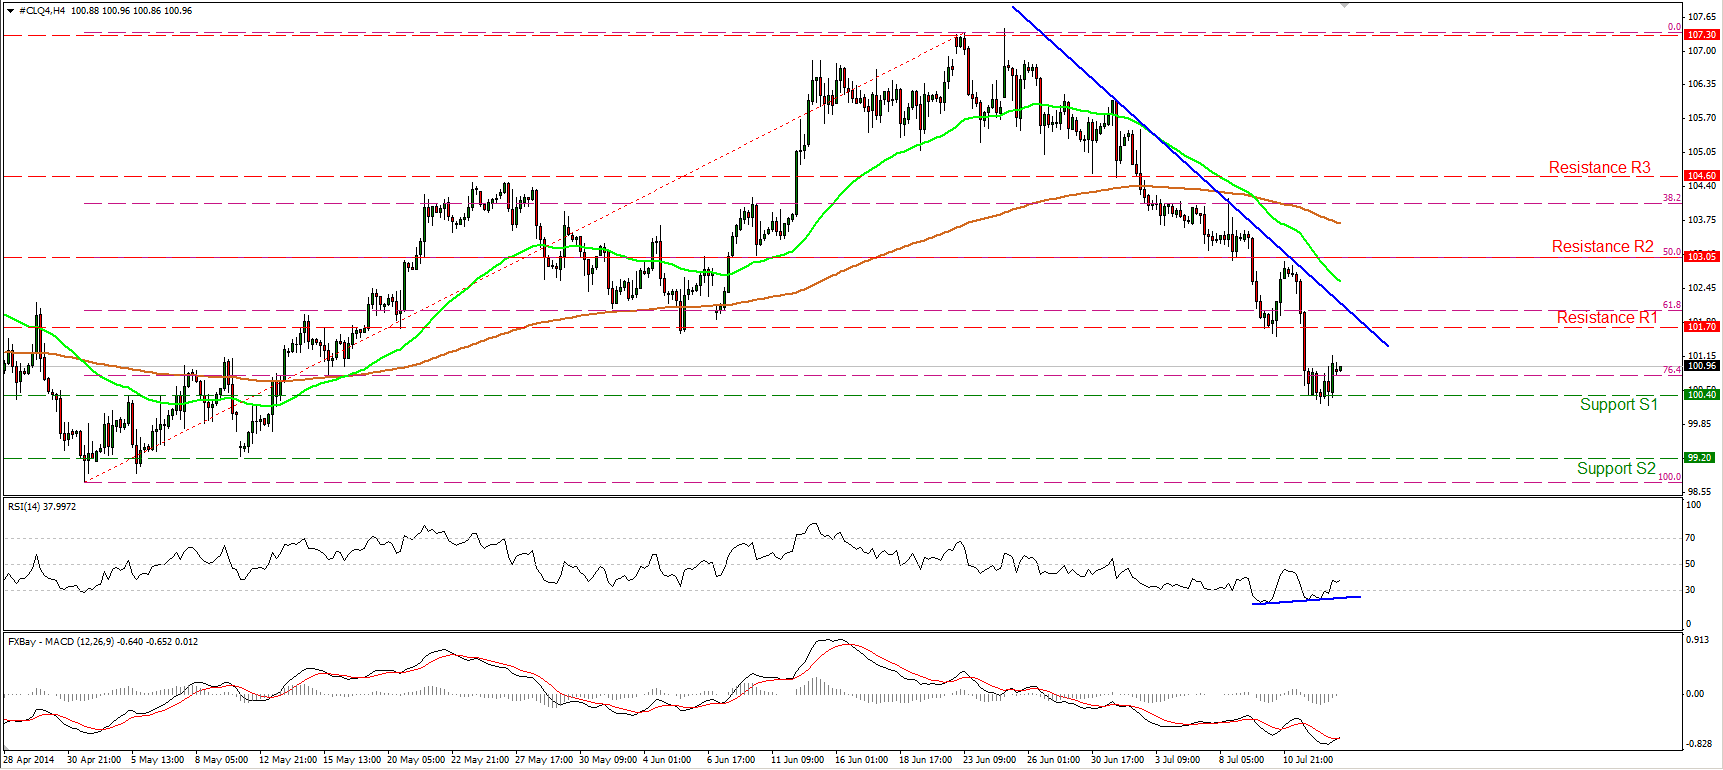
WTI moved somewhat higher on Monday, supporting our expectations for a forthcoming bounce from the support zone of 100.40 (S1). Seeing that the RSI moved higher after exiting its oversold field and that the MACD crossed above its signal line, I would expect the upside wave to continue. Additionally, I can identify positive divergence between the RSI and the price action, amplifying the case for further advances, maybe for a test at the 101.70 (R1), area as a resistance this time. Nevertheless, the price structure remains lower peaks and lower troughs below both the moving averages and below the blue downtrend line. Bearing this in mind, I still see a downtrend and I would consider any further advances as a correcting wave, at least for now. Only a move above 103.05 (R3) could signal a forthcoming higher high and flip the picture positive.
• Support: 100.40 (S1), 99.20 (S2), 98.75 (S3)
• Resistance: 101.70 (R1), 103.05 (R2), 104.60 (R3)
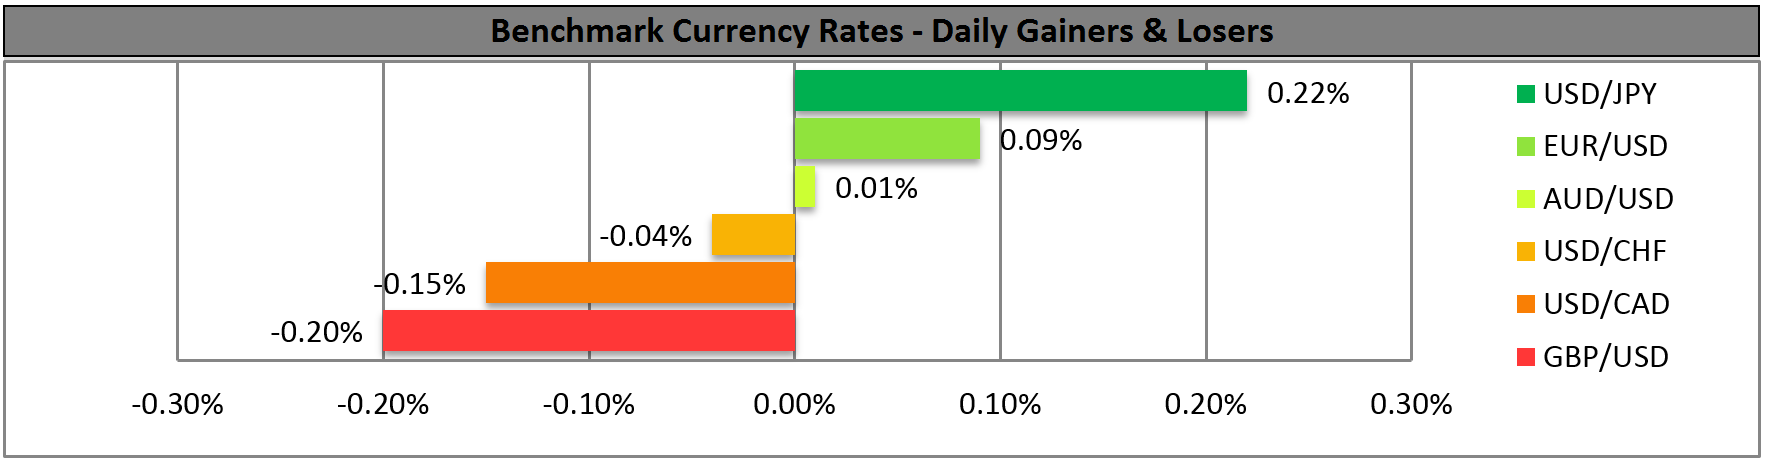
BENCHMARK CURRENCY RATES - DAILY GAINERS AND LOSERS
MARKETS SUMMARY