EUR/USD stays virtually unchanged
EUR/USD moved below the 1.2600 line, but the dip lasted only several hours. Then, the pair rebounded somewhat to find resistance at 1.2635 (R1). However, I will stick to the view that the recovery from 1.2500 (S1) probably ended near 1.2840 (S3), which lies near the 23.6% retracement level of the 8th of May – 3rd of October decline, and that the pair could be resuming its prior downtrend. I still expect the bears to pull the trigger for another test of the psychological barrier of 1.2500 (S1), which happens to be the 76.4% retracement level of the July 2012 – May 2014 major advance. Our daily momentum studies support the notion. The 14-day RSI moved lower after finding resistance marginally below its 50 line, while the MACD, already within its negative territory, appears willing to cross below its trigger line.
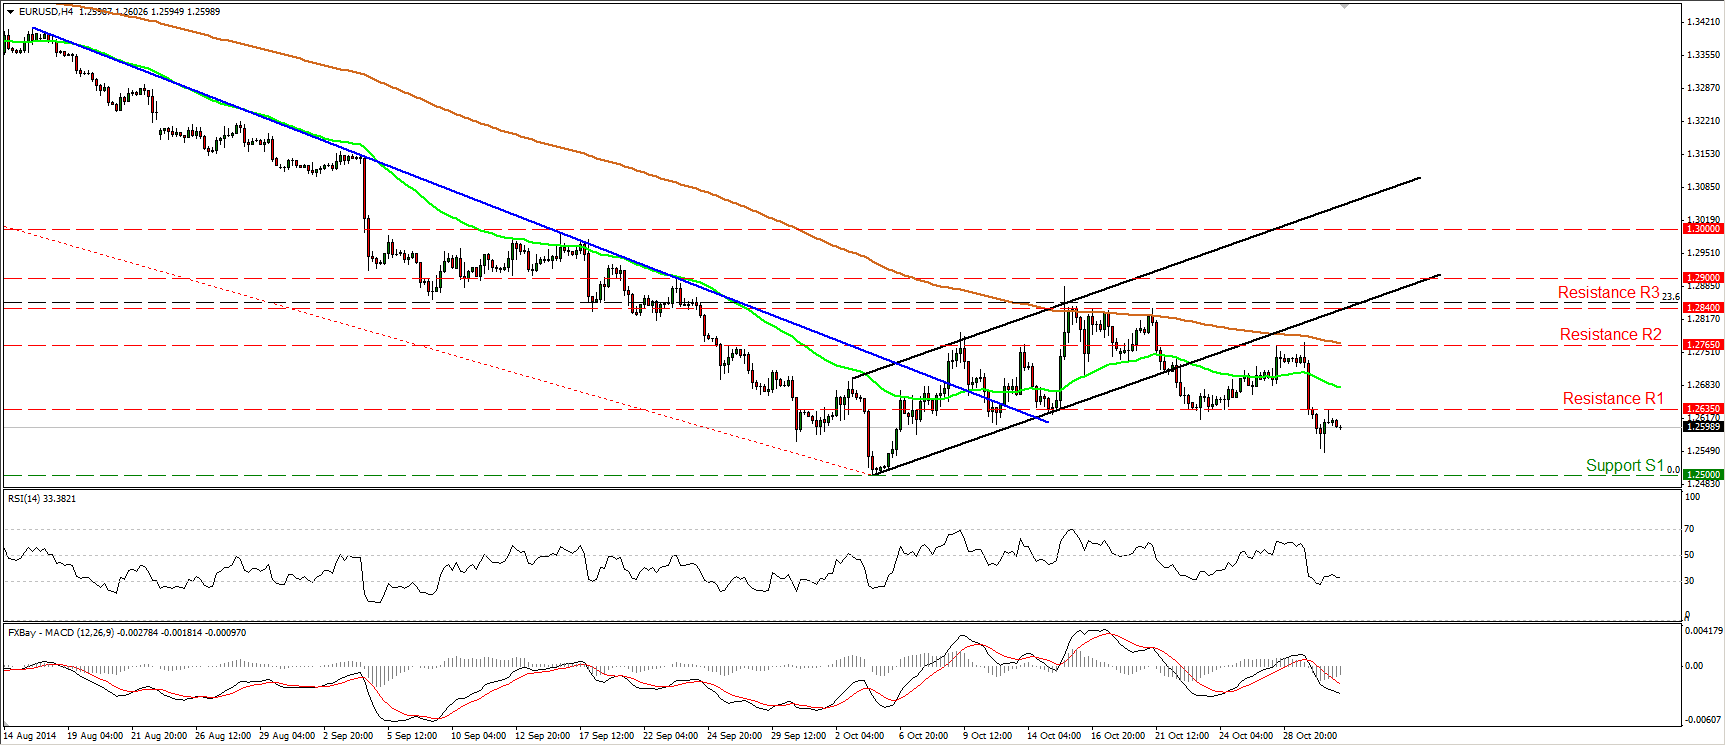
• Support: 1.2500 (S1), 1.2465 (S2), 1.2400 (S3)
• Resistance: 1.2635 (R1), 1.2765 (R2), 1.2840 (R3)
GBP/JPY surges above 175.00
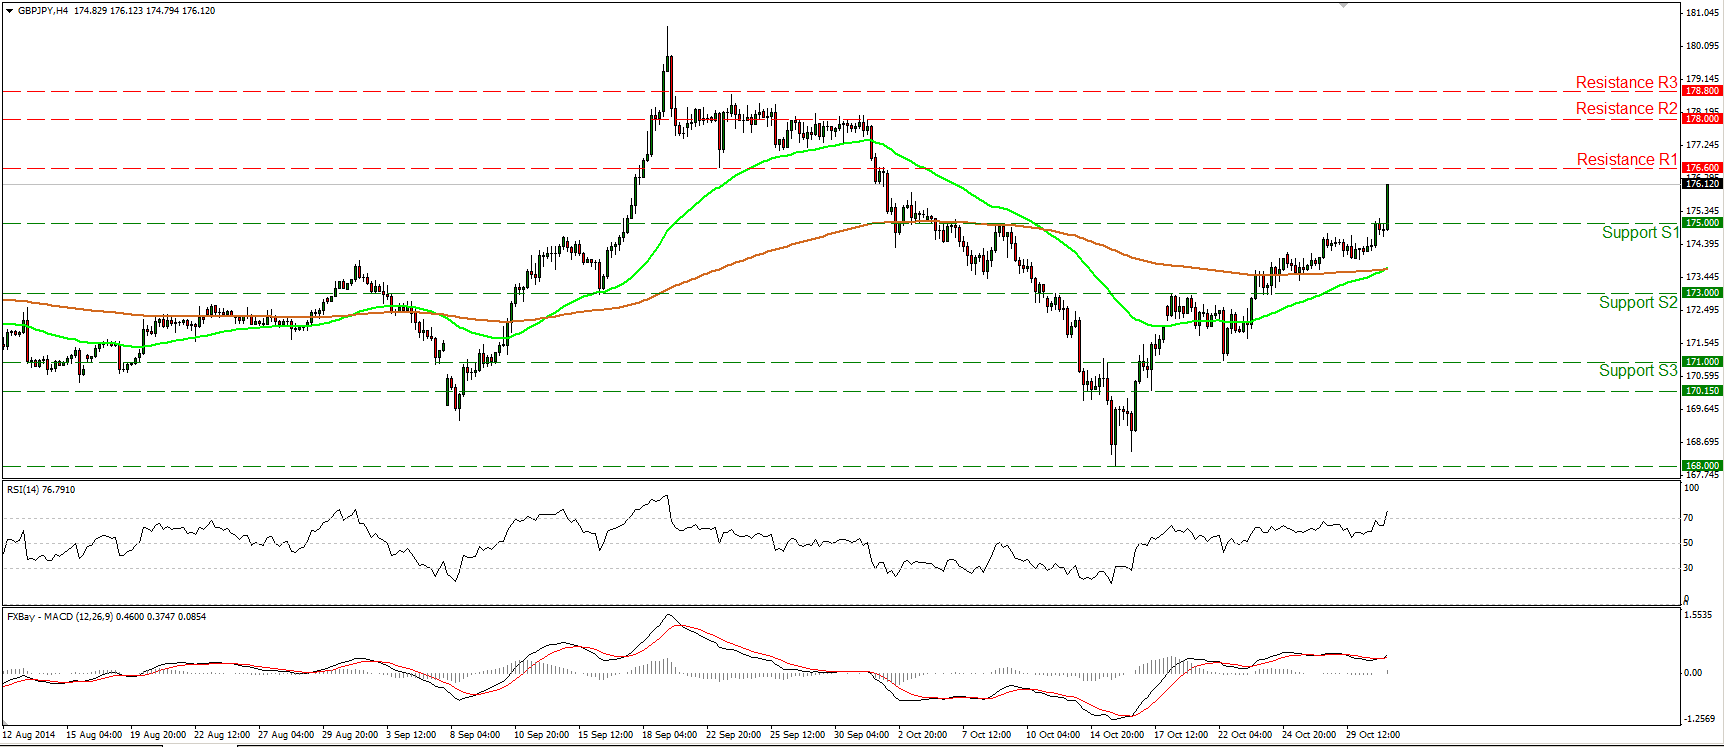
GBP/JPY surged during the early European morning, breaking above the psychological resistance (turned into support line) of 175.00 (S1). I would now expect the rate to challenge our resistance hurdle of 176.60 (R1) any time soon. If the longs are strong enough to overcome that obstacle, we are likely to experience further advances, perhaps towards our next resistance at 178.00 (R2). Shifting my attention to our momentum oscillators, I see that the RSI entered its overbought territory and is pointing up, while the MACD, already positive, just crossed above its trigger line. This designates accelerating upside speed and magnifies the case for further advances in the close future.
• Support: 175.00 (S1), 173.00 (S2), 171.00 (S3)
• Resistance: 176.60 (R1), 178.00 (R2), 178.80 (R3)
EUR/GBP is heading lower
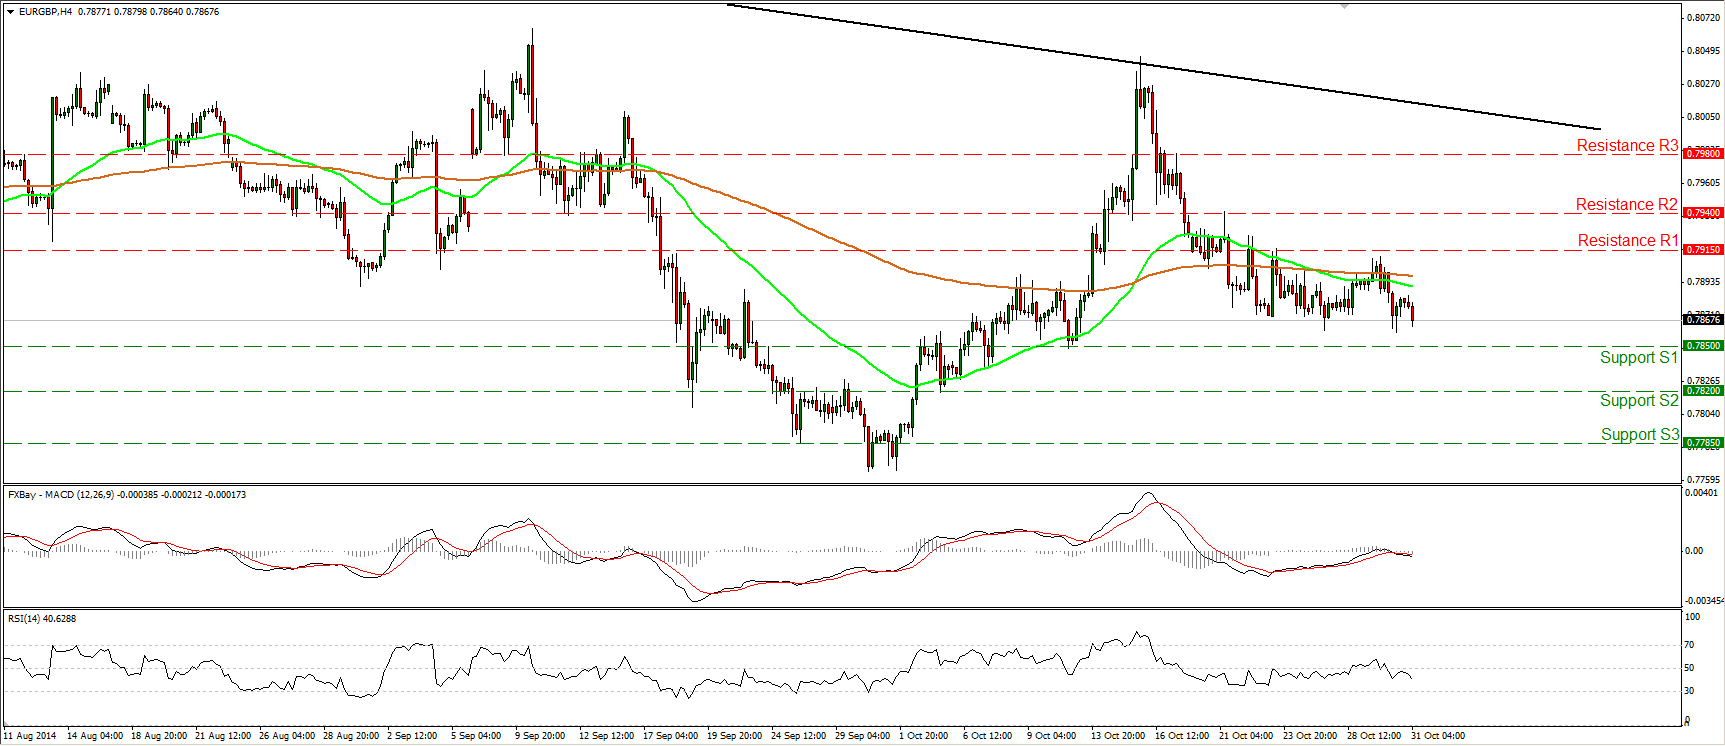
EUR/GBP moved lower yesterday, but remained above the support line of 0.7850 (S1). In my view, as long as the resistance of 0.7915 (R1) holds, the short-term bias remains to the downside and I would expect the rate to reach the support barrier of 0.7850 (S1) in the close future. A clear and decisive break below that obstacle is likely to see scope for extensions, towards our next support at 0.7820 (S2). Moreover, our momentum studies maintain a negative tone. The MACD crossed below both its zero and trigger lines, while the RSI moved lower after finding resistance near its 50 barrier. As for the broader trend, on the daily chart the pair is trading below the longer-term black downtrend line (taken from back at the high of the 1st of August), keeping the overall technical picture negative.
• Support: 0.7850 (S1), 0.7820 (S2), 0.7785 (S3)
• Resistance: 0.7915 (R1), 0.7940 (R2), 0.7980 (R3)
Gold breaks below 1205
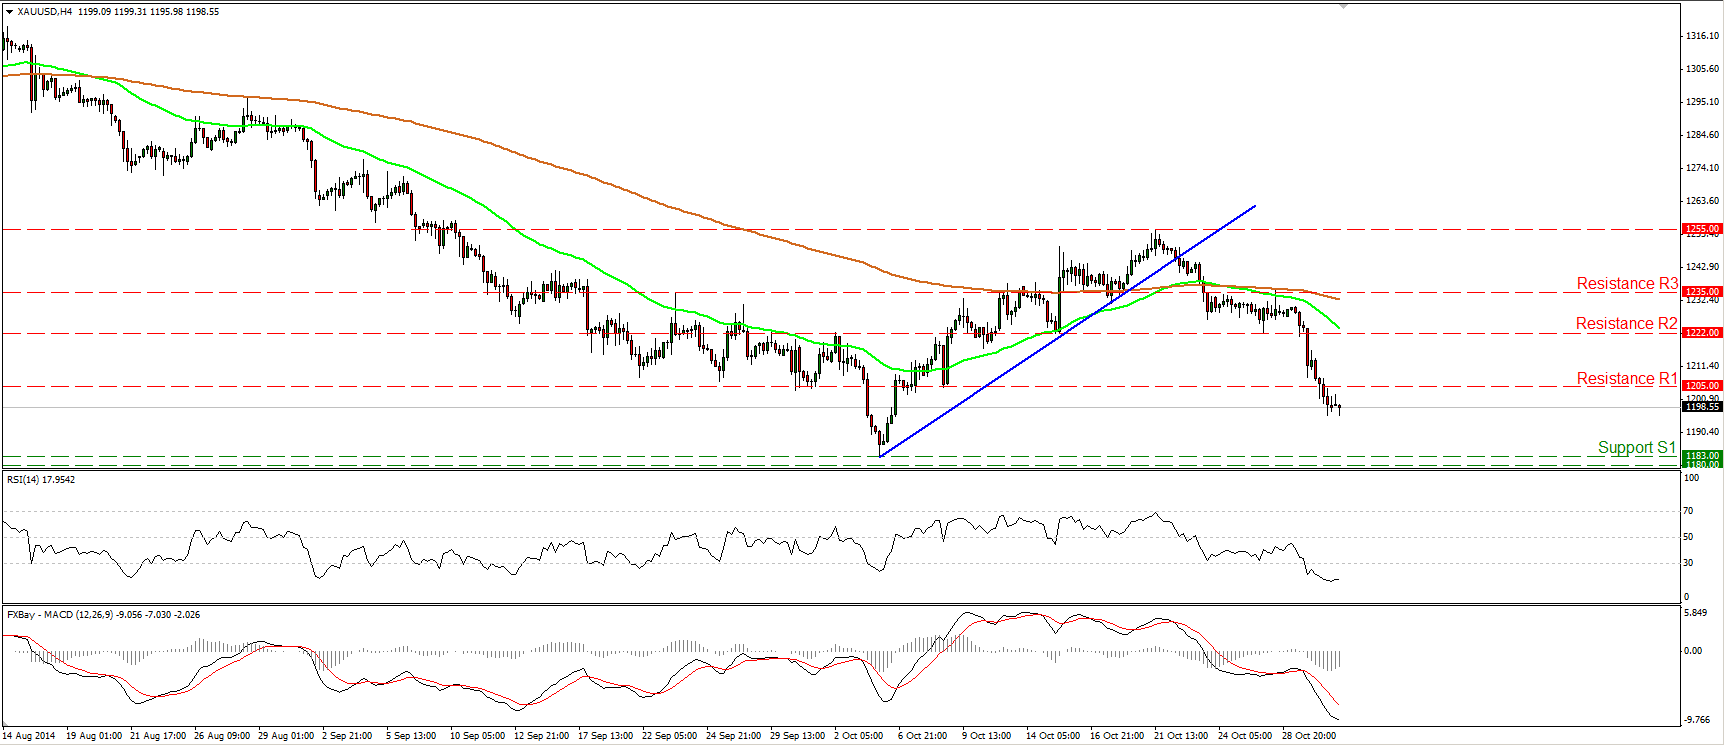
Gold continued plummeting on Thursday, reaching and breaking below the support (turned into resistance) line of 1205 (R1). I would now expect sellers to trigger extensions for another test at the critical support zone of 1180/83, defined by the low of the 6th of October 2014 and the lows of June and December 2013. The MACD remains below both its zero and trigger lines, designating strong bearish momentum and supporting the negative short-term outlook of the precious metal. However, the RSI shows signs of bottoming within its oversold territory, thus I would be careful of a possible upside corrective move before the next leg down.
• Support: 1183 (S1), 1180 (S2), 1156 (S3)
• Resistance: 1205 (R1), 1222 (R2), 1235 (R3)
WTI remains trendless
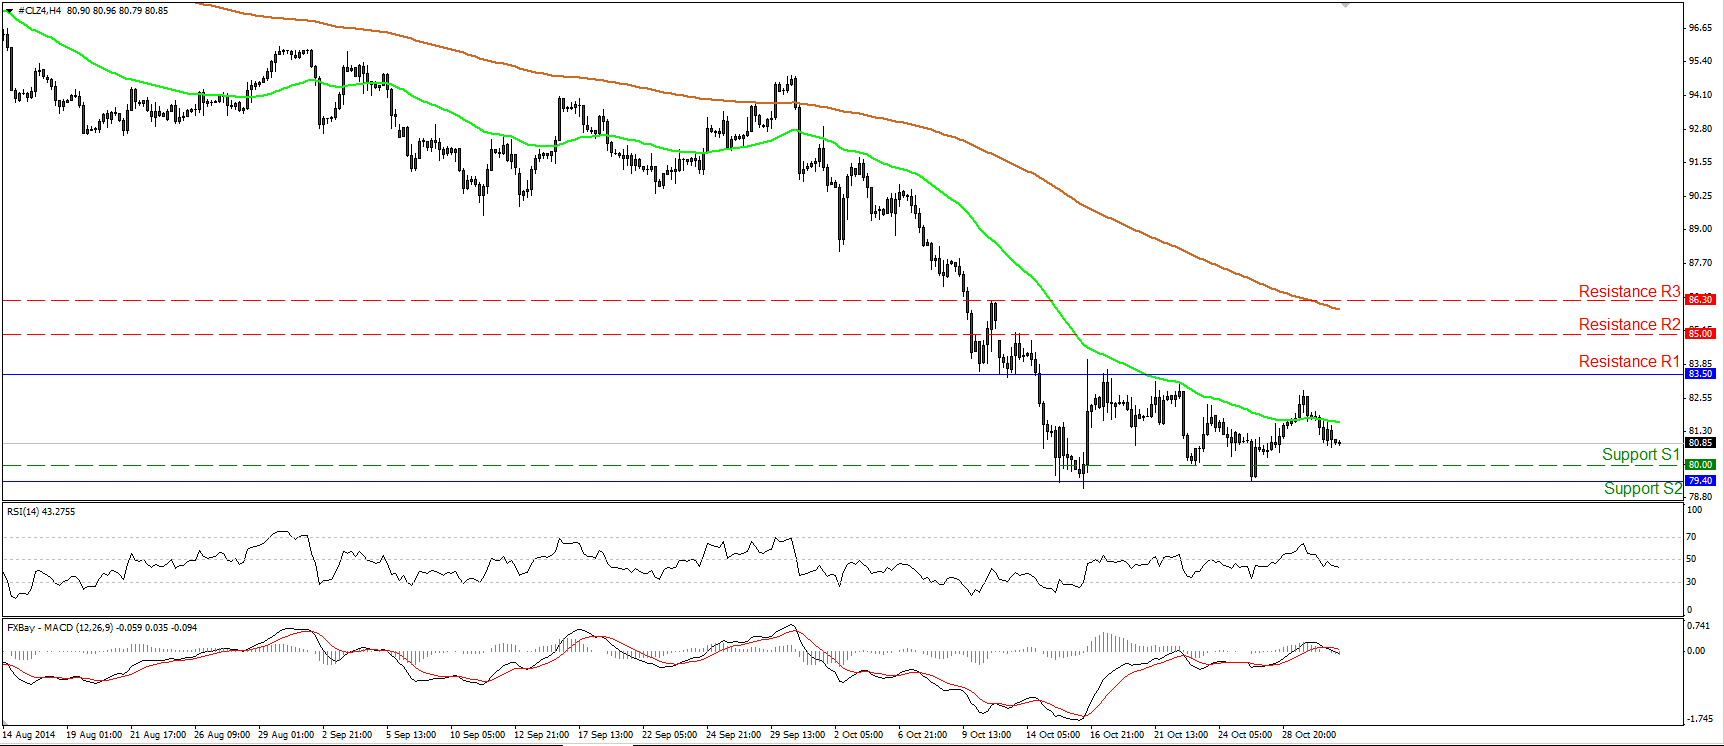
WTI declined on Thursday, but remained within its sideways path, between the support barrier of 79.40 (S2) and the resistance line of 83.50 (R1). Hence, I would maintain my neutral approach and I will repeat that a move above 83.50 (R2) is needed to flip the short-term outlook positive in my view. On the other hand, I would prefer to see a dip below 79.40 (S2), before getting more confident on the downside. In the bigger picture, although I still see a downtrend structure, the 14-day RSI exited its oversold field and moved higher, while the MACD, although below zero, stands above its signal line. These momentum signs give me additional reasons to remain neutral, at least for now.
• Support: 80.00 (S1), 79.40 (S2), 79.00 (S3)
• Resistance: 83.50 (R1), 85.00 (R2), 86.30 (R3)
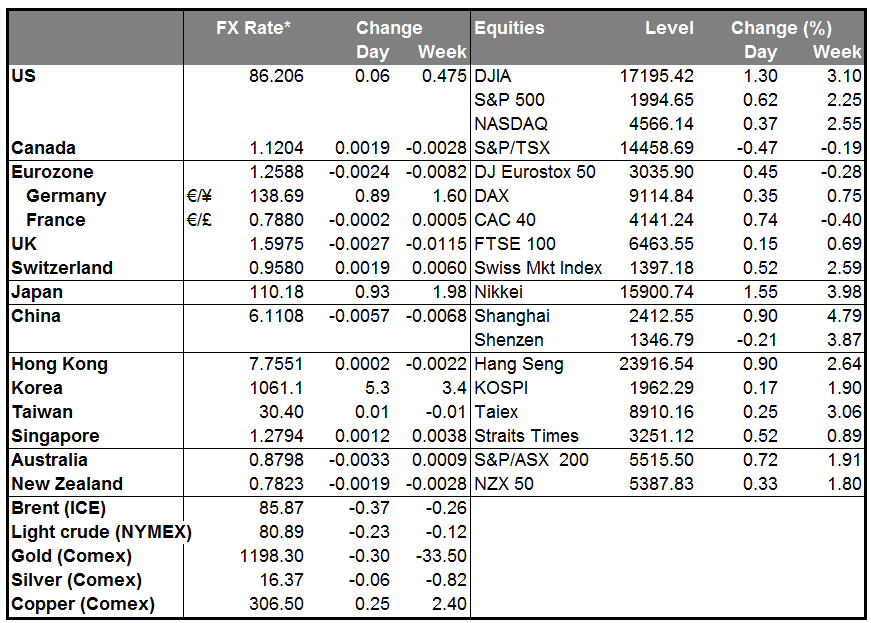
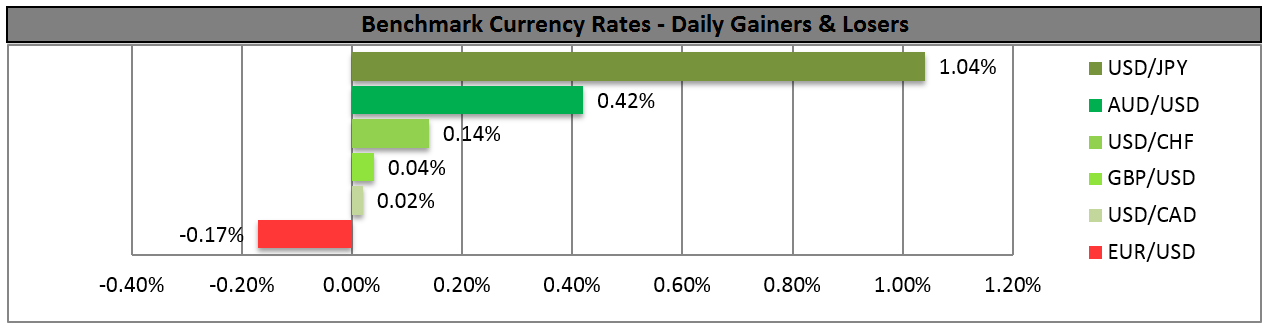
BENCHMARK CURRENCY RATES - DAILY GAINERS AND LOSERS
MARKETS SUMMARY