EUR/USD dips below 1.3400
EUR/USD fell below our support barrier (turned into resistance) of 1.3400 on news that the US economy grew more than anticipated in Q2. Nevertheless, the decline was halted at 1.3365 (S1) after the dovish comments in the FOMC statement regarding the labor market. EUR/USD moved higher after the statement was published and at the European opening is testing the 1.3400 zone as a resistance this time. The price structure remains lower highs and lower lows below both the moving averages, and this keeps the short-term path to the downside, in my view. I still expect the rate to hit 1.3350 (S2), where a clear break could pave the way towards the next support at 1.3300 (S3). On the daily chart, the 50-day moving average lies below the 200-day one, adding to the negative picture of the currency pair.
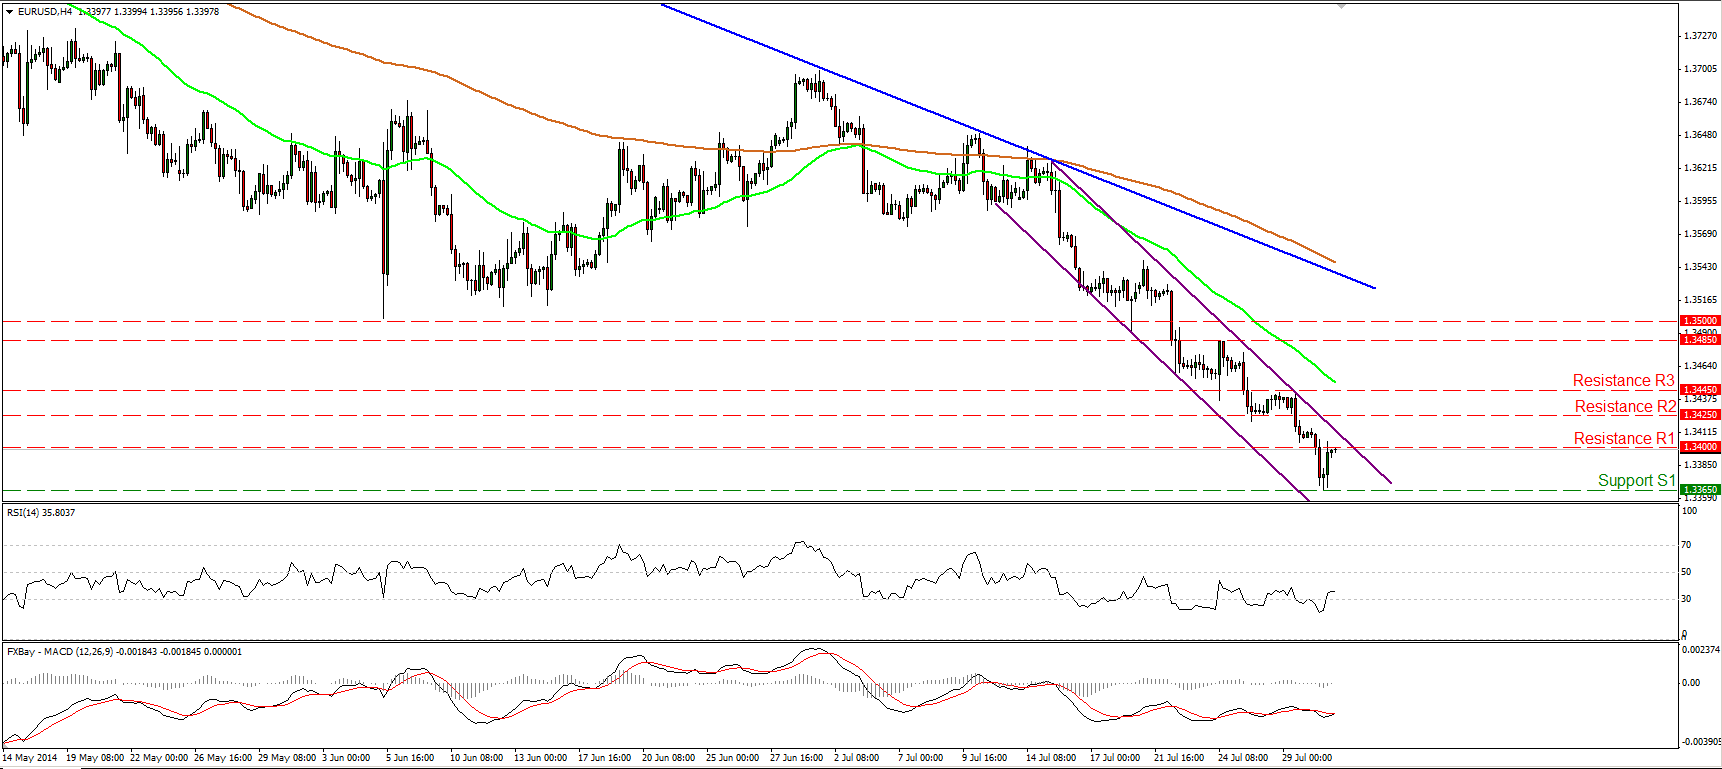
• Support: 1.3365 (S1), 1.3350 (S2), 1.3300 (S3).
• Resistance: 1.3400 (R1), 1.3425 (R2), 1.3445 (R3).
EUR/JPY surges

EUR/JPY rallied and violated the resistance bar (turned into support) of 137.35 after forming a morning doji star on the daily chart. The move signaled the completion of the possible near-term inverted head and shoulders mentioned in previous comments and confirmed a forthcoming higher high. The rally was stopped by the 50% retracement level of the 3rd July – 24th of July decline, at 137.85 (R1), marginally below the 200-period moving average. A move above that area is likely to drive the battle towards the next resistance at 138.45 (R2). Nonetheless, considering our hourly momentum studies, I would expect some consolidation or a pullback near the 137.85 (R1) area. The 14-hour RSI moved lower after exiting overbought conditions, while the MACD fell below its signal line.
• Support: 137.35 (S1), 136.65 (S2), 136.40 (S3).
• Resistance: 137.85 (R1), 138.45 (R2), 138.75 (R3).
GBP/USD is testing the 80-day EMA
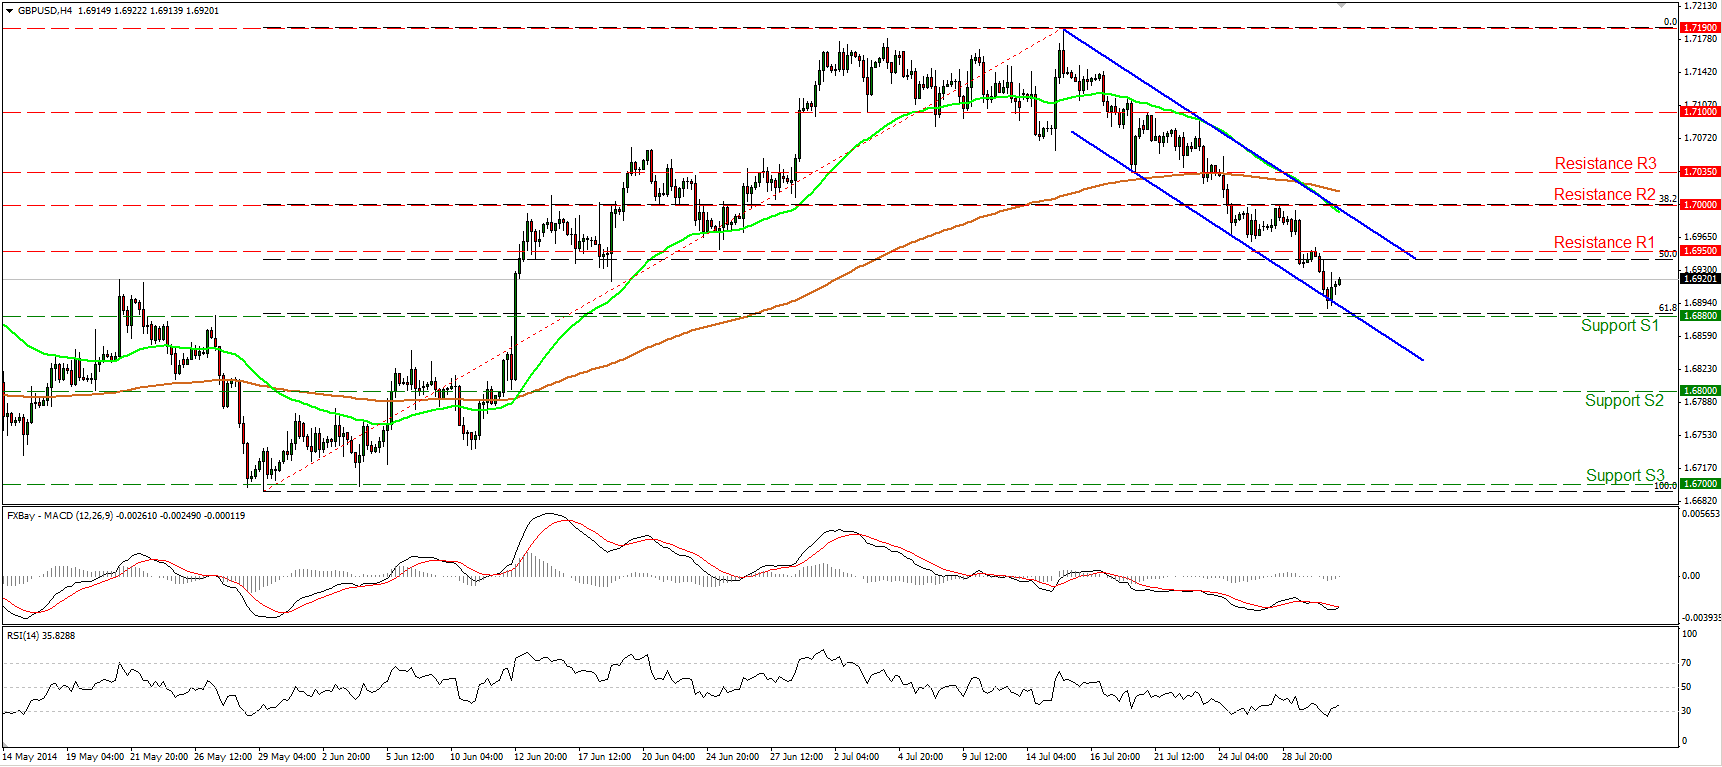
GBP/USD continued declining yesterday, moving below the 1.6950 barrier and the 50% retracement level of the 29th May – 15th of July advance. The rate found support slightly above our support of 1.6880 (S1), which coincides with the 50% retracement level of the aforementioned up move. On the daily chart, the rate is now testing the 80-day exponential moving average, which provided reliable support to the lows of the price action during the current long-term uptrend. As I said in my last comment on Cable, I would give up my bearish stance as far as the short-term picture is concerned (despite the fact that the rate remains within the near-term downside channel) and I would wait to see the market reaction near that zone before reconsidering my analysis.
• Support: 1.6880 (S1), 1.6800 (S2), 1.6700 (S3).
• Resistance: 1.6950 (R1), 1.7000 (R2), 1.7035 (R3).
Gold not choosing direction

Gold moved somewhat lower, remaining marginally above the prior downside trend line. The precious metal remains within the range between the support zone of 1285/90 and the resistance of 1312 (R1), which coincides with the 200-day moving average. Although the positive divergence between our momentum indicators and the price action is still in effect, the 50-period moving average remains below the 200-period one, which is a negative signal. Bearing in mind these mixed technical signals, I would maintain my flat view for now. On the daily chart, both the 50-day and 200-day moving averages are still pointing sideways, confirming the unclear picture of gold.
• Support: 1290 (S1), 1285 (S2), 1265 (S3).
• Resistance: 1312 (R1), 1325 (R2), 1345 (R3) .
WTI tumbles below 100.45

WTI plunged on Wednesday, falling below the 100.45 hurdle, the 61.8% retracement level of prior near-term advance. This confirms my view that a move below that level would carry larger bearish implications. I still expect WTI to challenge the lows of the 15th of July, at 98.65 (S1). However, zooming on the 1-hour chart, I see that the 14-hour RSI tries to exit its oversold field, while the hourly MACD shows signs of bottoming and could move above its signal line in the near future. As a result, I would expect some short-covering before sellers prevail again.
• Support: 98.65 (S1), 98.00 (S2), 97.30 (S3).
• Resistance: 100.45 (R1), 101.00 (R2), 101.65 (R3).
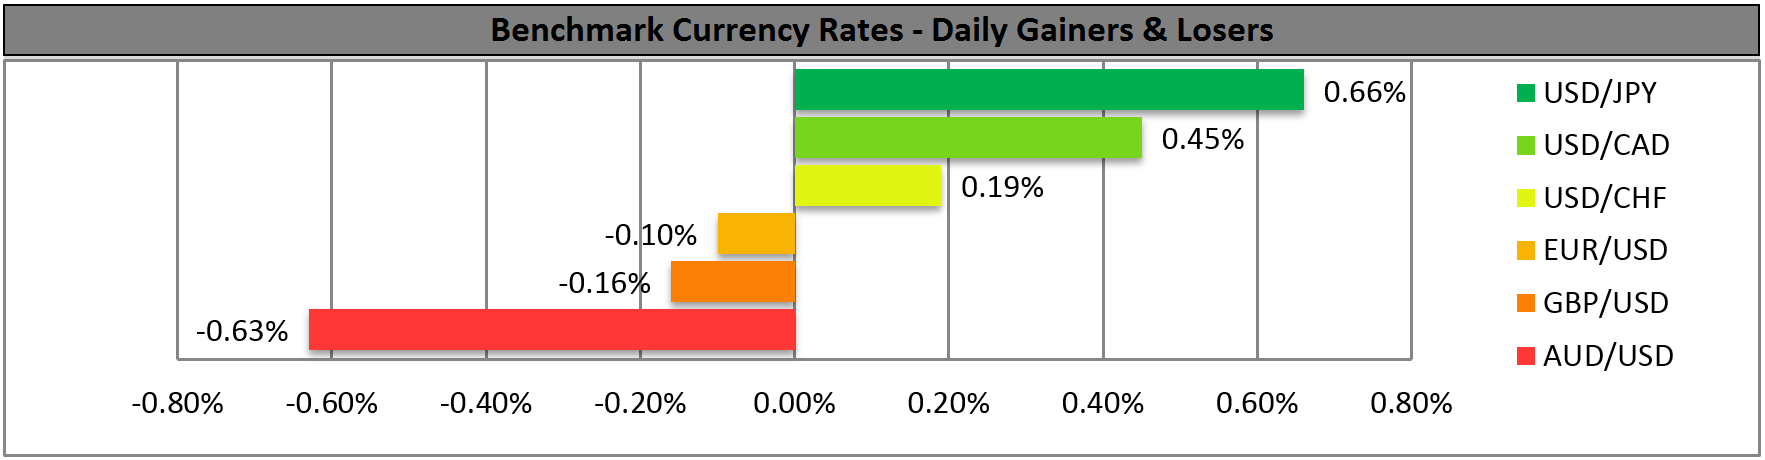
BENCHMARK CURRENCY RATES - DAILY GAINERS AND LOSERS
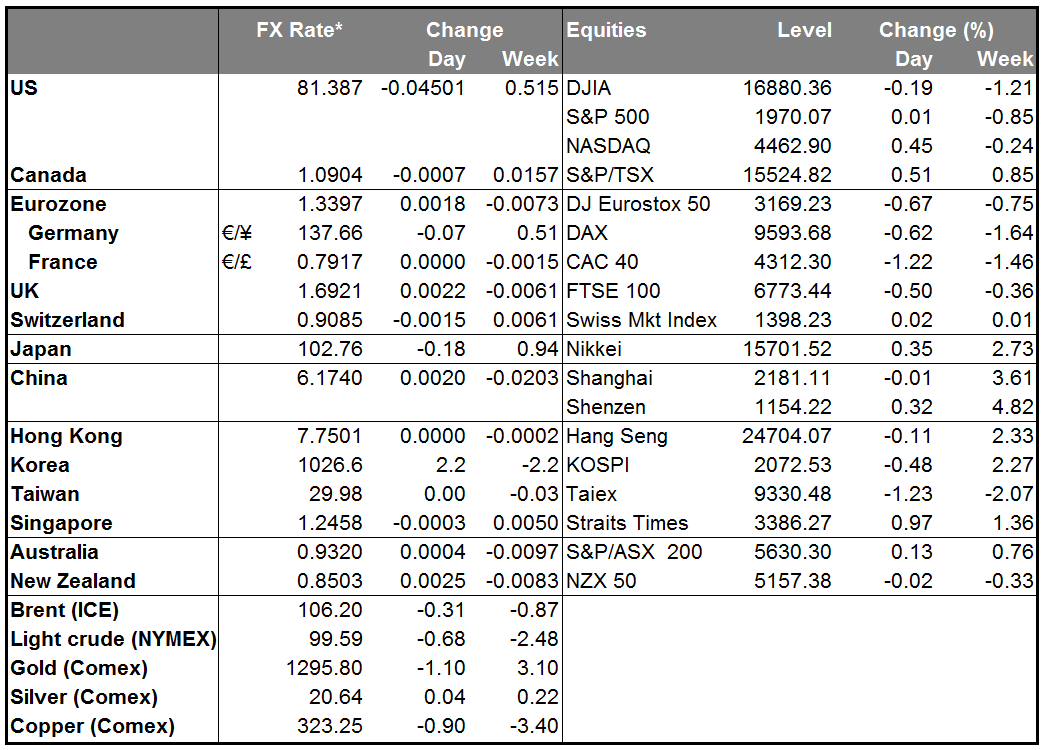
MARKETS SUMMARY