
EUR/USD finds support marginally above 1.3400
EUR/USD declined slightly on Tuesday after finding support 3 pips above our support barrier of 1.3400 (S1). The pair continues to print lower peaks and lower troughs below both the moving averages, thus I still see a negative short-term picture. A decisive move below 1.3400 (S1) could target our next support level at 1.3350 first. Nevertheless, I can see positive divergence between the rate and both our momentum indicators, indicating that the trend is losing some downside momentum. As a result, I would consider a dip below 1.3400 (S1) more reliable if it is accompanied with accelerating momentum signs, such as the elimination of the positive divergence. On the daily chart, the 50-day moving average lies below the 200-day one, adding to the negative picture of the currency pair.
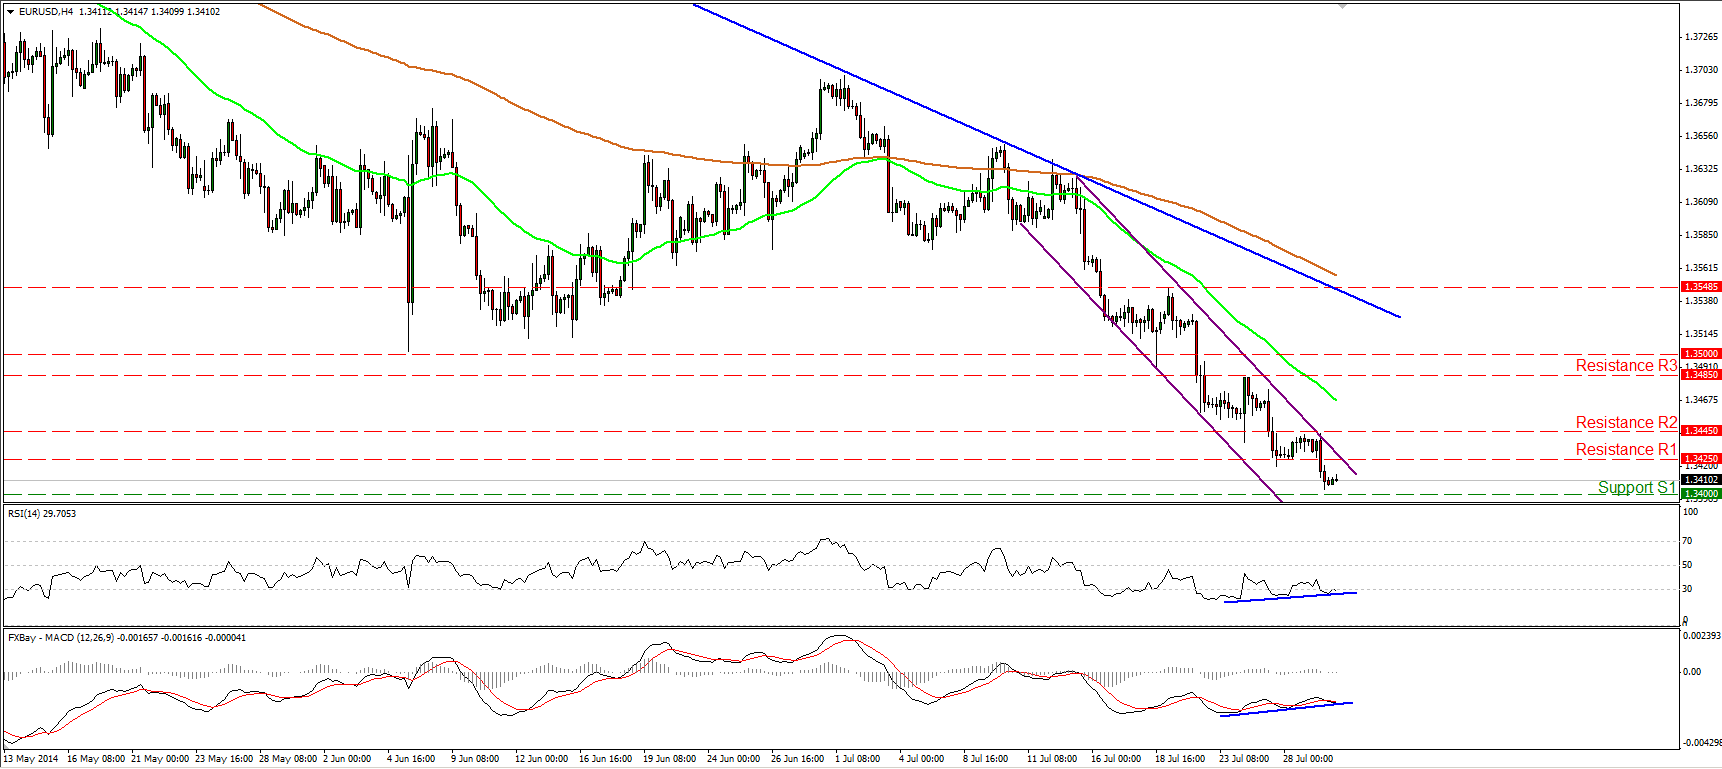
• Support: 1.3400 (S1), 1.3350 (S2), 1.3300 (S3)
• Resistance: 1.3425 (R1), 1.3445 (R2), 1.3485 (R3)
USD/JPY continues higher
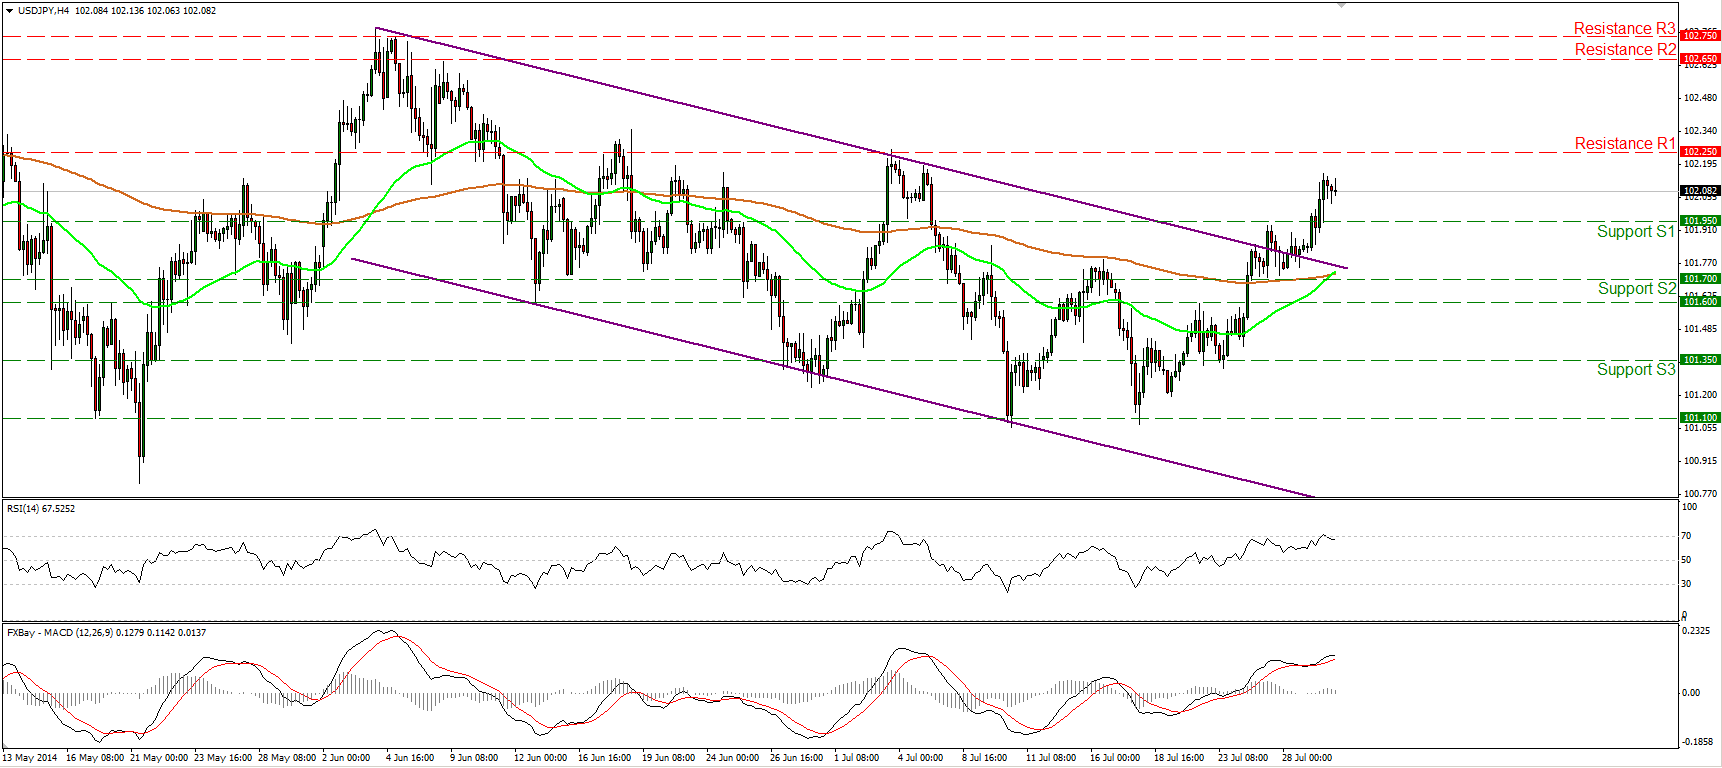
USD/JPY edged higher, breaking above the resistance (turned into support) of 101.95. This confirms the exit of the downside channel and turns the bias to the upside. As I said yesterday, a move above that level could pave the way towards the resistance of 102.25 (R1). A decisive break of the 102.25 (R1) is likely to have larger bullish implications and could pave the way towards the resistance zone of 102.65/75. My concern is that, zooming on the 1-hour chart, the 14-hour RSI left its overbought zone and moved lower, while the MACD fell below its signal line. Having that in mind, I would be cautious for a possible pullback before the bulls shift the gear up again.
• Support: 101.95 (S1), 101.70 (S2), 101.60 (S3)
• Resistance: 102.25 (R1), 102.65 (R2), 102.75 (R3)
EUR/GBP consolidates
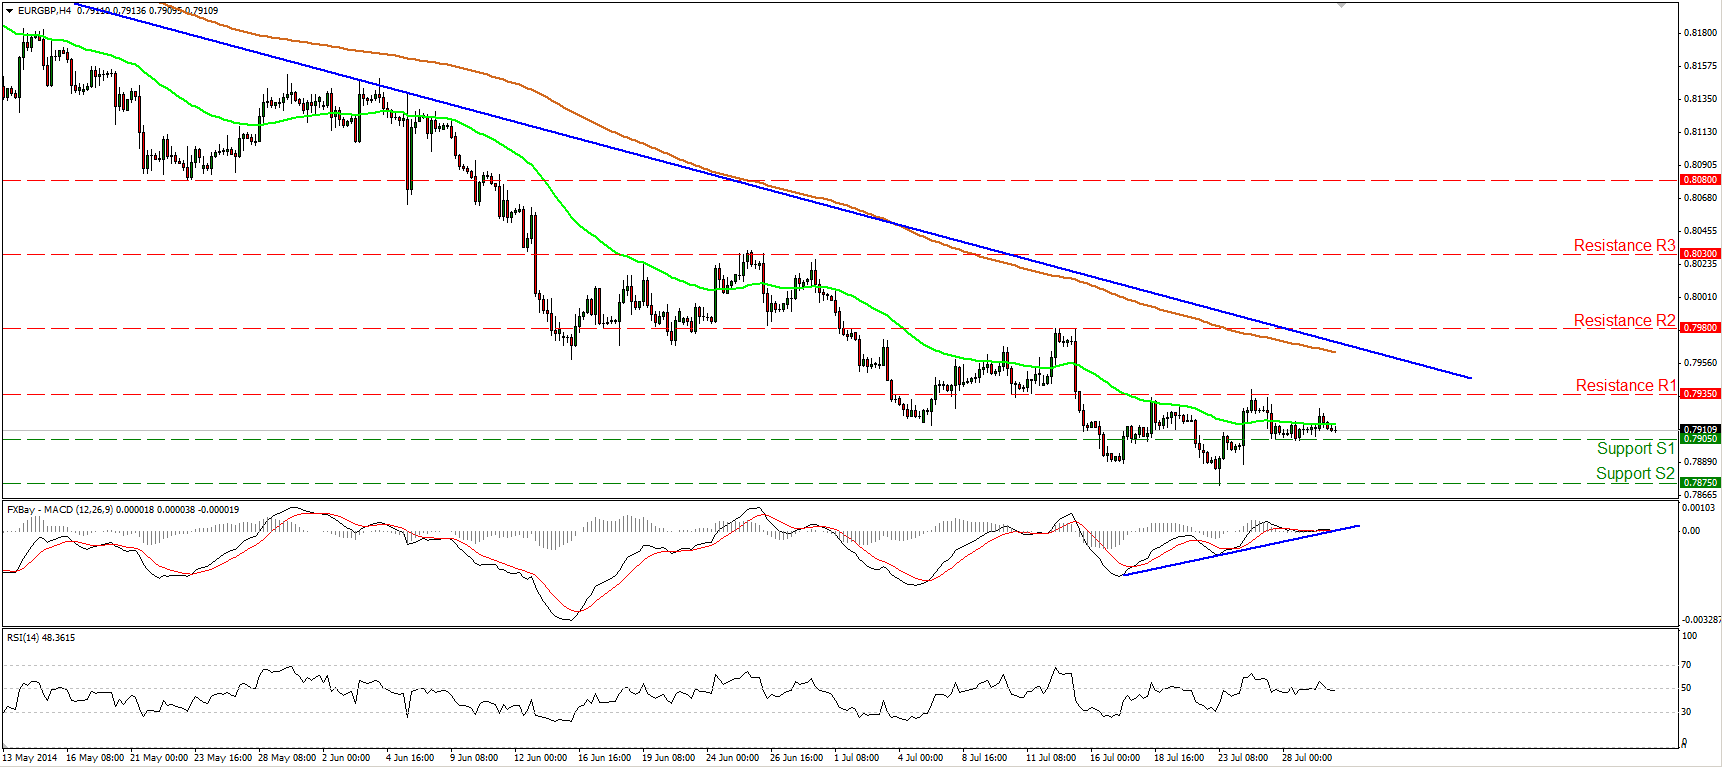
EUR/GBP moved sideways yesterday, remaining between the 0.7905 (S1) and 0.7935 (R1) barriers. Although the overall trend remains to the downside (marked by the downtrend line drawn from back the 11th of April), the positive divergence between the MACD and the price action remains in effect, confirming the inability of the bears to push the rate lower. Also, the positive divergence I see on the daily chart between the price action and both the daily MACD and the 14-day RSI is still in effect. This supports my view that this downtrend is not that firmly established. I would regain my confidence on the downtrend upon a dip below 0.7875 (S2). Such a dip would confirm a forthcoming lower low and could trigger extensions towards 0.7815 (S3)
• Support: 0.7905 (S1), 0.7875 (S2), 0.7815 (S3)
• Resistance: 0.7935 (R1), 0.7980 (R2), 0.8030 (R3)
Gold still trendless
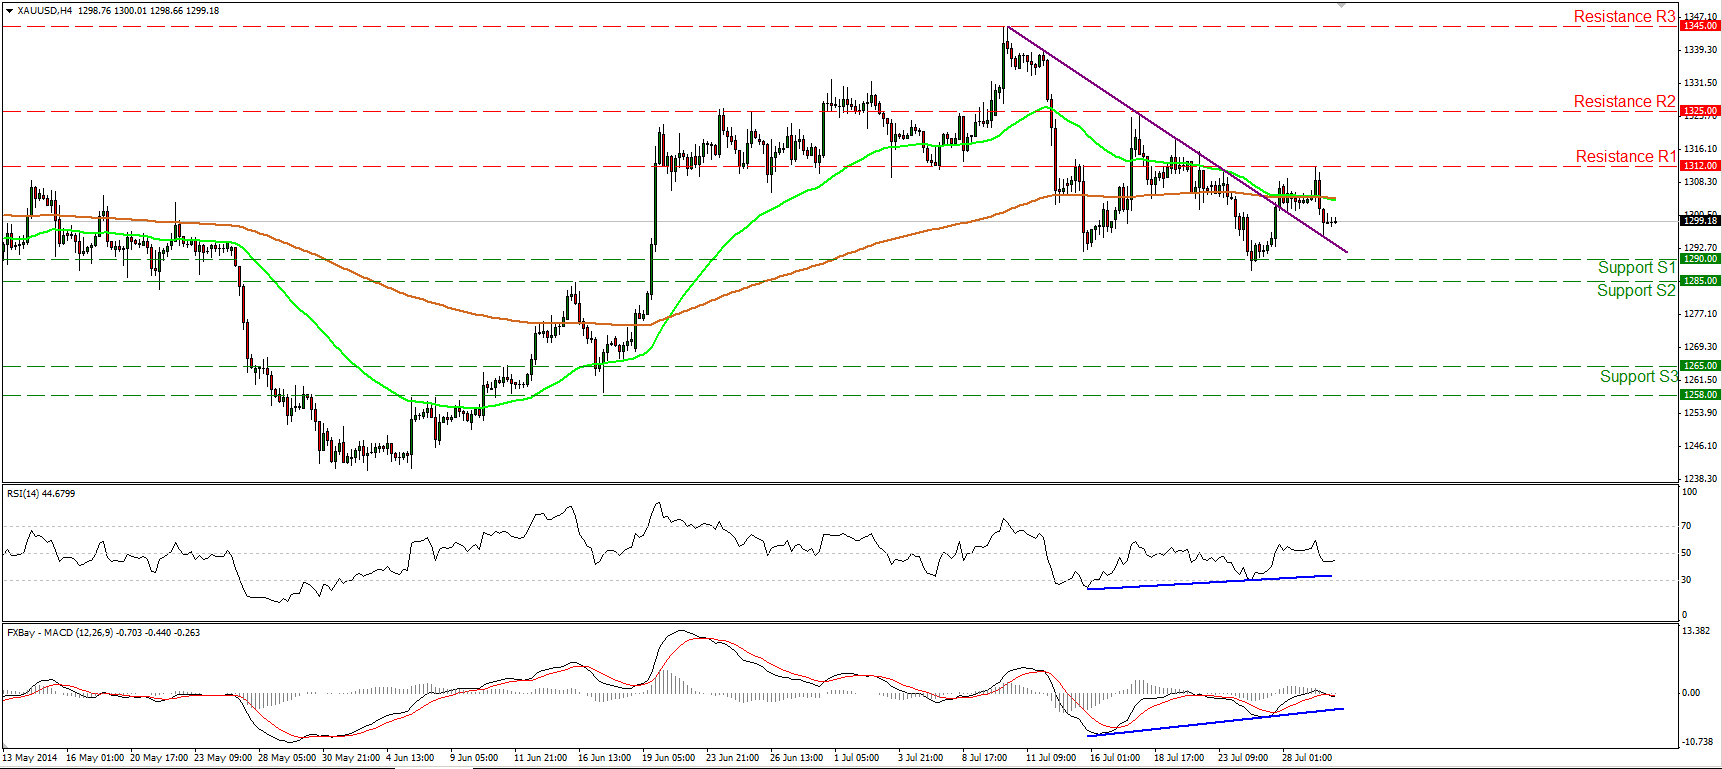
Gold tried to move higher, but after hitting 1312 (R1), which coincides with the 200-day moving average, it moved lower to find support at the prior trend line. Although the positive divergence between both our momentum studies and the precious metal is still in effect, the 50-period moving average moved somewhat below the 200-period one. Bearing in mind these mixed technical signals, I would remain to the sidelines. On the daily chart, both the 50-day and 200-day moving averages are still pointing sideways, corroborating my flat view, at least for now.
• Support: 1290 (S1), 1285 (S2), 1265 (S3)
• Resistance: 1312 (R1), 1325 (R2), 1345 (R3)
WTI rebounds near 100.45
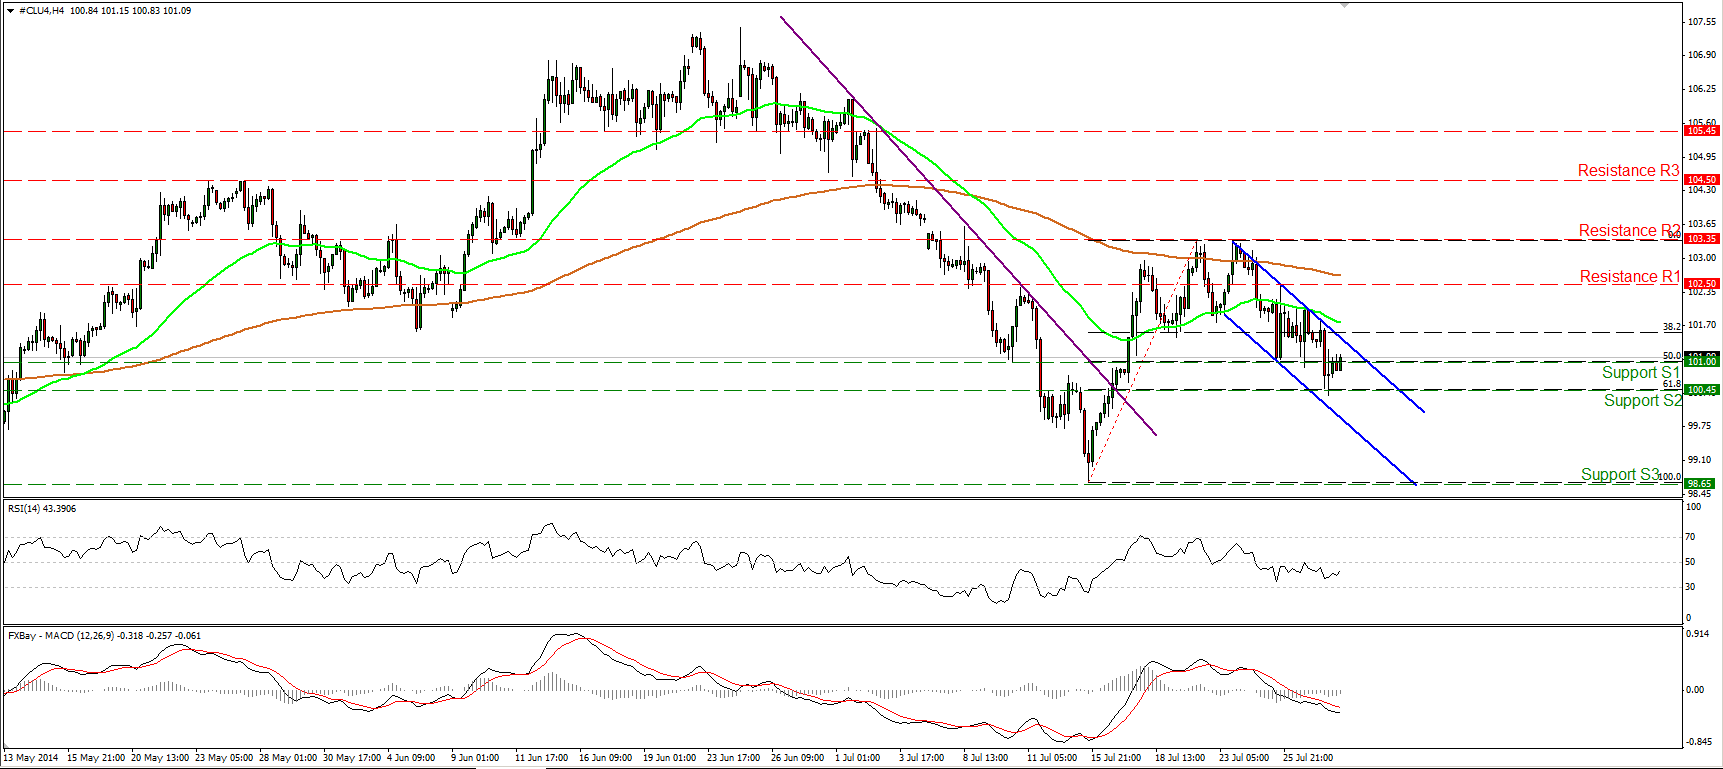
WTI tumbled yesterday but after finding some buy orders slightly below 100.45 (S2), the 61.8% retracement level of prior near-term advance, it rebounded to trade once again above 101.00 (S1). As I mentioned in previous comments, I would like to see a clear move below that bar before getting really bearish on oil. Such a move could target the area of 98.65 (S3), the low of the 15th of July. As long as WTI is trading within the downside channel the minor-term outlook remains cautiously to the downside. A move above 102.50 (R1) would dampen the bearish bias and would confirm that the recent decline was just a 61.8% retracement of the aforementioned up move.
• Support: 101.00 (S1), 100.45 (S2), 98.65 (S3)
• Resistance: 102.50 (R1), 103.35 (R2), 104.50 (R3)
BENCHMARK CURRENCY RATES - DAILY GAINERS AND LOSERS

MARKETS SUMMARY
