EUR/USD trades virtually unchanged
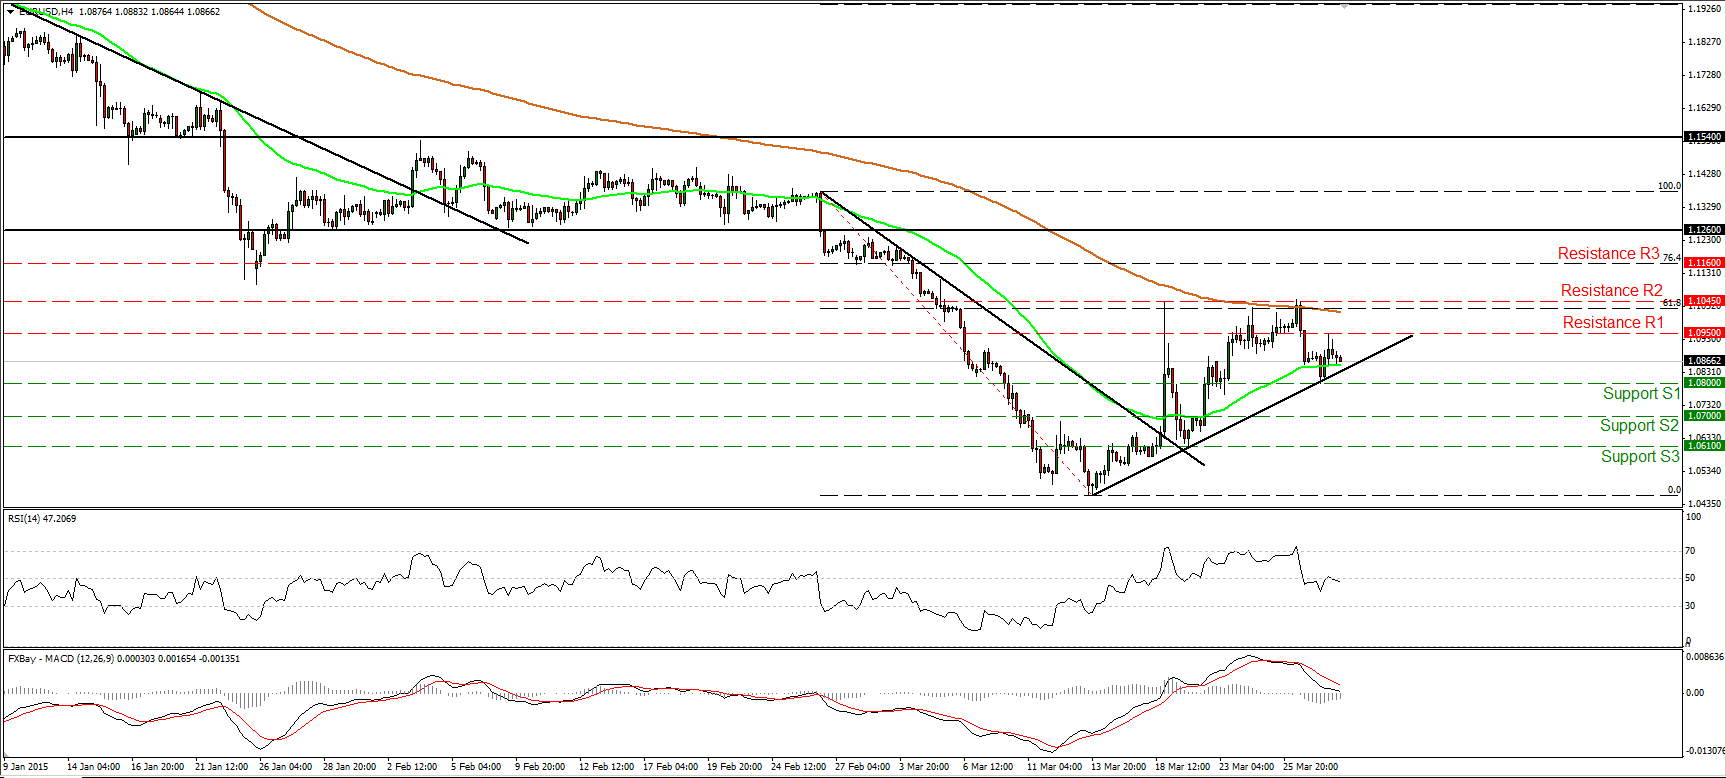
EUR/USD found support at 1.0800 (S1), rebounded to hit resistance at 1.0950 (R1), and then retreated somewhat to eventually trade virtually unchanged. The rate is trading above a possible uptrend line taken from the low of the 13th of March, but our momentum studies favor future declines. The RSI stands below 50 and points south, while the MACD lies below its trigger and could obtain a negative sign any time soon. Therefore, I would switch my stance to neutral at the moment. A break below the support of 1.0800 (S1) is the move that could turn the short-term bias to the downside in my view, and perhaps set the stage for extensions towards our next support obstacle at 1.0700 (S2). As for the broader trend, I still see a longer-term downtrend. The pair is forming lower highs and lower lows below both the 50- and the 200- day moving averages. As a result, I would treat the recovery from 1.0460 as a corrective phase of the larger down path.
• Support: 1.0800 (S1), 1.0700 (S2), 1.0610 (S3).
• Resistance: 1.0950 (R1), 1.1045 (R2), 1.1160 (R3).
EUR/JPY turns down
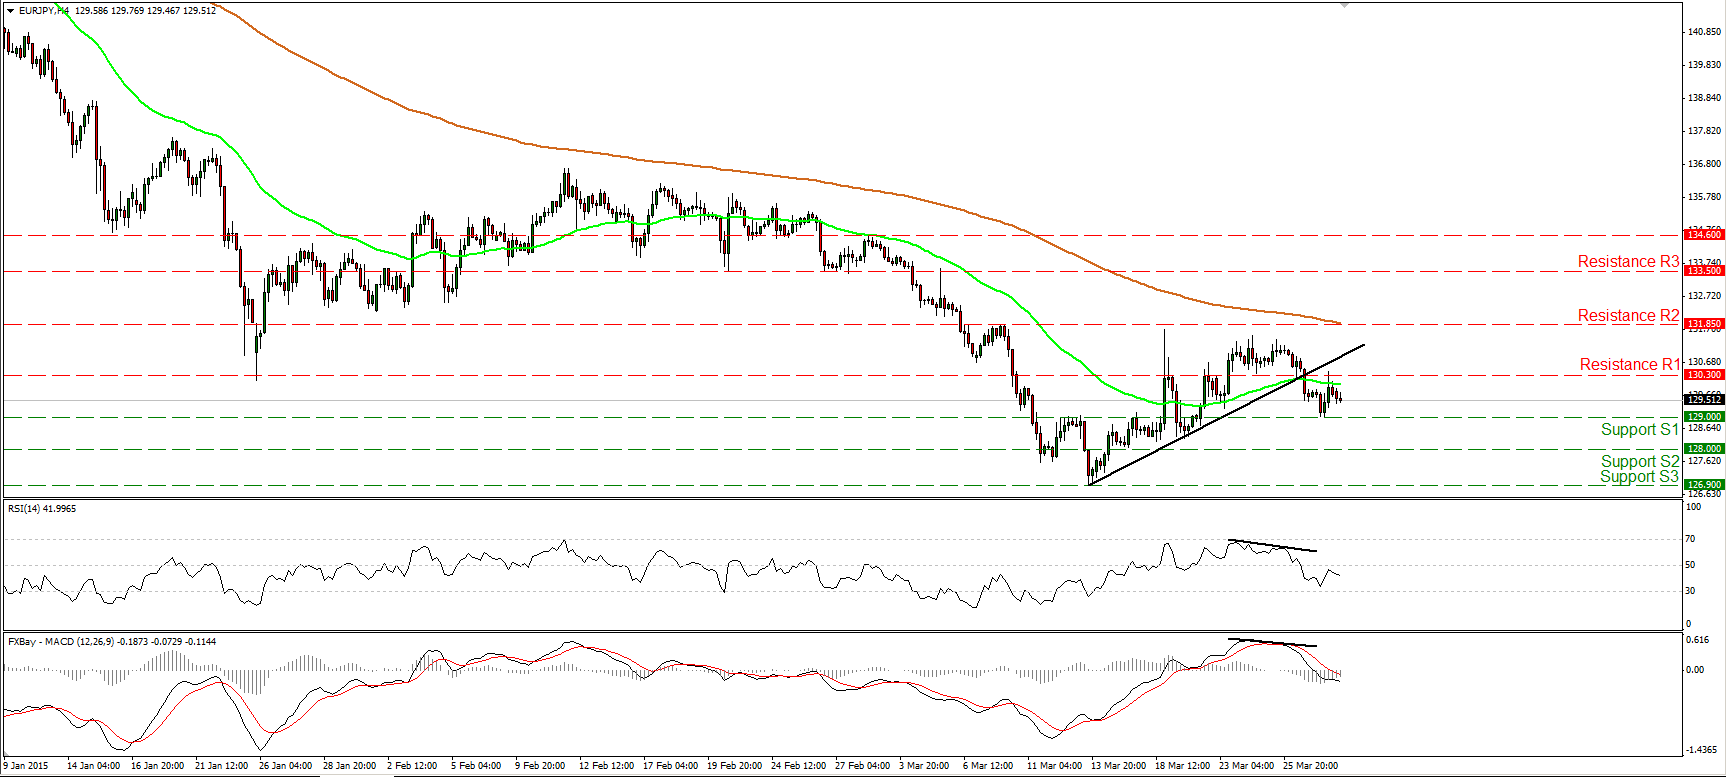
EUR/JPY fell below the short-term uptrend line on Thursday, confirming the negative divergence between our short-term oscillators and the price action. On Friday, the rate rebounded somewhat but hit resistance marginally above 130.30 (R1) and slid again. In my opinion, the short-term picture has turned negative and I believe that a break below 129.00 (S1) could see scope for extensions towards 128.00 (S2). Our short-term momentum indicators support that scenario. The RSI found resistance slightly below its 50 line and turned down, while the MACD, already below its signal line, dipped into its negative field. As for the broader trend, I still see a longer-term downtrend. The recent switch in the short-term outlook corroborates my view that the recovery from 126.90 was just a retracement of the larger down path.
• Support: 129.00 (S1), 128.00 (S2), 126.90 (S3).
• Resistance: 130.30 (R1), 131.85 (R2), 133.50 (R3).
GBP/USD still in a trendless mode
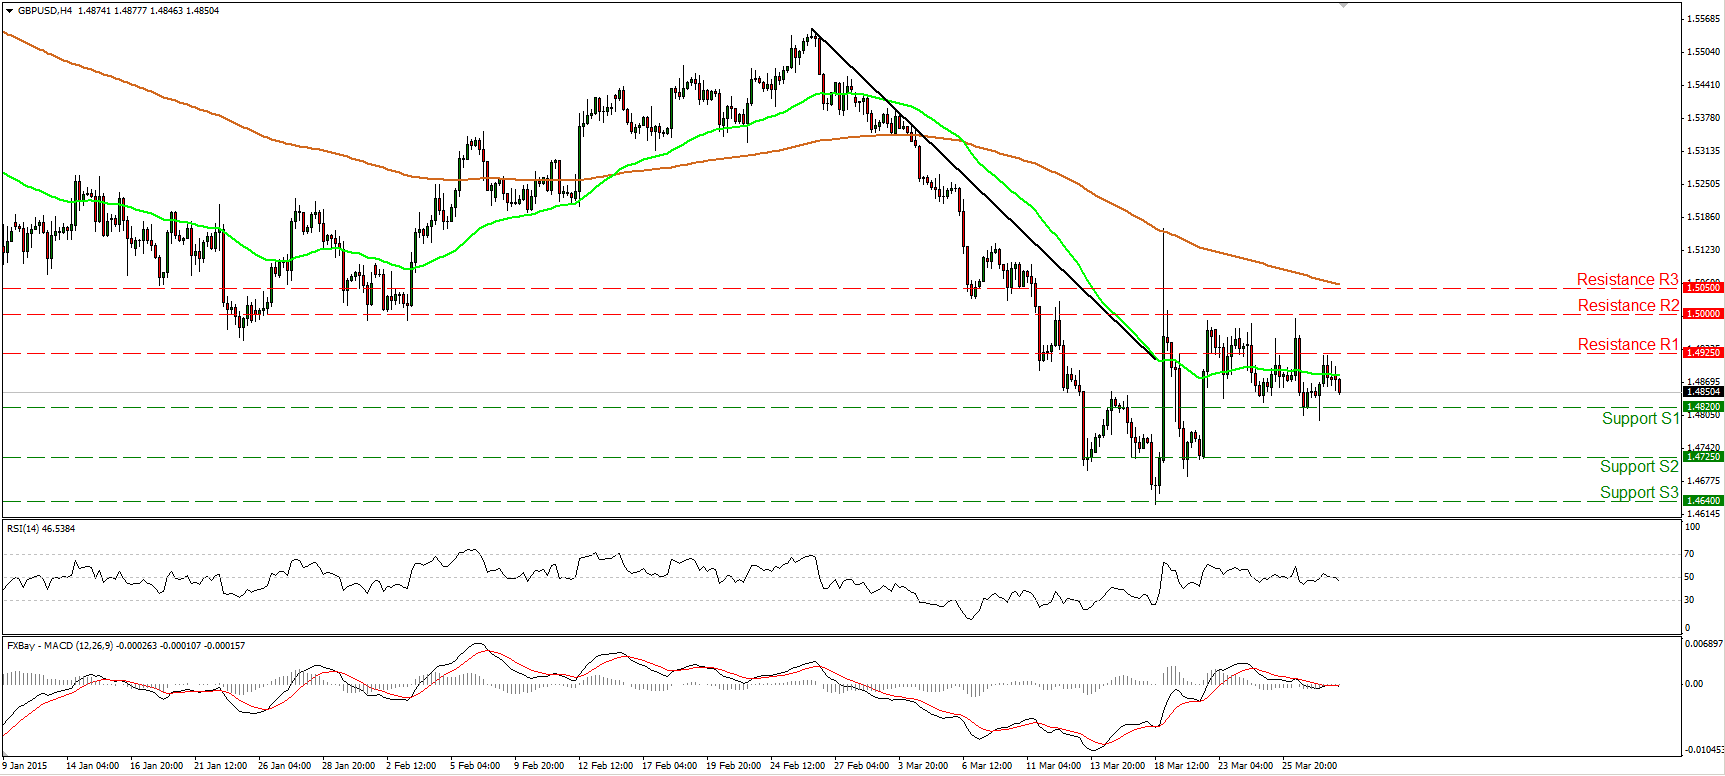
GBP/USD moved somewhat lower after finding resistance at 1.4925 (R1). I would maintain the view that the short-term picture is neutral. The trendless outlook is also supported by our near-term momentum indicators. The RSI gyrates around its 50 line, while the MACD lies near it zero line and points sideways. However, zooming in on the 1-hour chart, our hourly oscillators amplify the case for a leg down. The 14-hour RSI fell below its 50 line, while the hourly MACD crossed below both its zero and trigger lines. A clear break below 1.4820 (S1) could confirm these momentum signs and perhaps pull the trigger for the next support barrier at 1.4725 (S2). As for the bigger picture, the price structure on the daily chart still suggests a larger downtrend. This is another reason I would expect the rate to exit its sideways range to the downside .
• Support: 1.4820 (S1), 1.4725 (S2), 1.4640 (S3).
• Resistance: 1.4925 (R1), 1.5000 (R2), 1.5050 (R3).
Gold pulls back below 1200
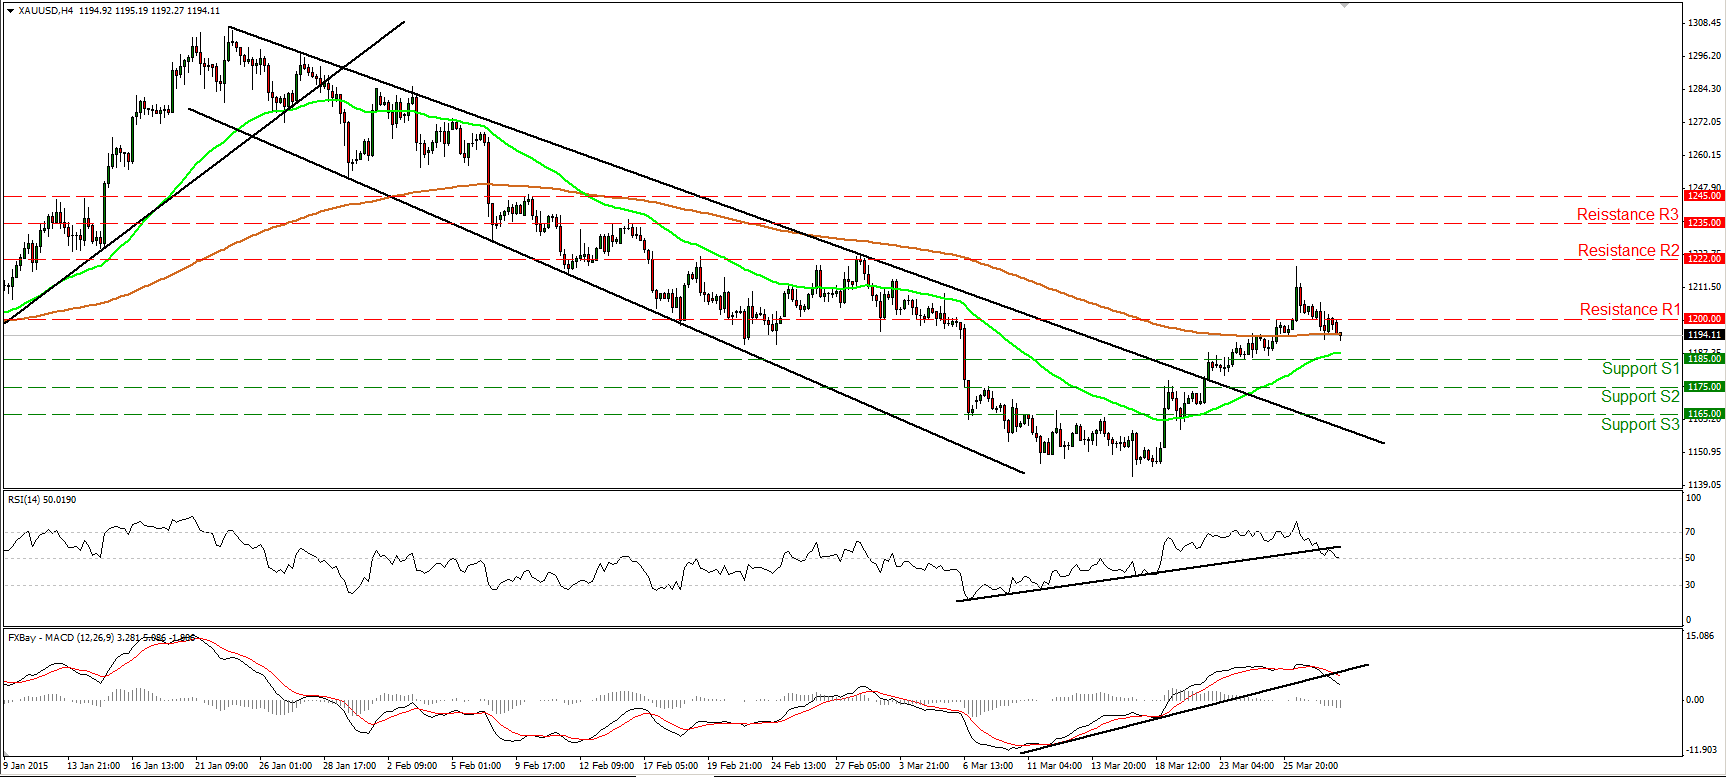
Gold slid on Friday and fell back below the psychological line of 1200 (S1). Taking into account our momentum signs, I would expect the tumble to continue and challenge our support line 1185 (S1). The RSI broke below its upside support line and looks ready to move below 50, while the MACD, already below its upside support line and below its trigger line, is pointing down. A decisive dip below 1185 (S1) could extend the decline, probably towards 1175 (S2). As far as the bigger picture is concerned, since the peak at 1307, the price structure has been lower highs and lower lows. I would consider the recovery from around 1140 as a corrective move which, having in mind the short-term picture, might be over.
• Support: 1185 (S1), 1175 (S2), 1165 (S3).
• Resistance: 1200 (R1), 1222 (R2), 1235 (R3).
WTI trades back below 50
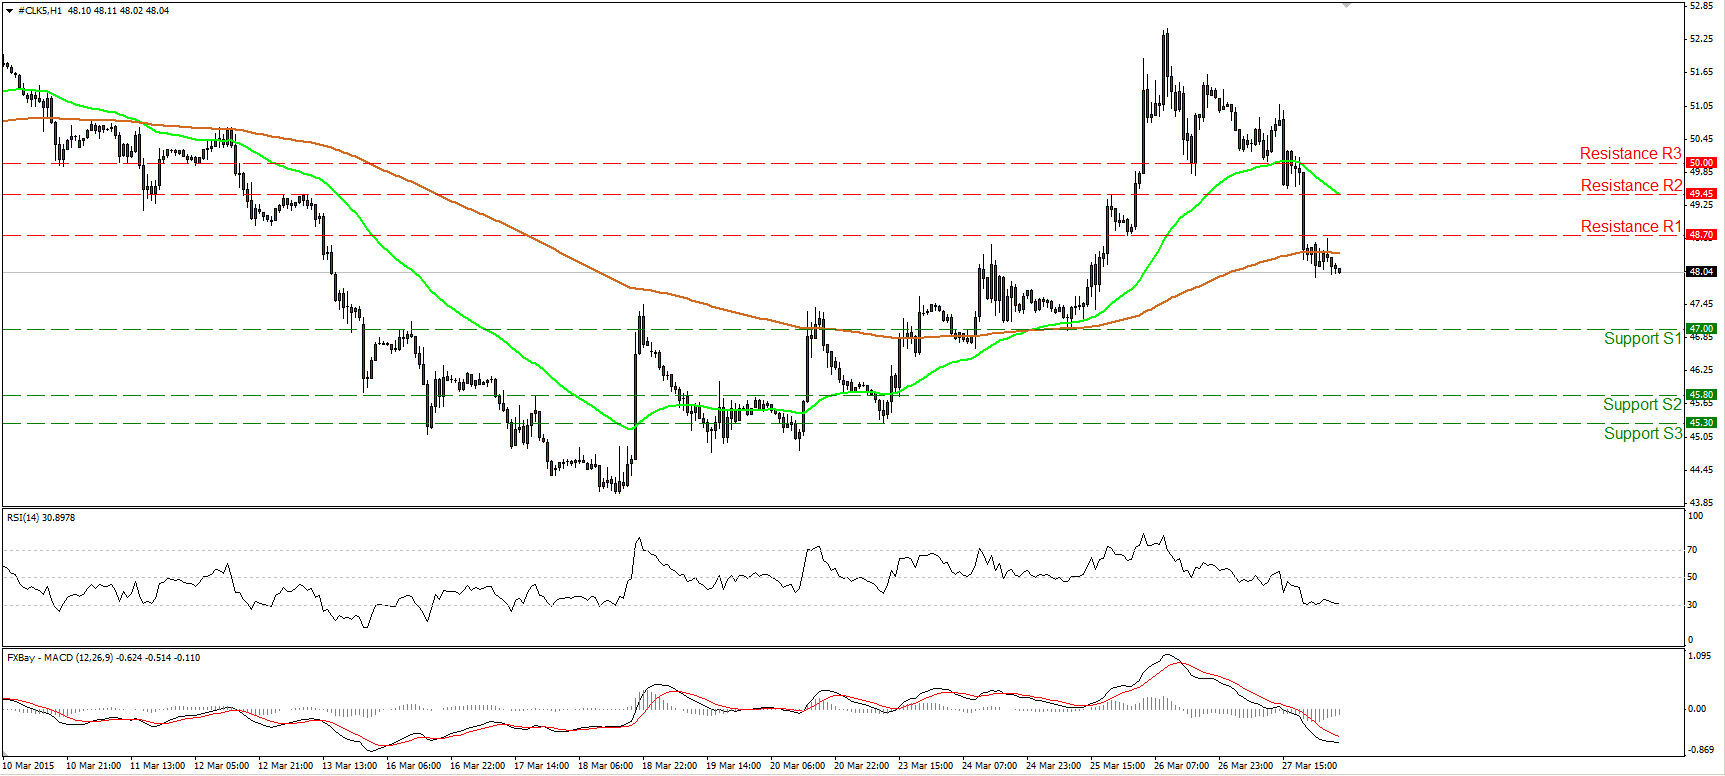
WTI collapsed on Friday, breaking below the key line of 50 and completing the failure swing top formation mentioned in Friday’s comment. WTI drilled three support barriers in a row and is now trading below 48.70 (R1). The outlook on the 1-hour chart has now turned negative and I would expect the bears to target the support line of 47.00 (S1). Our short-term momentum studies support the notion. The RSI continued lower and could move below its 30 line soon, while the MACD keeps falling below both its trigger and zero lines. On the daily chart, WTI is trading well below the 200-day moving average, and is now back below the 50-day one. This keeps the longer-term downtrend still intact. Nevertheless, there is positive divergence between the daily oscillators and the price action. Therefore, I would prefer to wait for price and momentum alignment before getting again confident on the larger down path.
• Support: 47.00 (S1), 45.80 (S2), 45.30 (S3).
• Resistance: 48.70 (R1) 49.45 (R2), 50.00 (R3).
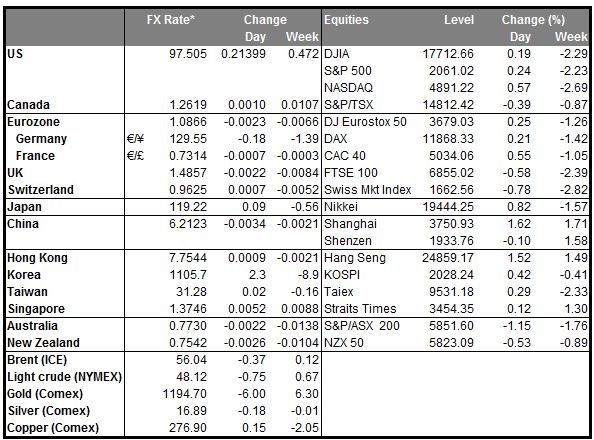
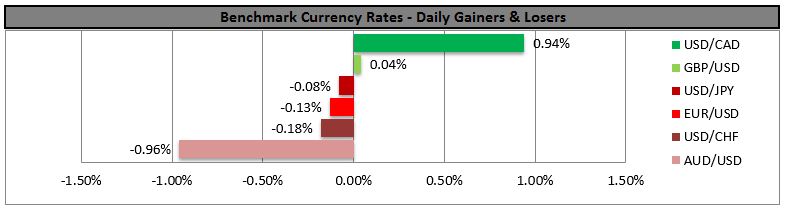
BENCHMARK CURRENCY RATES - DAILY GAINERS AND LOSERS
MARKETS SUMMARY