EUR/USD lower but still above 1.3152
EUR/USD moved lower on Thursday after the surprisingly strong revision of the US GDP for Q2. The rate declined after finding resistance near the 1.3215 (R1) barrier, but failed to overcome the recent low of 1.3152 (S1) and remained within the range between those two barriers. As a result I would maintain my neutral view at the moment until the pair exits that range. A slowdown in Eurozone’s preliminary CPI for August is likely to give a reason for a push below 1.3152(S1). Nevertheless, I believe that such a move could be limited near the key support of 1.3100 (S2), near the lower boundary of the blue downside channel connecting the highs and the lows on the daily chart. On the other hand, a clear move above the barrier of 1.3240 (R2), could probably support the scenario that the upside corrective phase have started a bit earlier than I would expect.
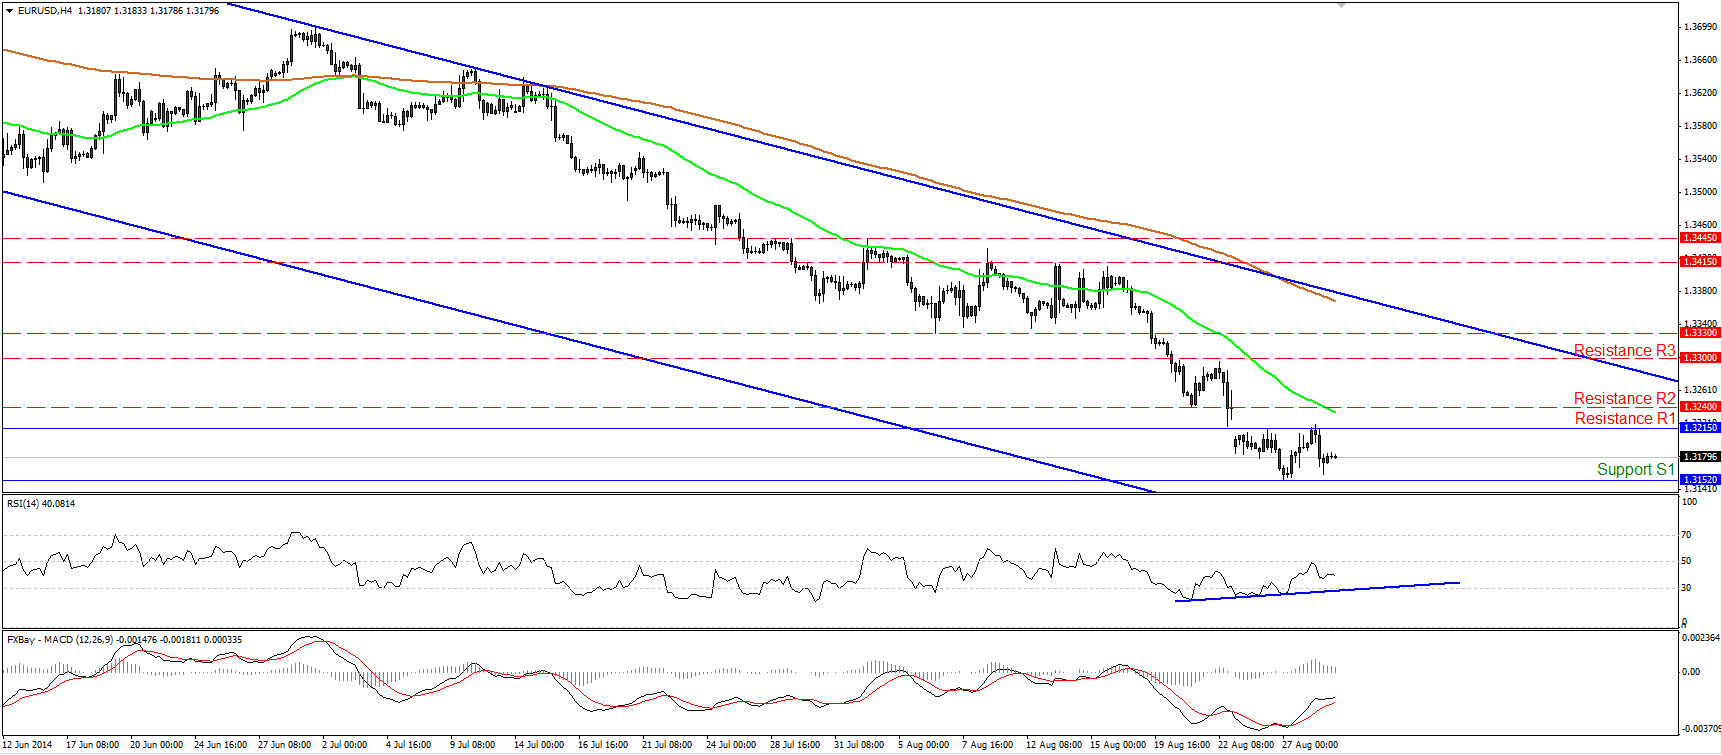
• Support: 1.3152 (S1), 1.3100 (S2), 1.3000 (S3)
• Resistance: 1.3215 (R1), 1.3240 (R2), 1.3300 (R3)
USD/JPY in a corrective mode
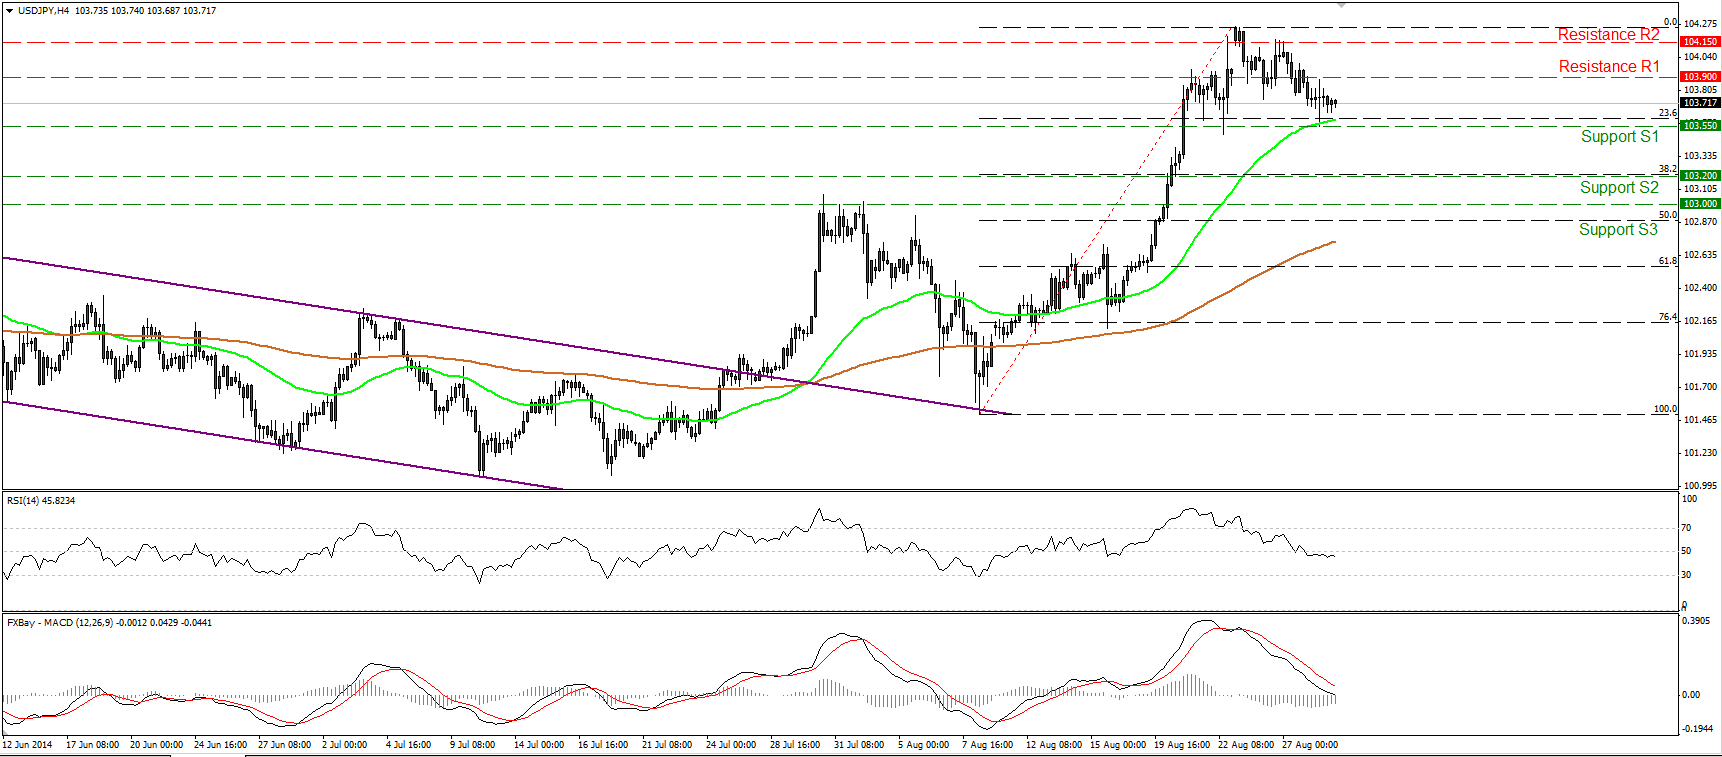
USD/JPY tumbled after Monday’s false break above the 104.15 (R2) line. Today, during the early European morning, the rate is trading slightly above the 23.6% retracement level of the 8th – 25th August upside wave, near our support line of 103.55 (S1). A decisive move below that area is likely to target the next support line at 103.20 (S2), which coincides with the 38.2% retracement level of the aforementioned advance. The RSI lies below its 50 line, while the MACD is now testing its zero line and could become negative any time soon. In the bigger picture, I still see a newborn long-term uptrend, since the price structure remains higher highs and higher lows above both the 50- and the 200-day moving averages. As a result, I would consider any possible near-term declines as a retracement before the bulls take the reins again.
• Support: 103.55 (S1), 103.20 (S2), 103.00 (S3)
• Resistance: 103.90 (R1), 104.15 (R2), 104.85 (R3)
EUR/GBP back negative
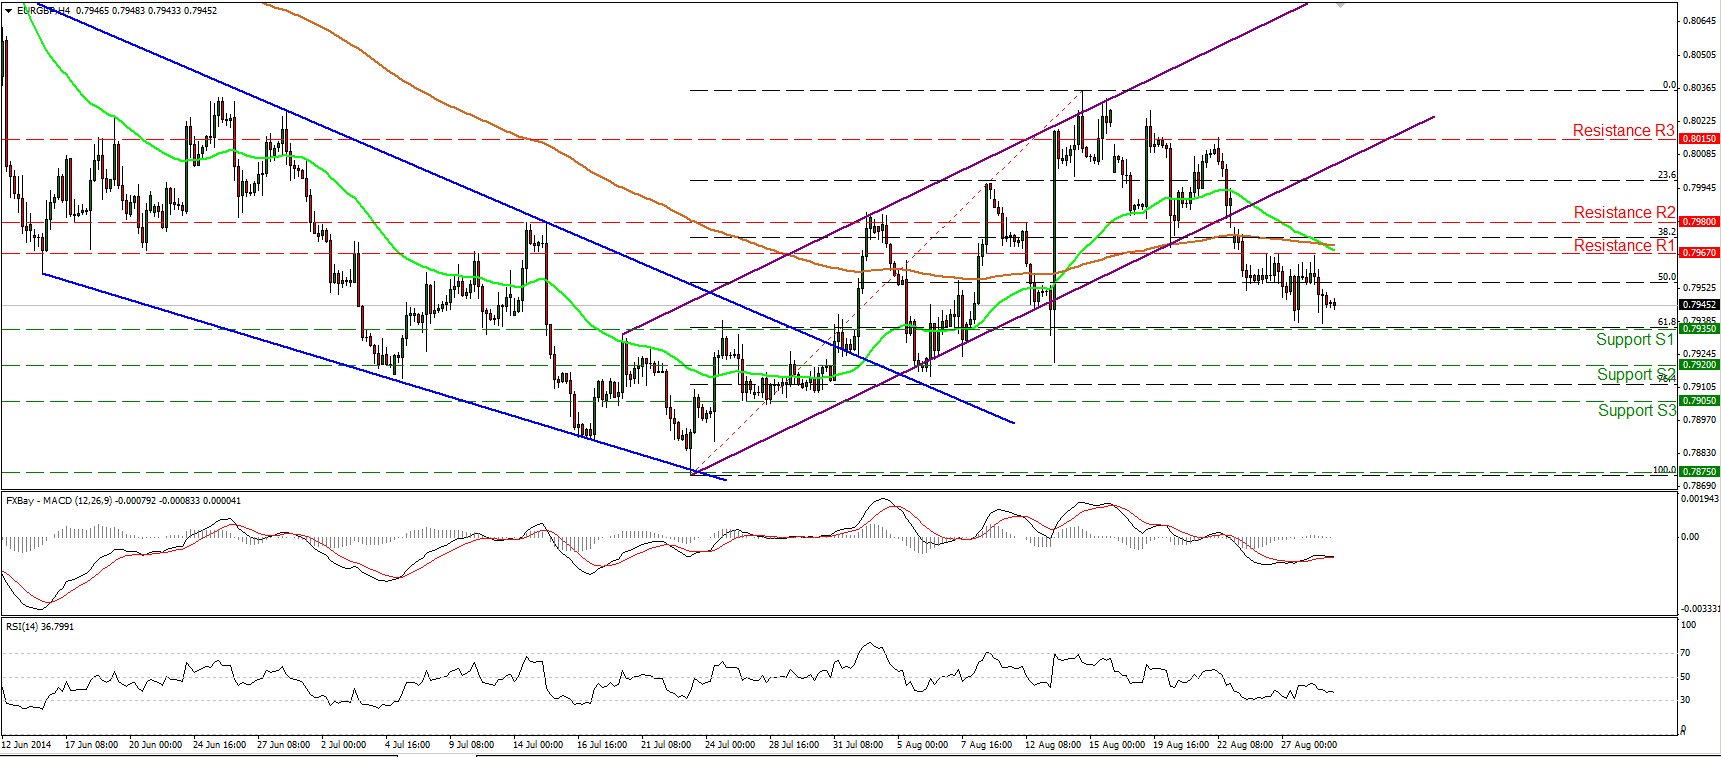
EUR/GBP fell below the lower bound on the upside channel on Monday, turning the near term picture back to the downside. Today, the pair is trading slightly above our support of 0.7935 (S1), which happens to be the 61.8% retracement level of the 23rd July- 14th August short-term uptrend. I would expect a dip below that line to target our next support at 0.7920 (S2). As long as the rate is printing lower highs and lower lows below the lower bound of the prior upside channel, I consider the short-term bias to be to the downside. On the daily chart, the major downtrend is still intact, as defined by the downtrend line drawn from back the high of the 1st of August 2013. Nevertheless, I would wait for a clear dip below the low of the 23rd of July at 0.7875 before regaining confidence on that long-term downside path.
• Support: 0.7935 (S1), 0.7920 (S2), 0.7905 (S3)
• Resistance: 0.7967 (R1), 0.7980 (R2), 0.8015 (R3)
Gold continues higher

Gold moved higher to reach the 200-period moving average and the line of 1297 (R1) before pulling back somewhat. The RSI continues to follow its blue upside support line, while the MACD entered its positive field, amplifying the case that another move near the 1297 (R1) barrier is possible. An upside violation of that barrier could aim for the 1305 (R2) obstacle near the upper boundary of the purple downside channel, connecting the highs and the lows on the daily chart. Both the 14-day RSI and the daily MACD remain below their downside resistance lines. As long as this is the case and as long as the yellow metal is trading within the purple downside channel, I would see any possible upside waves as a corrective move, at least for now.
• Support: 1280 (S1), 1273 (S2), 1260 (S3)
• Resistance: 1297 (R1), 1305 (R2), 1320 (R3)
WTI ready to challenge the 95.00 line
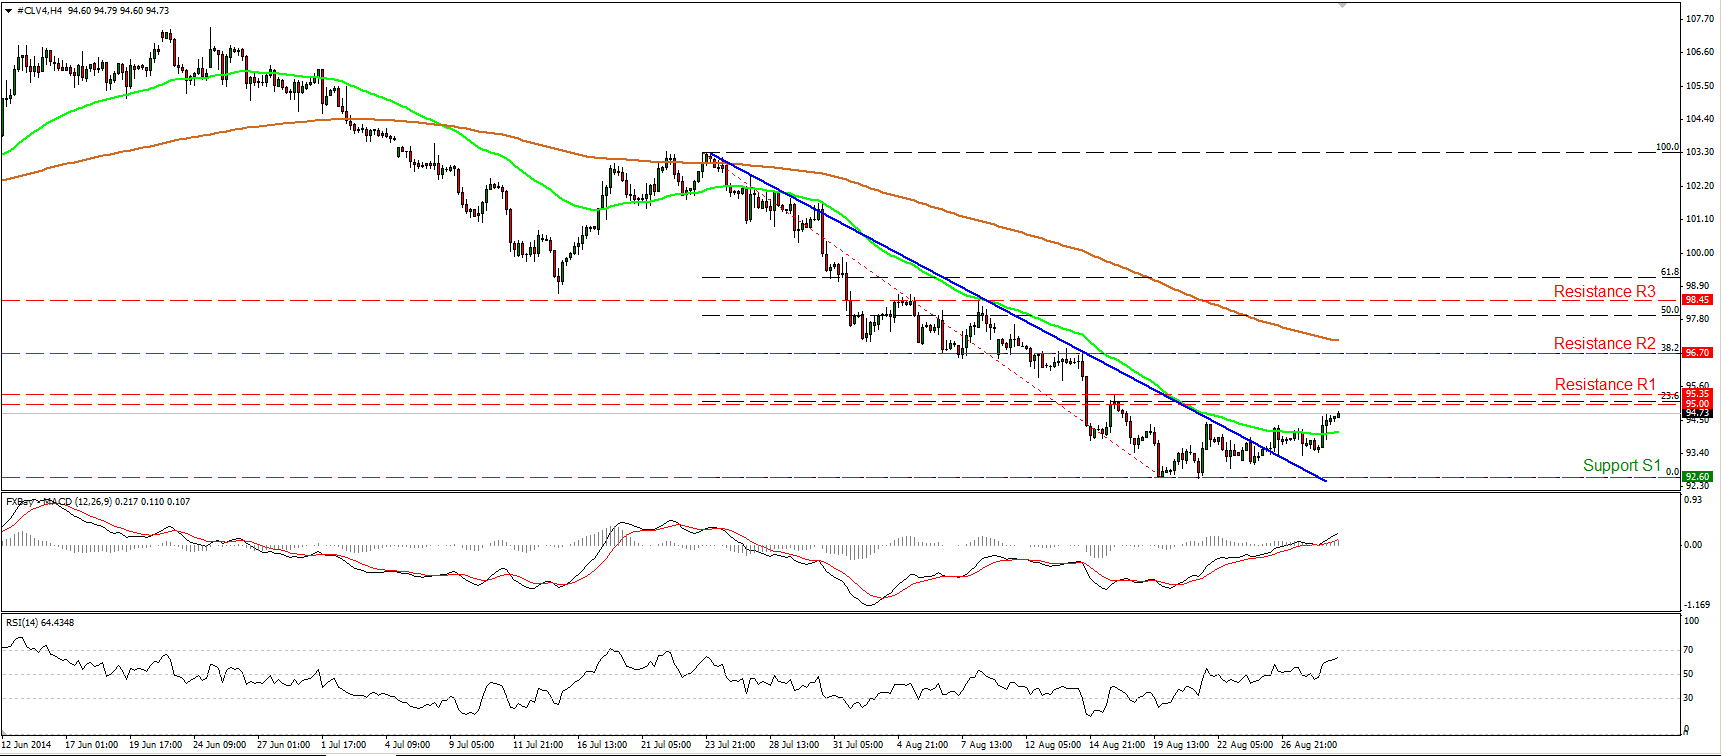
WTI moved higher on Thursday, and now it seems ready to challenge the psychological barrier of 95.00 (R1), which lies near the 23.6% retracement level of the 23rd July – 19th August downtrend. I will maintain my view that we need a clear move above the 95.00/35 zone to trigger further upside, perhaps towards the next resistance, at 96.70 (R2), which coincides with the 38.2% retracement level of the prior downtrend. The RSI lies above its 50 line and is now pointing up, while the MACD entered its positive field, confirming the recent bullish momentum. On the daily chart, the 14-day RSI continued moving higher after exiting oversold conditions, while the MACD remains above its signal line and is pointing up. All the above corroborate my view that the upside wave is likely to continue.
• Support: 92.60 (S1), 91.60 (S2), 90.00 (S3)
• Resistance: 95.00 (R1), 96.70 (R2), 98.45 (R3)
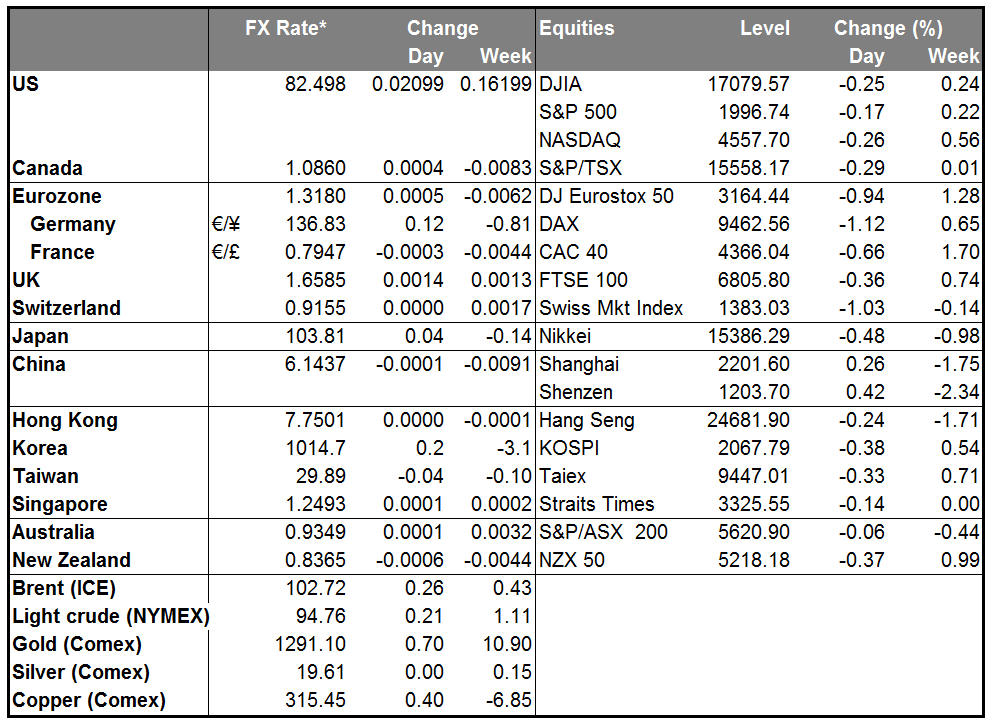
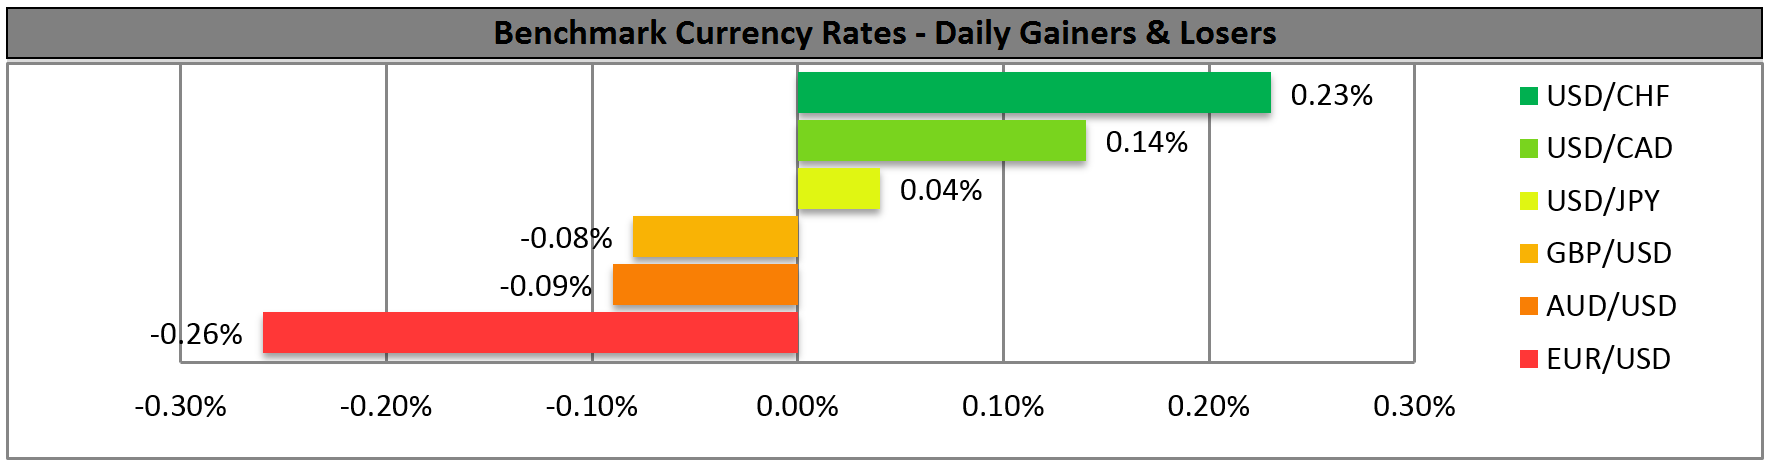
BENCHMARK CURRENCY RATES - DAILY GAINERS AND LOSERS
MARKETS SUMMARY