EUR/USD rebounds somewhat
EUR/USD moved slightly higher on Monday, but the near-term bias remains cautiously negative. I still expect the rate to reach the 1.3400 (S2) hurdle, where a decisive dip could target the bar of 1.3350. The price structure remains lower highs and lower lows below both the moving averages and this keeps the short-term trend to the downside. Nevertheless, I can see positive divergence between the rate and both our momentum indicators, indicating that the trend has lost some downside momentum. As a result, we may experience the continuation of the bounce before sellers take control again. On the daily chart, the 50-day moving average lies below the 200-day one, adding to the negative picture of the currency pair.
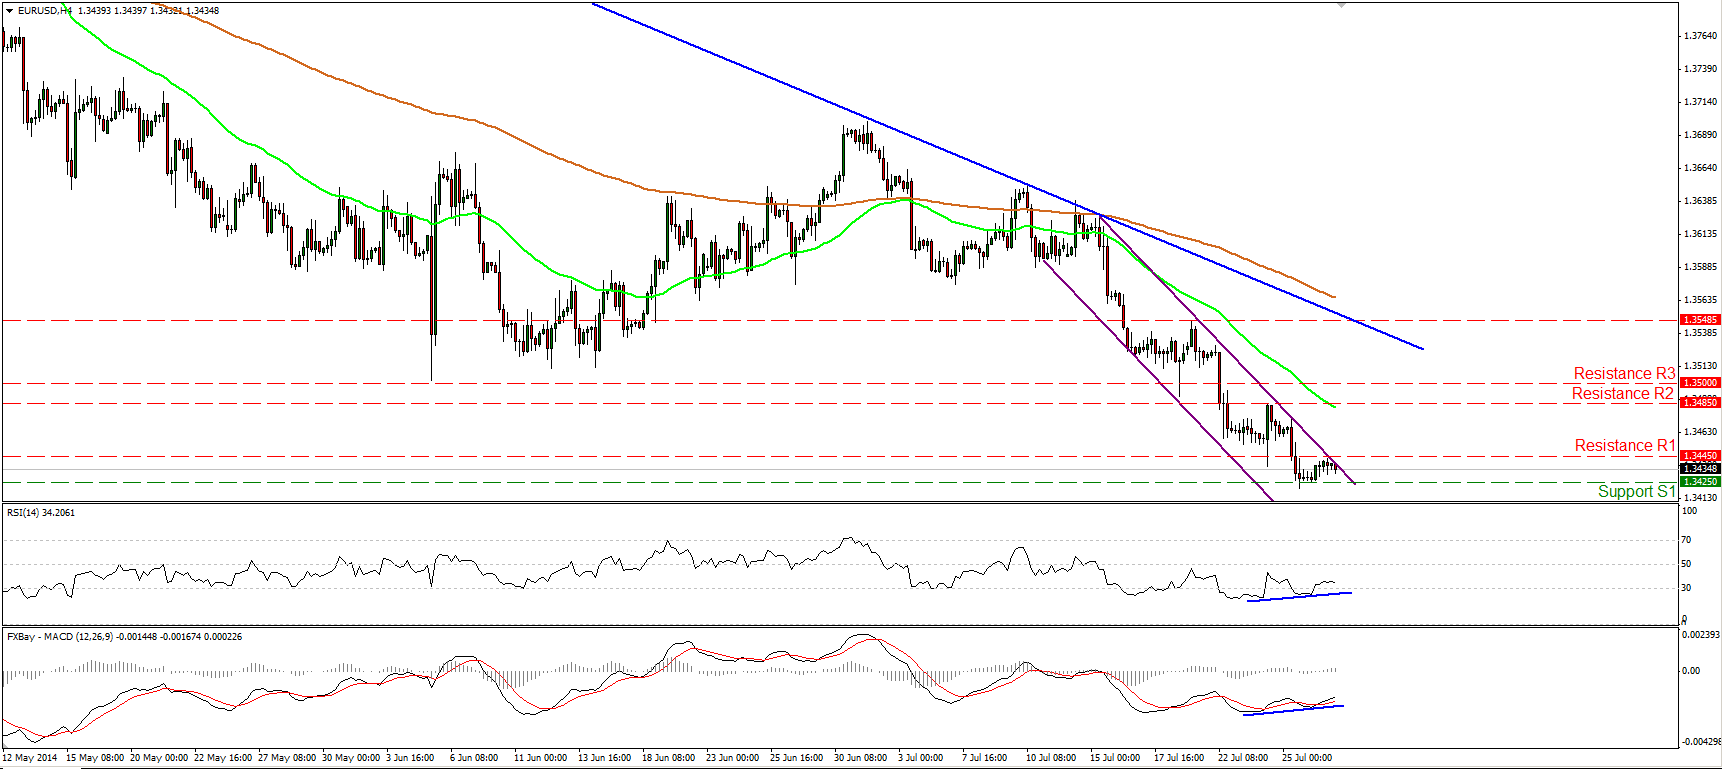
• Support: 1.3425 (S1), 1.3400 (S2), 1.3350 (S3)
• Resistance: 1.3445 (R1), 1.3485 (R2), 1.3500 (R3)
Is EUR/JPY set for further upside?
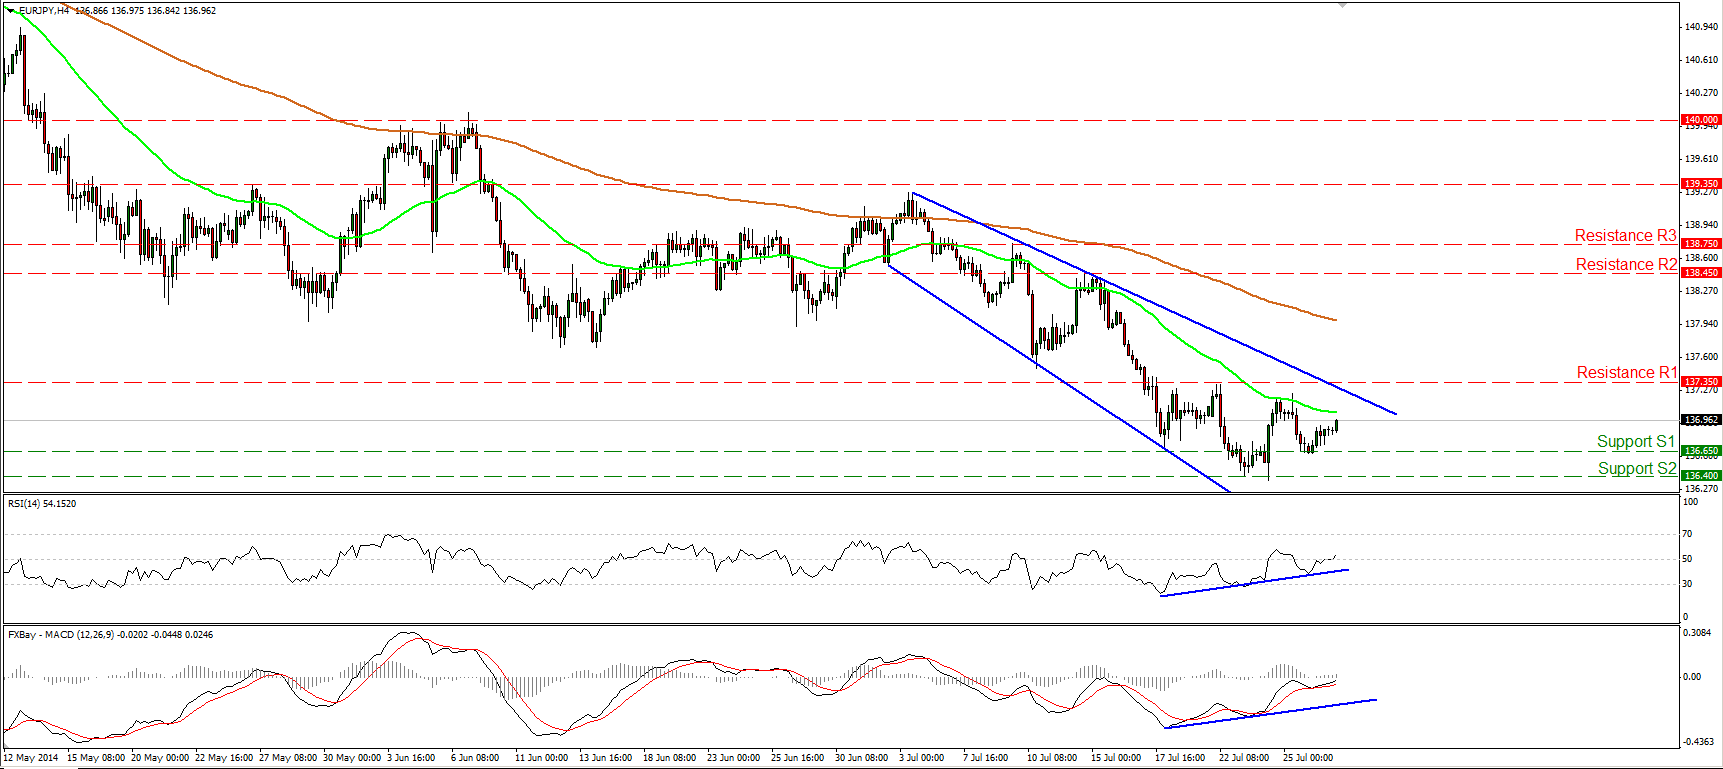
EUR/JPY rebounded from 136.65 (S1), forming a higher low and confirming the positive divergence between our momentum indicators and the price action. Although, the rate remains below the blue downtrend line, I would maintain my neutral stance for now, since the RSI moved above its 50 line, while the MACD, already above its signal line, seems ready to enter its positive field, favouring the continuation of the upside wave. Thus, I would expect the rate to target the resistance of 137.75 (R1), where a clear break would signal the completion of a possible near-term inverted head and shoulders formation and is likely to bring trend reversal. The completion of the pattern could probably pave the way towards the next resistance at 138.45 (R2). On the daily chart, I can identify a possible morning doji star formation, magnifying the case for further advances.
• Support: 136.65 (S1), 136.40 (S2), 136.20 (S3)
• Resistance: 137.35 (R1), 138.45 (R2), 138.75 (R3)
GBP/USD finds resistance at 1.7000
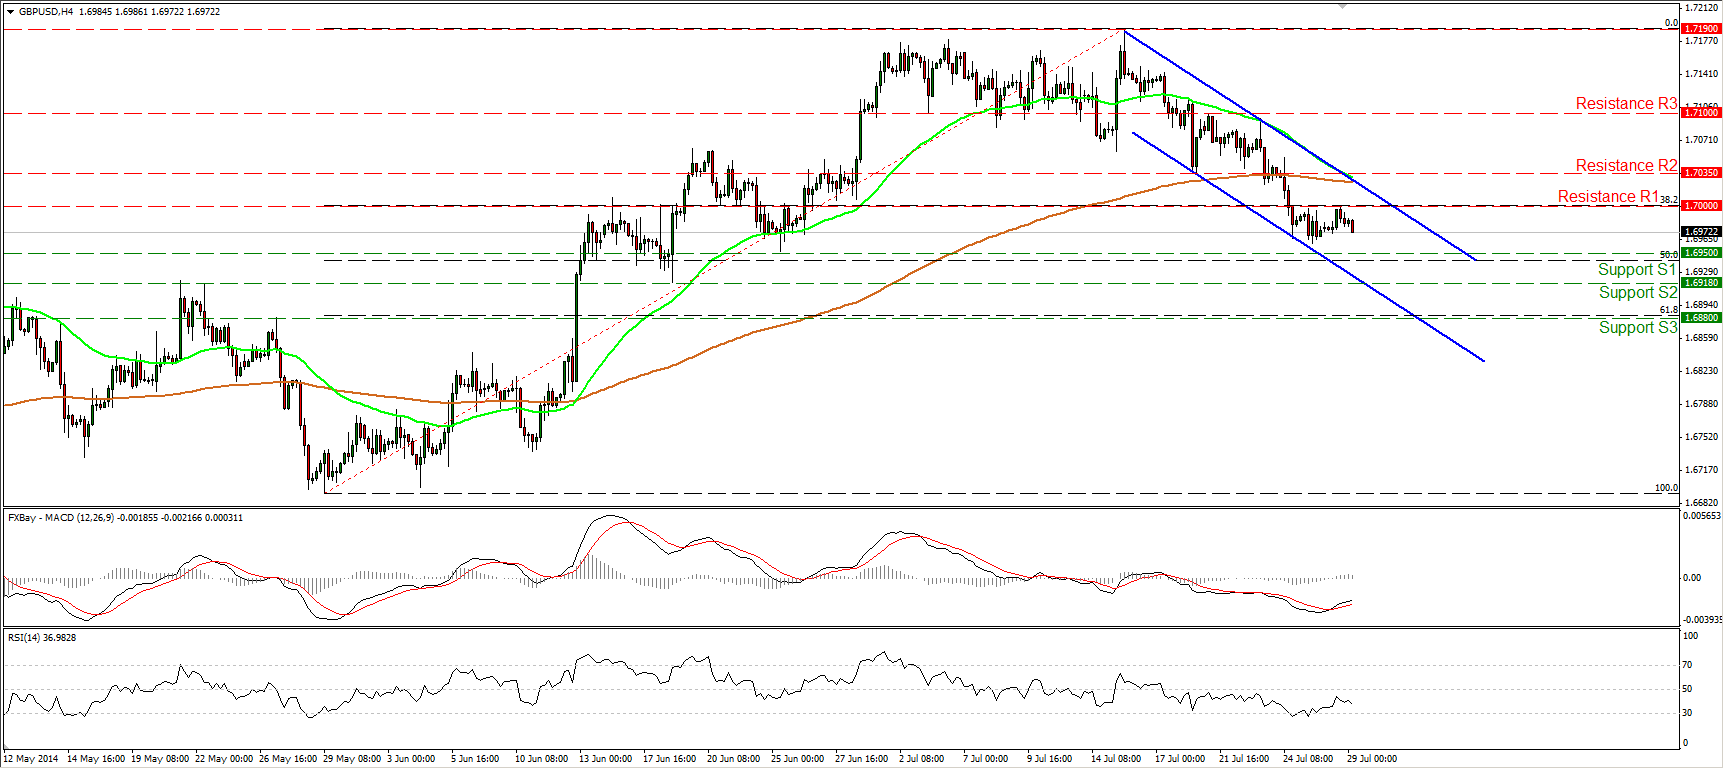
GBP/USD declined slightly, after finding resistance at the psychological barrier of 1.7000 (R1), which matches with the 38.2% retracement level of the 29th May – 15th of July advance. The short-term outlook remains negative in my view, and I would expect the rate to challenge the support level of 1.6950 (S1), also the 50% retracement level of the aforementioned up move. The next support is found at 1.6918 (S2), near the 80-day exponential moving average which supports the lows on the daily chart and keeps the long-term trend to the upside. If the rate approaches that critical zone, I would give up my bearish stance and wait to see the market reaction near that zone before reconsidering my analysis.
• Support: 1.6950 (S1), 1.6918 (S2), 1.6880 (S3)
• Resistance: 1.7000 (R1), 1.7035 (R2), 1.7100 (R3)
Gold remains below 1308
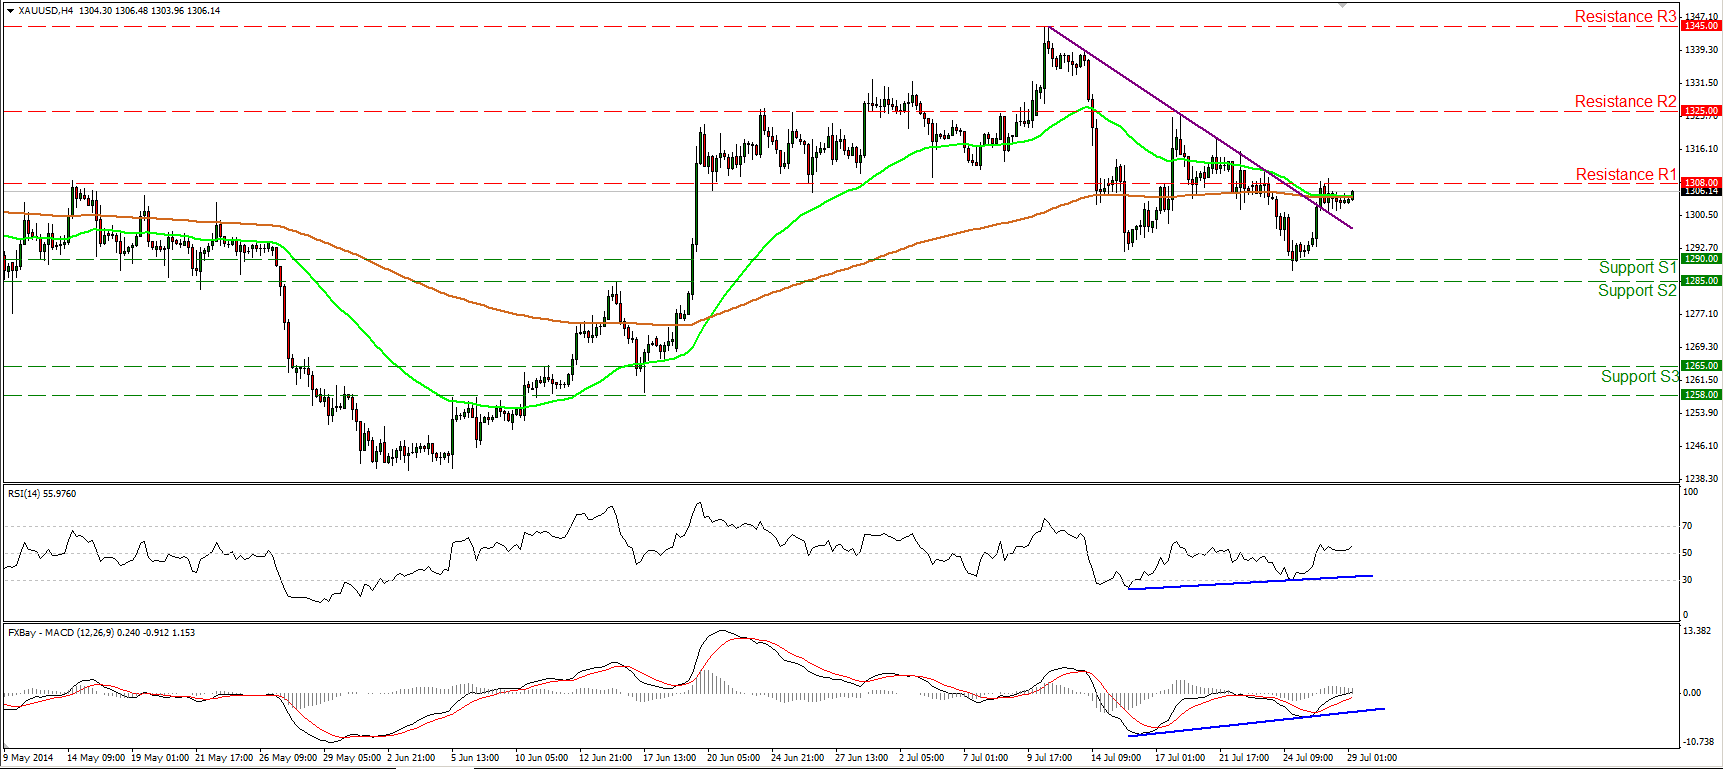
Gold moved in a consolidative mode, remaining marginally below the resistance bar of 1308 (R1). A clear move above that obstacle would likely confirm the break of the purple trend line and could probably pave the way towards the next resistance at 1325 (R2).The positive divergence between the precious metal and both our momentum studies remains in effect. Moreover, the RSI remains above 50 and is now pointing up, while the MACD edged above its zero line. This amplifies the case for further upside in the near-term horizon. Nevertheless, I would remain flat as far as the longer-term path is concerned, since on the daily chart, both the 50-day and the 200-day moving averages are pointing sideways.
• Support: 136.65 (S1), 136.40 (S2), 136.20 (S3)
• Resistance: 137.35 (R1), 138.45 (R2), 138.75 (R3)
WTI heading towards 101.00 again
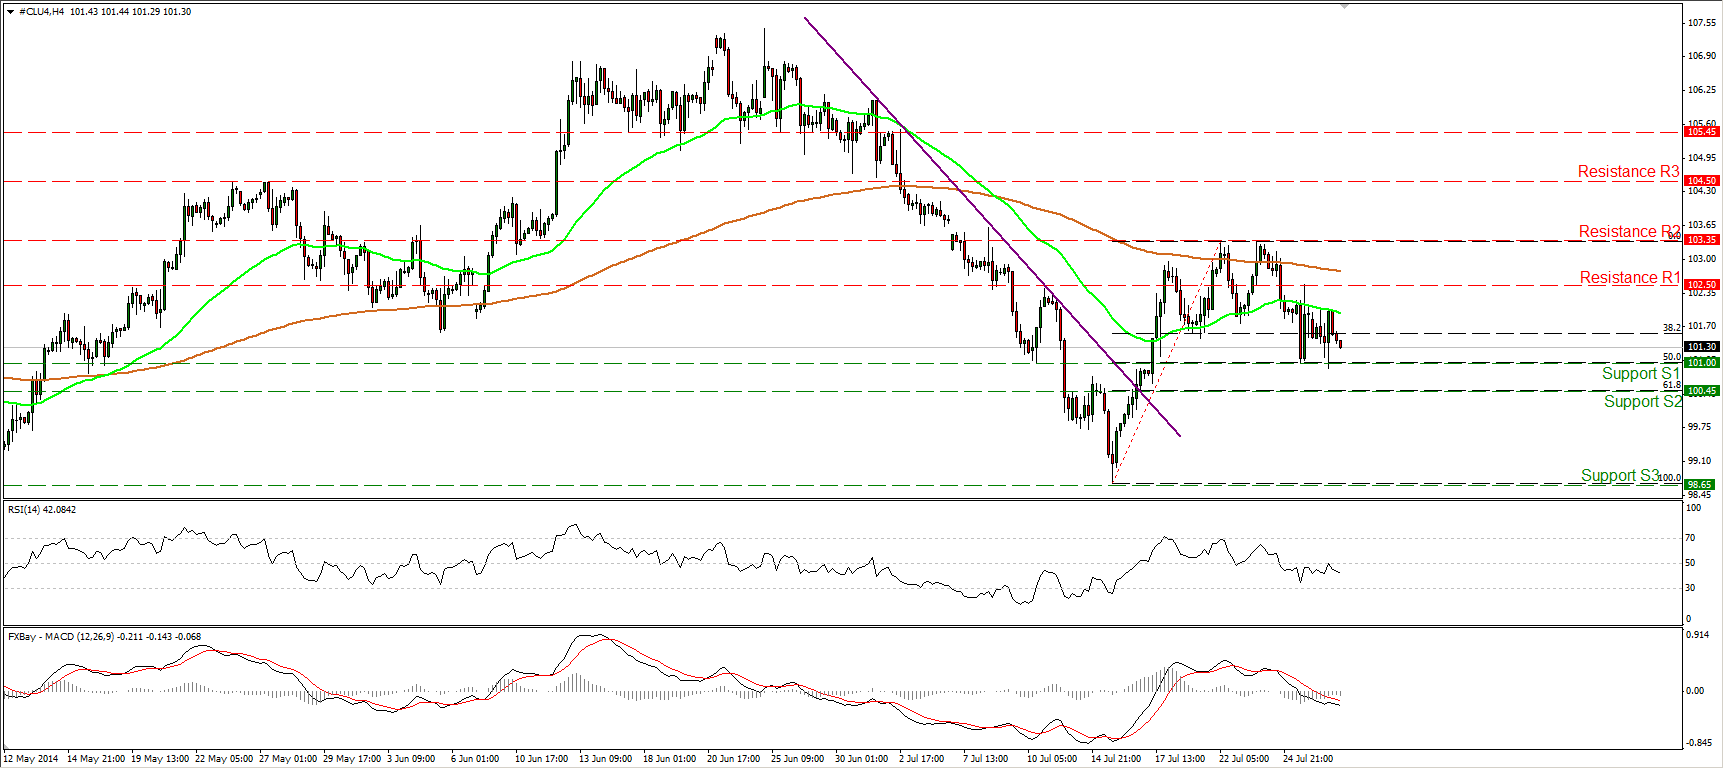
WTI moved lower yesterday and is now heading again towards the 101.00 (S1) support zone, which coincides with the 50% retracement level of the prior near-term advance and the 200-day moving average. Bearing in mind that the RSI found resistance at 50 and moved lower, while the MACD remains negative and lies below its signal line, I still see a mildly negative picture. However, I would wait for a dip below 100.45 (S2), the 61.8% retracement level of the aforementioned up move, before getting really bearish on oil. Such a move is likely to target the area of 98.65 (S3), the low of the 15th of July.
• Support: 101.00 (S1), 100.45 (S2), 98.65 (S3)
• Resistance: 102.50 (R1), 103.35 (R2), 104.50 (R3)
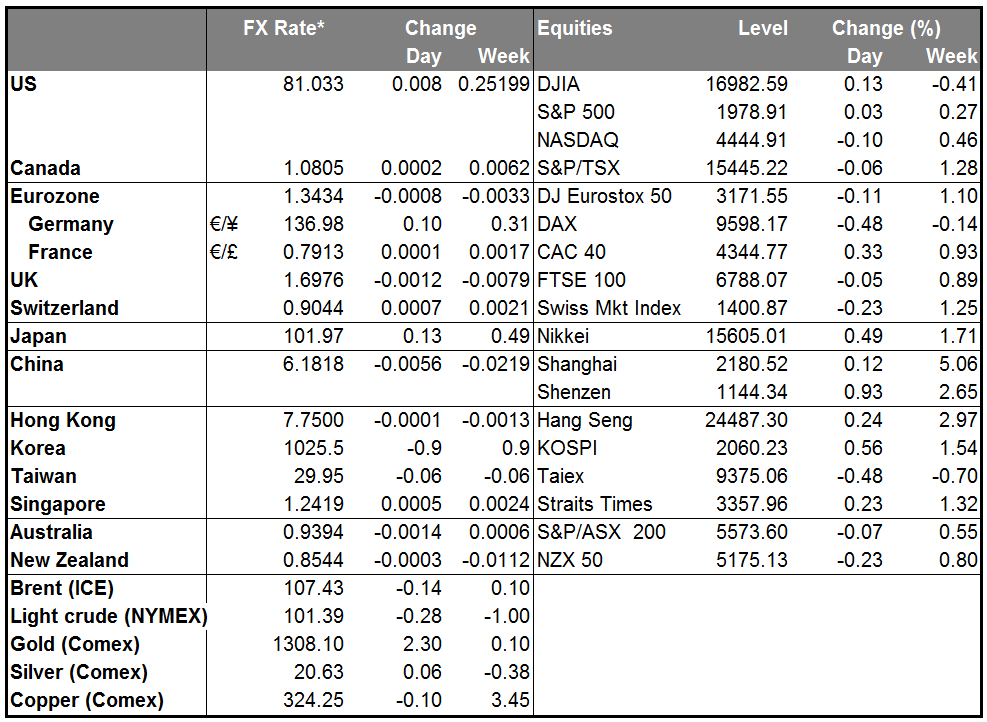
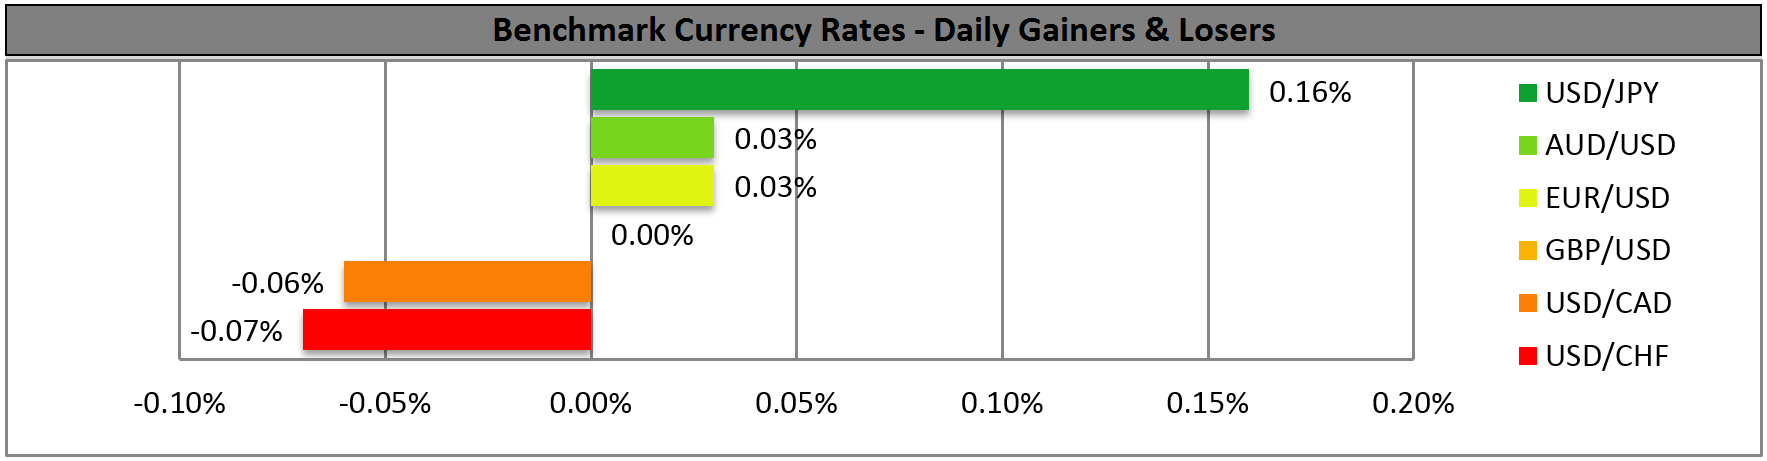
BENCHMARK CURRENCY RATES - DAILY GAINERS AND LOSERS
MARKETS SUMMARY