EUR/USD below 1.3435
EUR/USD declined on Friday, breaking below the support (turned into resistance) of 1.3435. I still expect the rate to reach the 1.3400 (S1) hurdle, where a decisive dip could target the bar of 1.3350 (S2). The price structure remains lower highs and lower lows below both the moving averages and this keeps the short-term path to the downside. Nevertheless, zooming on the 1-hour chart, the hourly MACD, although in its negative field, crossed above its signal line, while the RSI found support at its 30 level and moved somewhat higher. As a result, there could be some consolidation of a minor bounce before sellers take the reins again. On the daily chart, the 50-day moving average lies below the 200-day one, adding to the negative picture of the currency pair.
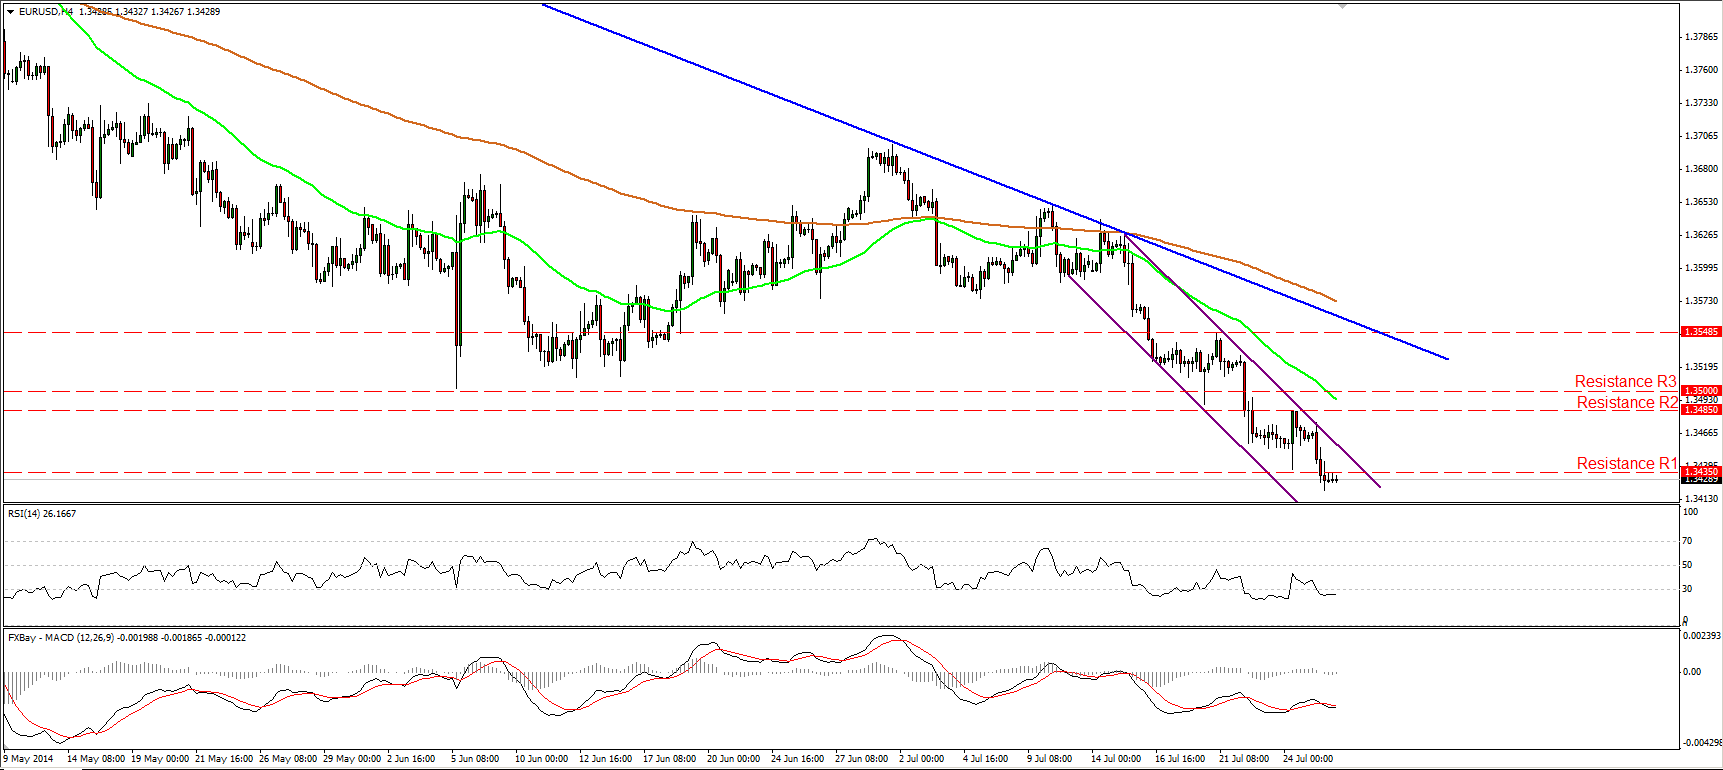
• Support: 1.3400 (S1), 1.3350 (S2), 1.3300 (S3).
• Resistance: 1.3435 (R1), 1.3485 (R2), 1.3500 (R3).
USD/JPY rallies and hits 101.95

USD/JPY climbed to find resistance at 101.95 (R1), a bit above the upper boundary of the purple downside channel. I would change my view to neutral for today, since a move above 101.95 (R1) is needed to confirm the exit of the channel and perhaps target the next obstacle at 102.25 (R2). On the other hand, a move below 101.60 (S1) will confirm that the recent advance was just a corrective wave and would reinforce the downside path. Our technical studies provide mixed signals, corroborating my flat view. The RSI found resistance at 70 and moved lower, while the MACD shows signs of topping and seems ready to dip below its signal line. However, the 50-period moving average is pointing up and is getting closer to the 200-period one.
• Support: 101.60 (S1), 101.35 (S2), 101.10 (S3).
• Resistance: 101.95 (R1), 102.25 (R2), 102.65 (R3).
EUR/GBP finds resistance near 0.7935
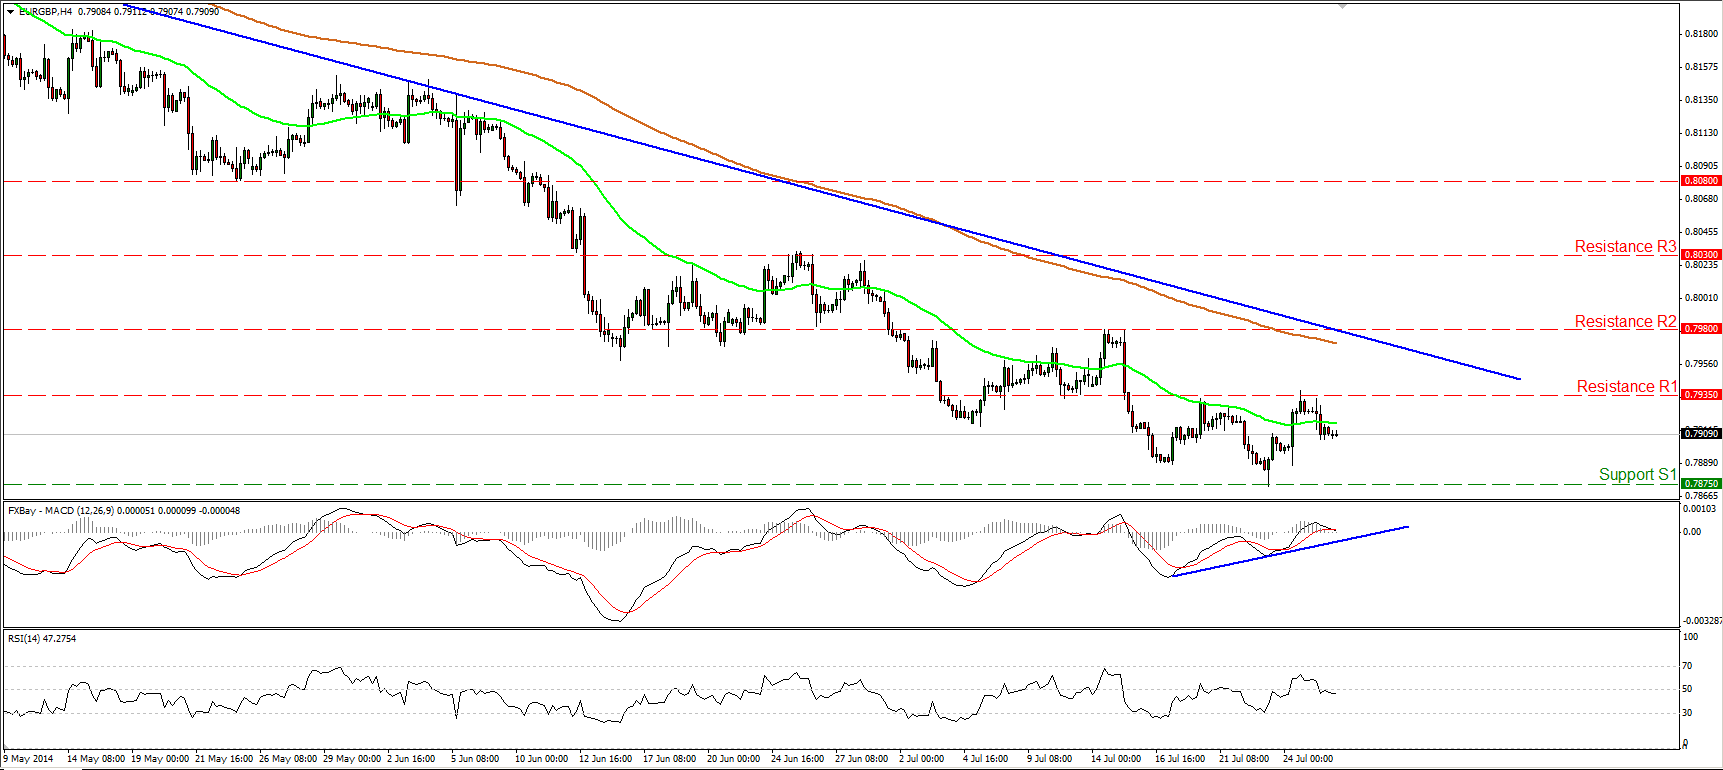
EUR/GBP moved higher and reached the 0.7935 (R1) zone as expected before declining to trade virtually unchanged. Although the overall trend remains to the downside (marked by the downtrend line drawn from back the 11th of April), the positive divergence between the MACD and the price action remains in effect, indicating the lack of the necessary bearish momentum, at least for now. I can also see positive divergence on the daily chart, between the price action and both the daily MACD and the 14-day RSI, corroborating my view that the downtrend is not the best to rely on. I would regain my confidence on the downtrend upon a dip below 0.7875 (S1). Such a dip would confirm a forthcoming lower low and could trigger extensions towards 0.7815 (S2).
• Support: 0.7875 (S1), 0.7815 (S2), 0.7755 (S3).
• Resistance: 0.7935 (R1), 0.7980 (R2), 0.8030 (R3).
Gold reaches and breaks 1293
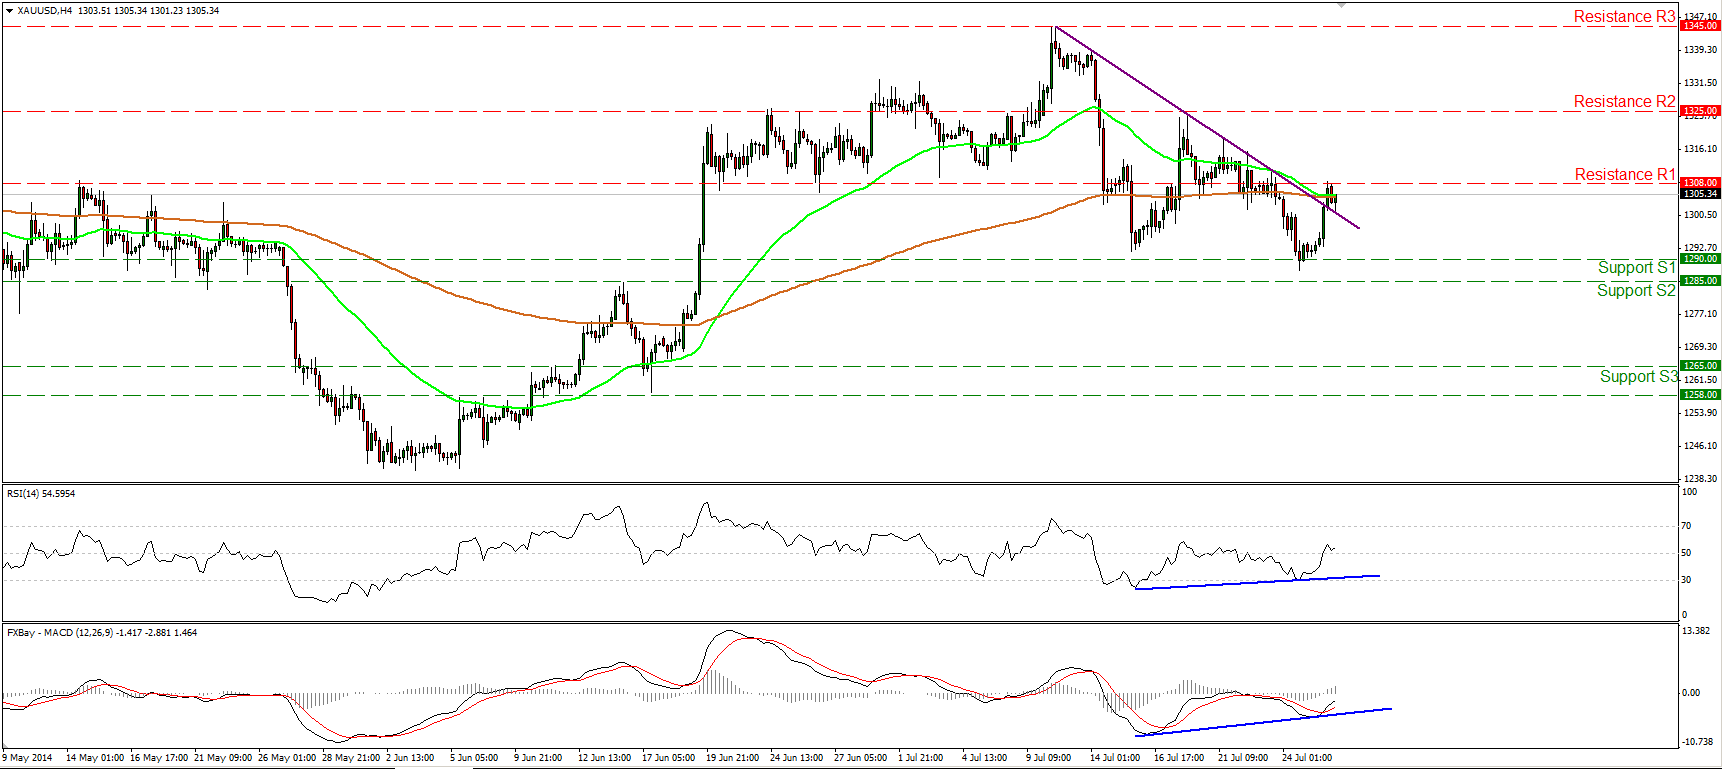
Gold advanced significantly, violating the short-term purple downtrend line, but finding resistance at 1308 (R1). A clear move above that hurdle would likely confirm the exit from the trend line break and could probably pave the way towards the next resistance at 1325 (R2). Moreover, I can see positive divergence between the metal and both our momentum studies, magnifying the case for further advance in the near-term horizon. Nonetheless, I would maintain my neutral stance as far as the longer-term path is concerned, since on the daily chart, both the 50-day and the 200-day moving averages are pointing sideways.
• Support: 1290 (S1), 1285 (S2), 1265 (S3).
• Resistance: 1308 (R1), 1325 (R2), 1345 (R3).
WTI declines but rebounds from 101.00

WTI moved lower on Friday, but found support and rebounded from 101.00 (S1), which coincides with the 50% retracement level of the prior near-term advance and the 200-day moving average. However, the price hit 102.50 (R1) and at the time of writing is trading at 101.56. Having in mind that the RSI remains below 50, while the MACD obtained a negative sign, I would see a mildly negative picture. Nevertheless, I would wait for a dip below 100.45 (S2), the 61.8% retracement level of the aforementioned advance, which would signal a bearish extension that could target the zone of 98.65 (S3), the low of the 15th of July.
• Support: 101.00 (S1), 100.45 (S2), 98.65 (S3).
• Resistance: 102.50 (R1), 103.35 (R2), 104.50 (R3).
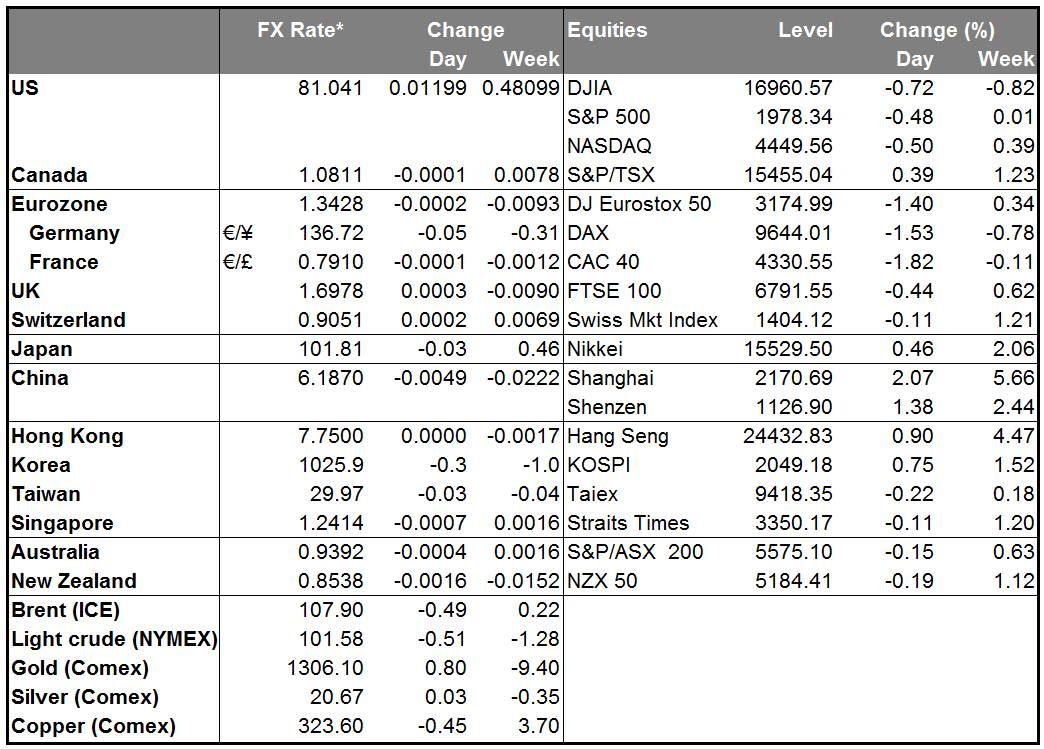
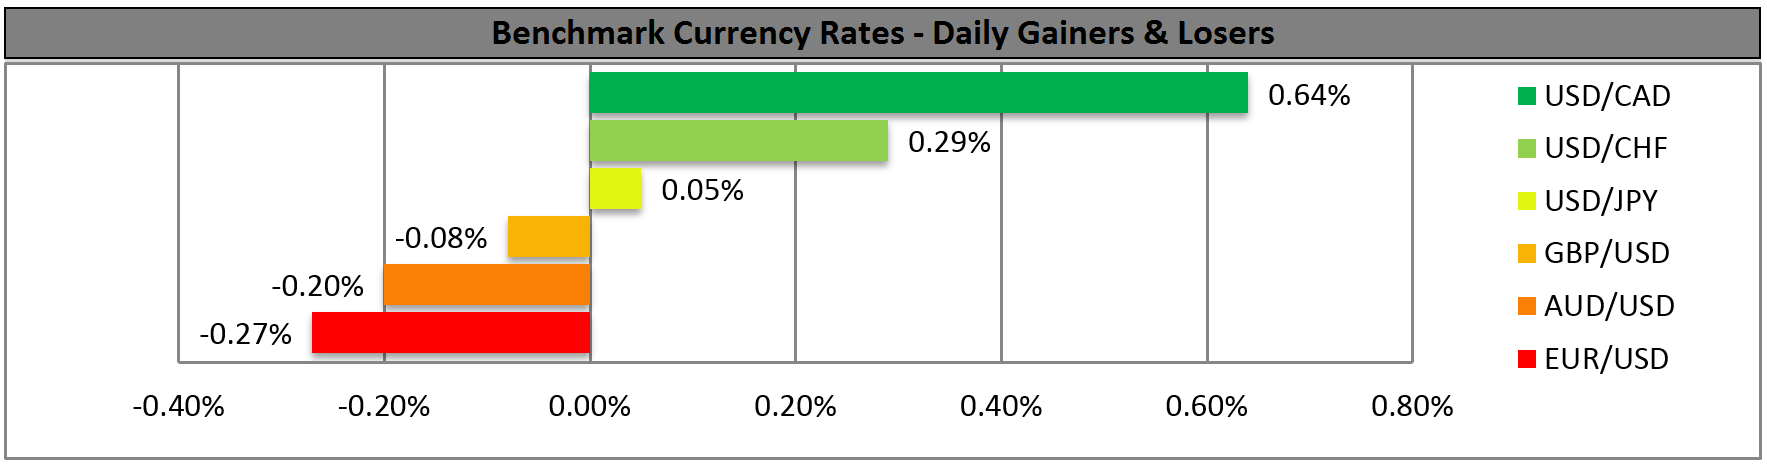
BENCHMARK CURRENCY RATES - DAILY GAINERS AND LOSERS
MARKETS SUMMARY