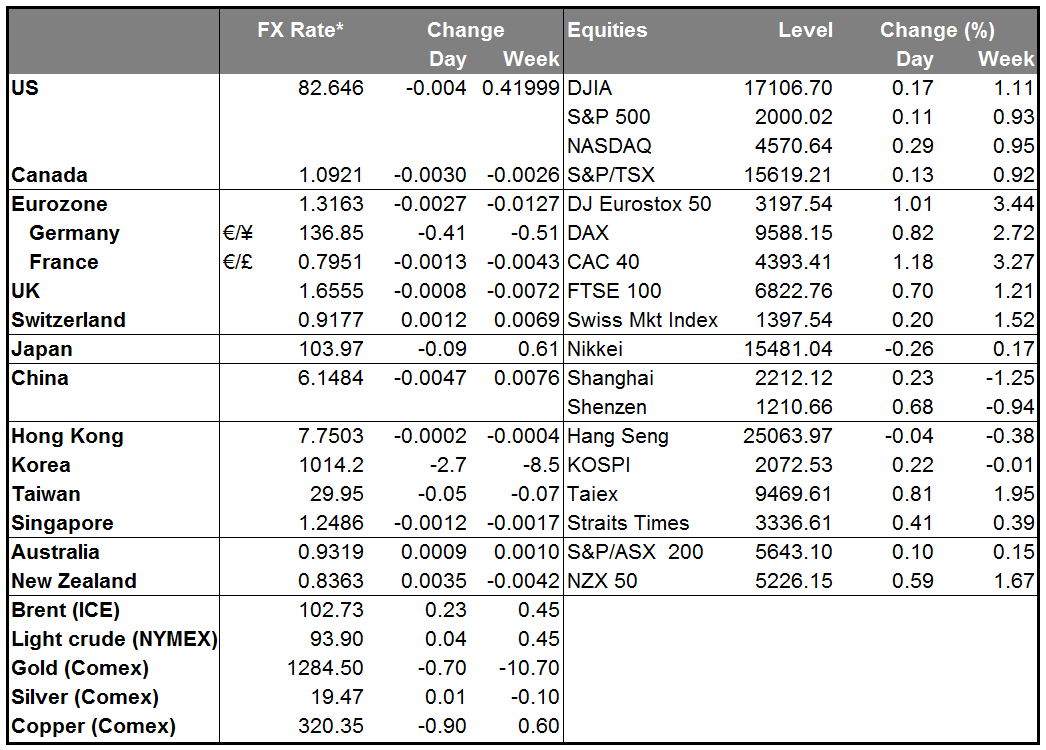
EUR/USD breaks below 1.3185
EUR/USD moved lower on Tuesday, breaking below the barrier of 1.3185 (support turned into resistance). As I said in previous comments, I would expect such a break to set the stage for extensions towards our next support area of 1.3100 (S1), defined by the low of the 6th of September 2013, also near the lower boundary of the blue channel connecting the lows and the highs on the daily chart. As long as the rate is still trading within that channel and below both the 50- and 200-day moving averages, I will keep seeing a negative overall picture. My only concern is that on the 4-hour chart, we still have positive divergence between the RSI and the price action, which suggests that the recent downside momentum is decelerating.
• Support: 1.3100 (S1), 1.3000 (S2), 1.2900 (S3)
• Resistance: 1.3185 (R1), 1.3240 (R2), 1.3300 (R3)
GBP/USD remains supported by 1.6535

GBP/USD remained within a minor-term range between the support line of 1.6535 (S1) and the resistance of 1.6600 (R1). However, the overall picture remains negative, as the rate is printing lower highs and lower lows below the blue downtrend line and below both the moving averages. I still expect the rate to challenge the psychological number of 1.6500 (S2). I would be cautious though for now, since I see positive divergence between the RSI and the price action. On the daily chart, Cable remains below the 80-day exponential moving average, which provided support to the lows of the price action during the prevailing uptrend, supporting the overall negative bearish outlook.
• Support: 1.6535 (S1), 1.6500 (S2), 1.6460 (S3)
• Resistance: 1.6600 (R1), 1.6655 (R2), 1.6700 (R3)
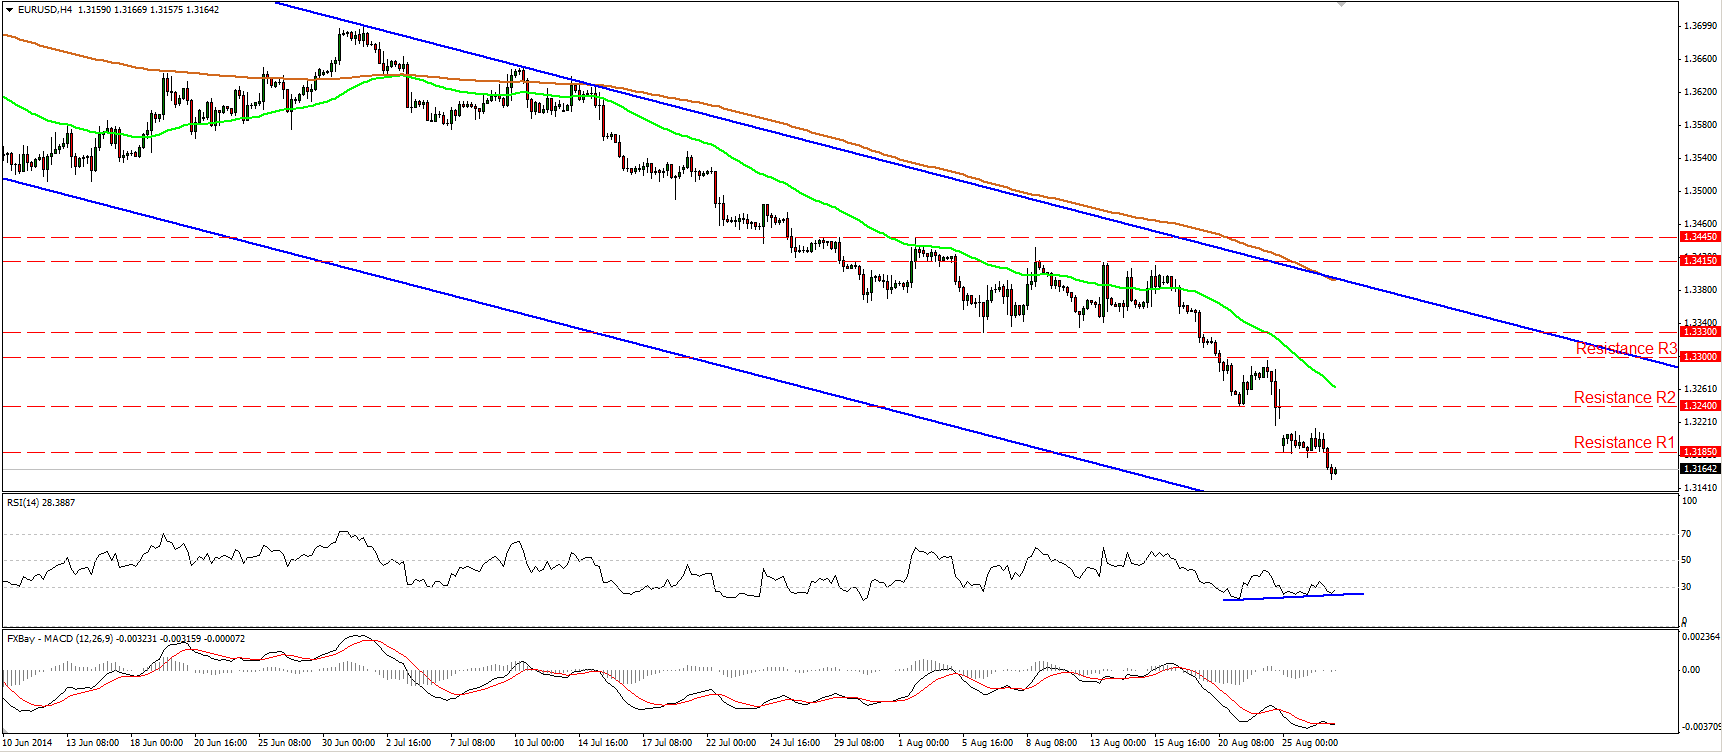
EUR/JPY tumbles after finding resistance at 138.00
EUR/JPY has been in a falling mode the last few days. The pair started declining after finding strong resistance at the 138.00 (R2) line and moved back within the purple downside channel. At the time of writing, the rate appears ready to challenge the support line of 136.75 (S1), where a dip could aim for the next barrier at 136.40 (S2). The RSI lies below 50 and is pointing down, while the MACD is negative and also below its trigger, adding to the negative picture of EUR/JPY and magnifying the case for further declines in the near-term horizon.
• Support: 136.75 (S1), 136.40 (S2), 135.70 (S3)
• Resistance: 137.30 (R1), 138.00 (R2), 138.45 (R3)
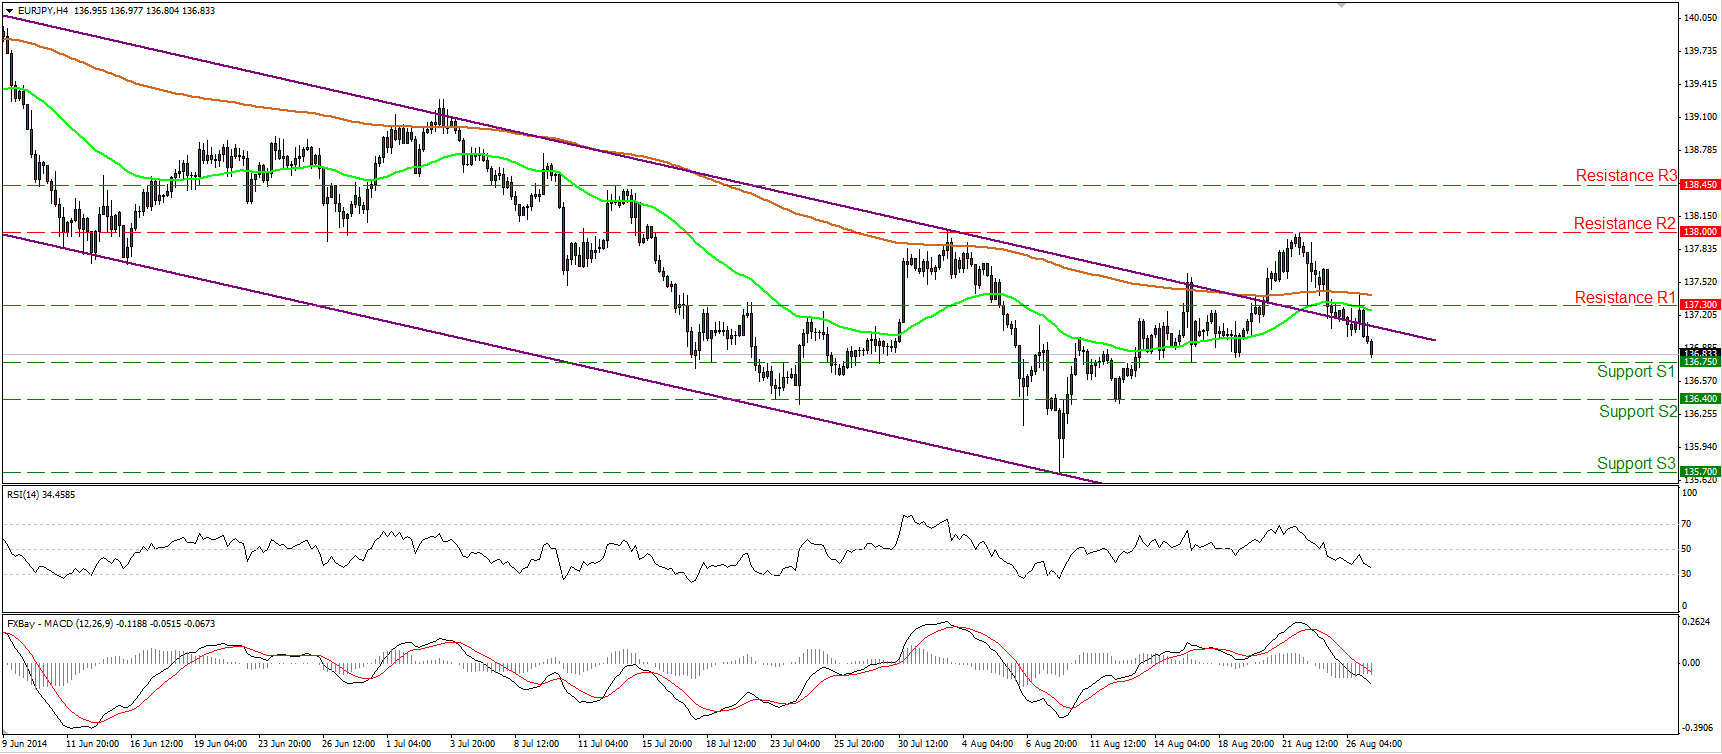
Gold moves higher but finds resistance at 1291
Gold moved higher yesterday, but the advance was halted by 1291 (R1), and then the metal declined to find support at 1280 (S1). The RSI moved higher after the rebound from its 30 line, while the MACD, already above its signal line, seems willing to turn positive in the near future. Having these momentum signs in mind and in light of the fact that the metal found support at the long-term trend line drawn from back at the low of the 31st of December, I would expect the upside wave to continue. A decisive move above the 1291 (R1) resistance could probably see scope for extensions towards the 1305 (R2) line, near the upper boundary of the purple downside channel.
• Support: 1280 (S1), 1273 (S2), 1260 (S3)
• Resistance: 1291 (R1), 1305 (R2), 1320 (R3)
WTI breaks the near-term downtrend line
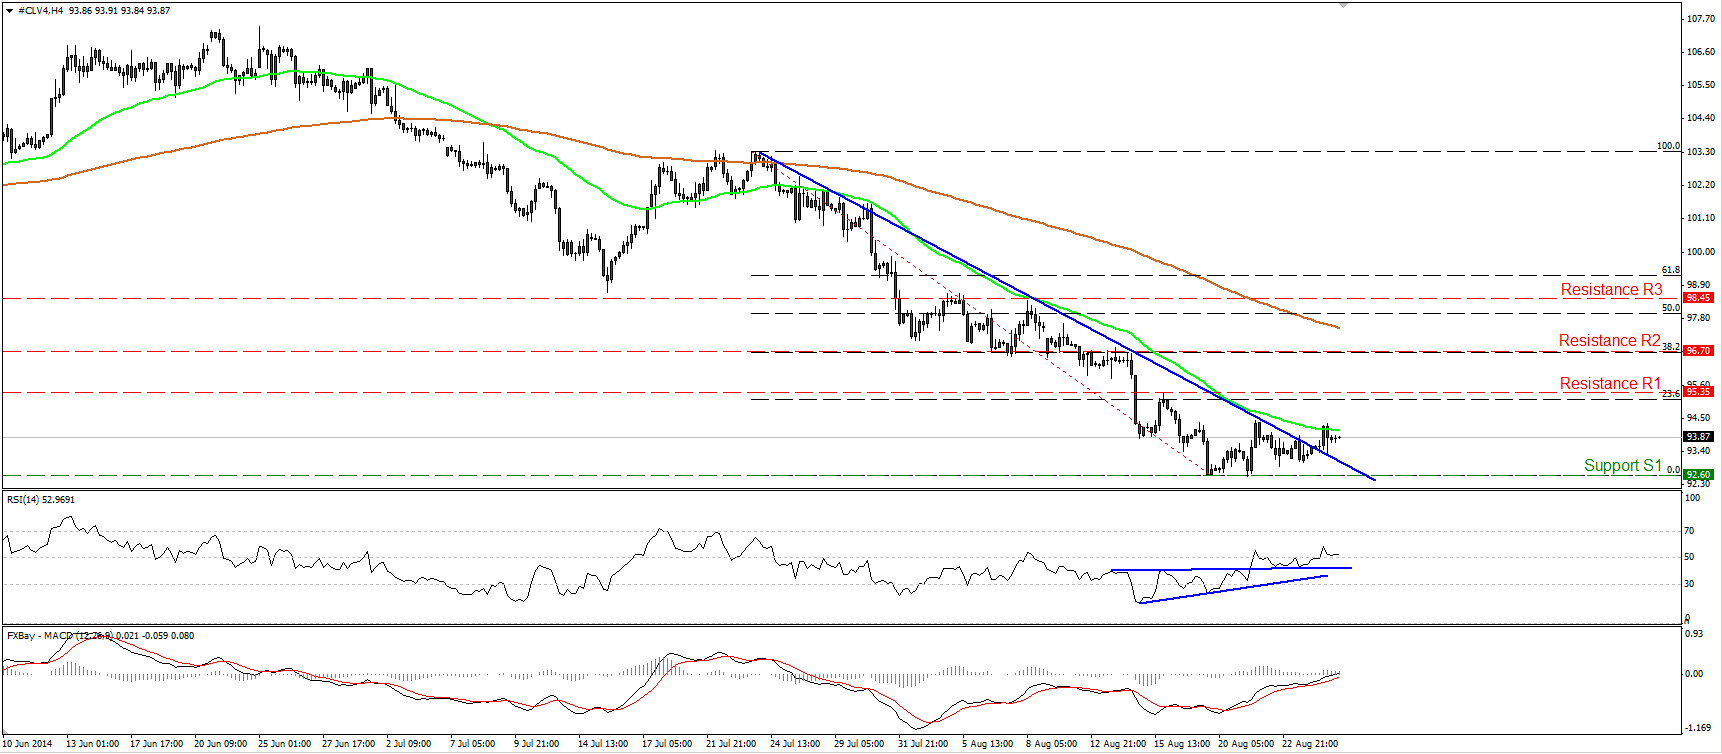
WTI moved higher yesterday, as expected, breaking above the near-term blue downtrend line. The RSI moved above its 50 line after the rebound from its prior resistance line (turned into support), while the MACD, already above its signal line, obtained a positive sign. Taking all these technical signs into consideration, I would expect WTI to continue higher and to challenge the resistance obstacle of 95.35 (R1), which lies near the 23.6% retracement level of the 23rd July – 19th August downtrend. A clear move above that is likely to confirm the upside bias and trigger extensions towards our next resistance line of 96.70, which is the 38.2% retracement level of the aforementioned downtrend. On the daily chart, the 14-day RSI moved higher after exiting its oversold field, while the MACD moved above its trigger line, supporting my view that we may see the price moving higher, at least for a test near the barrier of 95.35 (R1).
• Support: 92.60 (S1), 91.60 (S2), 90.00 (S3)
• Resistance: 95.35 (R1), 96.70 (R2), 98.45 (R3)
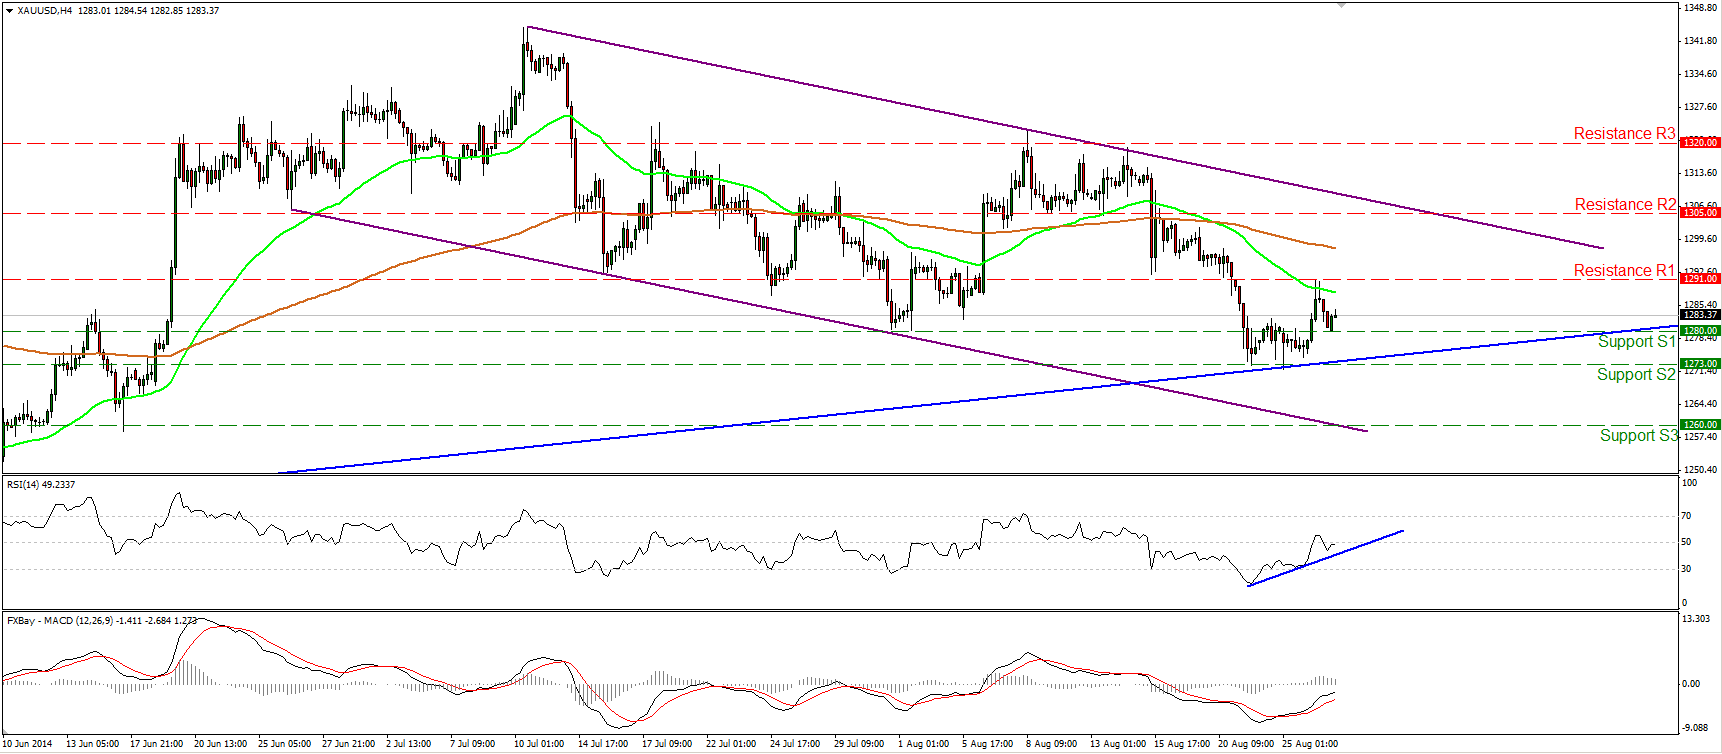
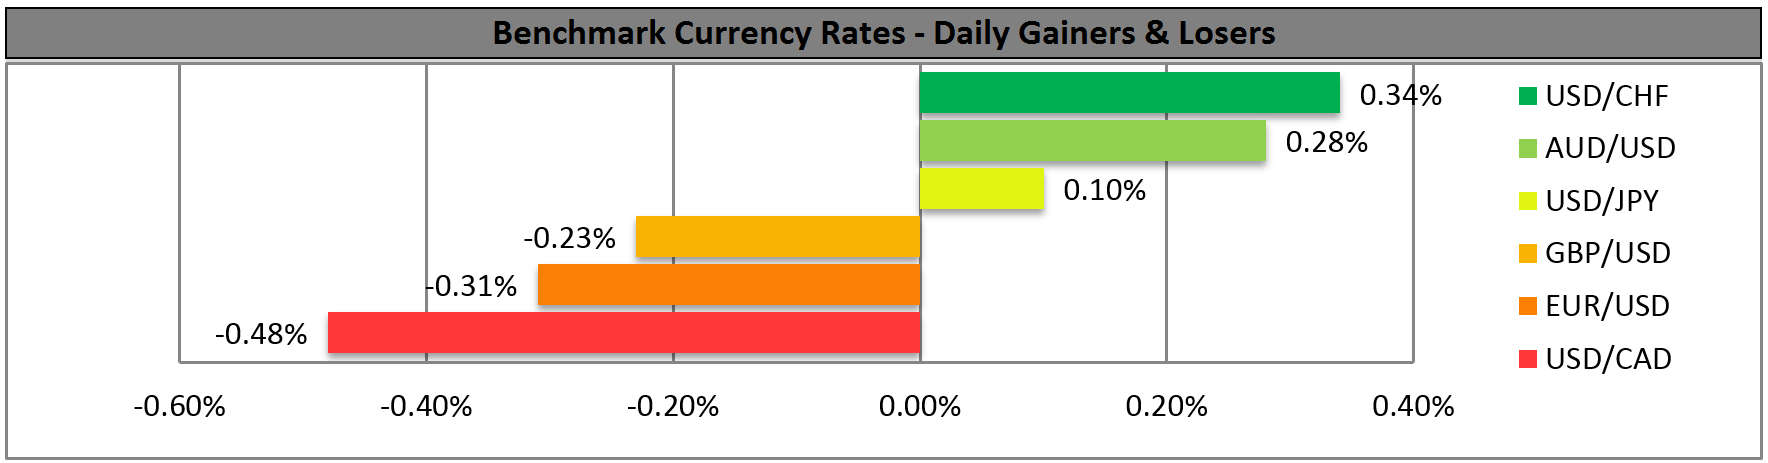
BENCHMARK CURRENCY RATES - DAILY GAINERS AND LOSERS
MARKETS SUMMARY