EUR/USD pulls back to test the uptrend line
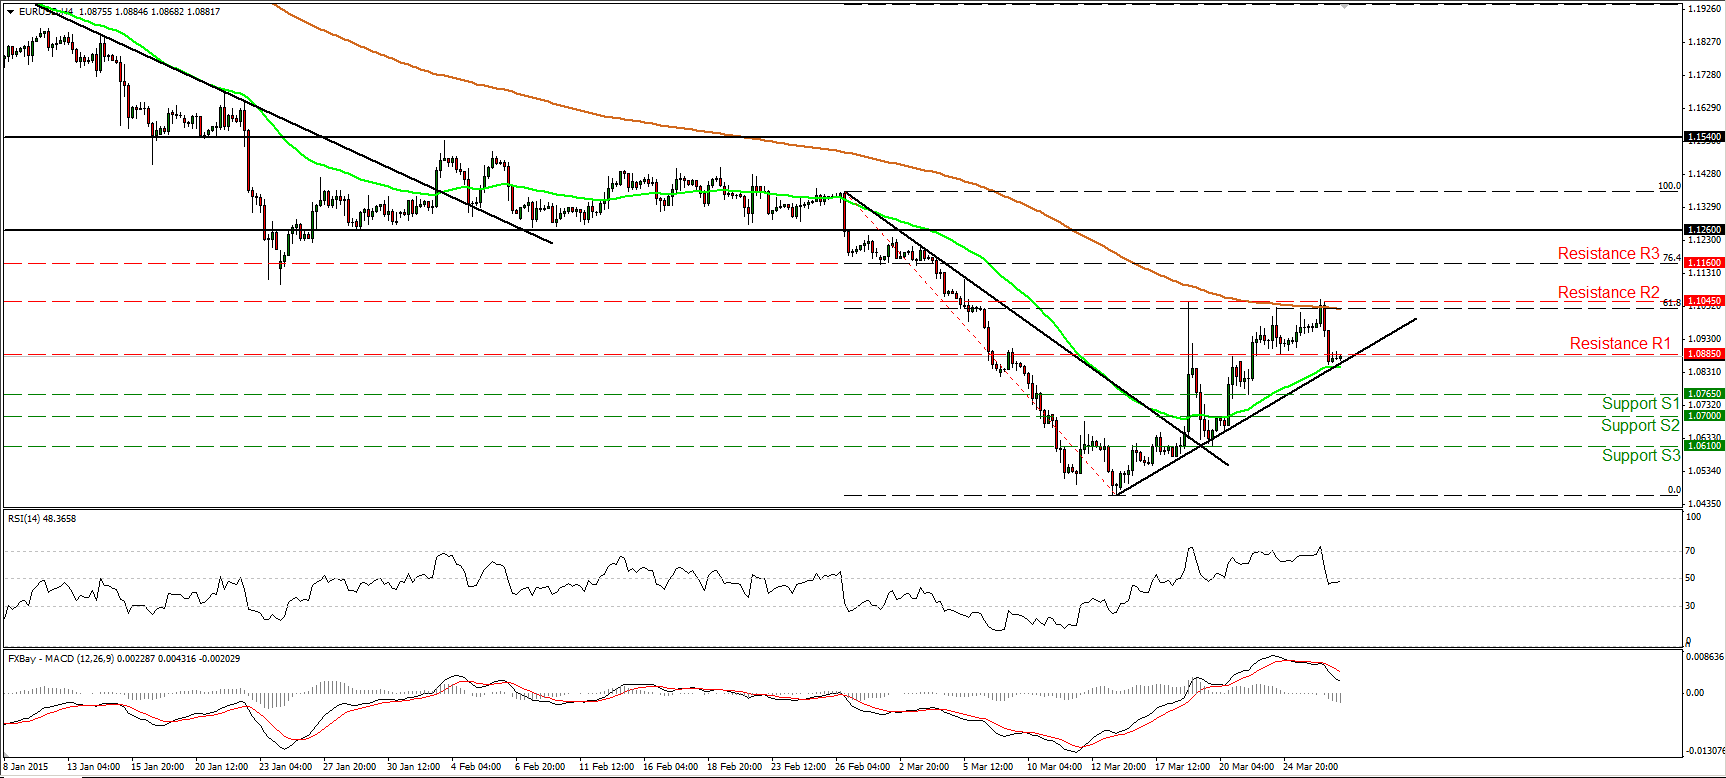
EUR/USD fell sharply after hitting once again resistance near the 1.1045 (R2) barrier and the 61.8% retracement level of the 26th of February – 16th of March decline, which happens to coincide with the 200-period moving average. The decline was halted by the 50-period moving average and the short-term uptrend line taken from the low of the 13th of March. The rate still stands above that line and above the downtrend line drawn from the peak of the 26th of February, therefore I still see a cautiously positive short-term picture. A move back above 1.0885 (R1), would confirm my view and perhaps pull the trigger for another test near the 1.1045 (R2) hurdle and the 61.8% retracement level.
As for the broader trend, the price structure still suggests a longer-term downtrend. EUR/USD is printing lower peaks and lower troughs below both the 50- and the 200-day moving averages. Therefore, I would treat the near-term uptrend or any possible extensions of it as corrective move of the larger down path.
• Support: 1.0765 (S1), 1.0700 (S2), 1.0610 (S3).
• Resistance: 1.0885 (R1), 1.1045 (R2), 1.1160 (R3).
GBP/JPY looks ready to go for the 176.00 barrier
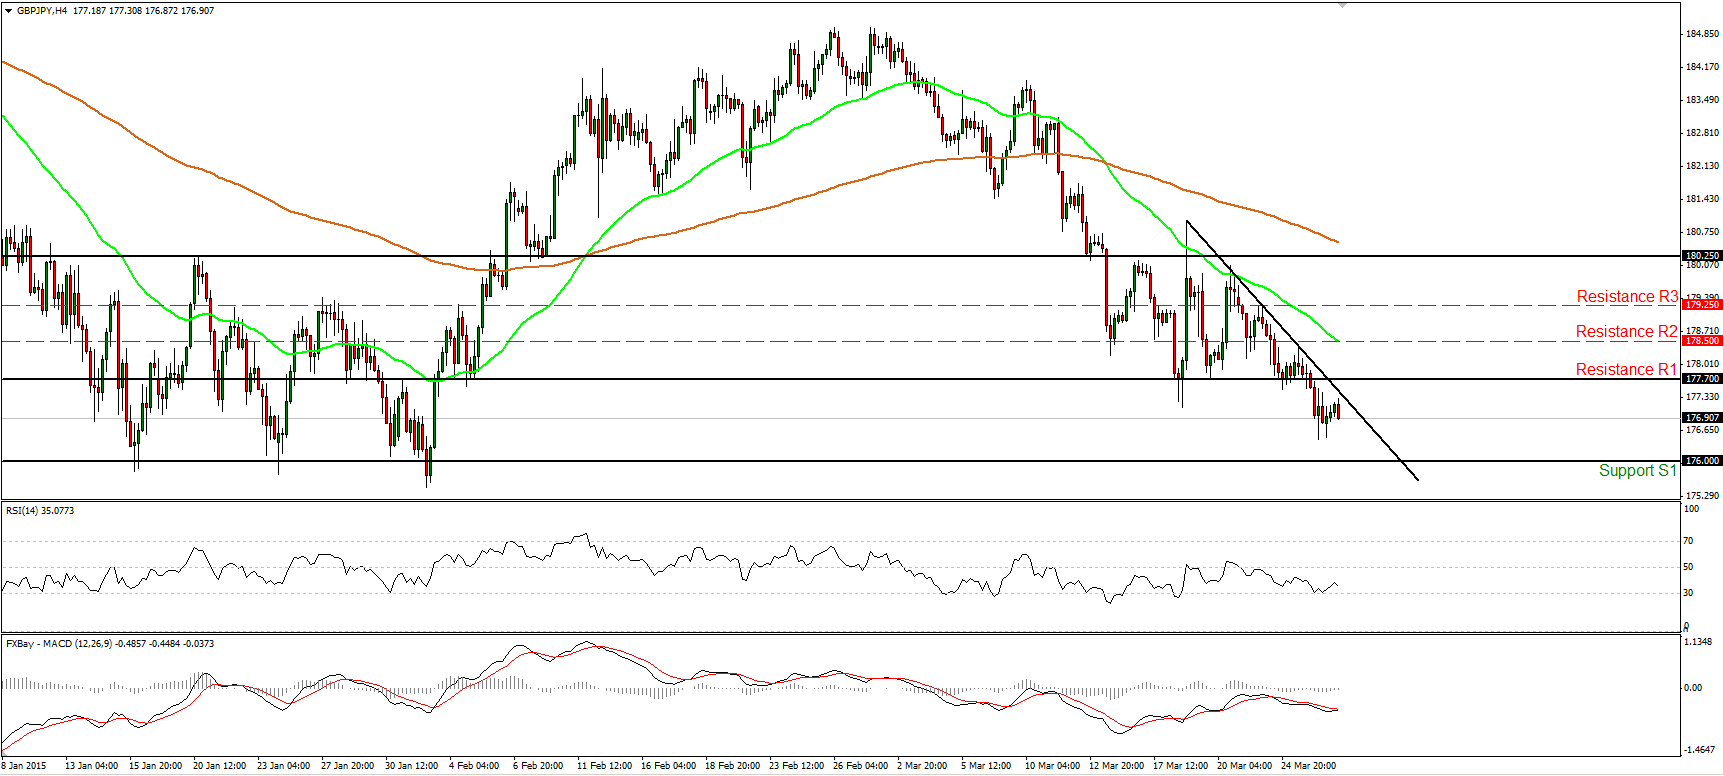
GBP/JPY fell below the lower line of the consolidation range that had been containing the price action since the 13th of March and turned the short-term bias back to the downside, in my view. I would now expect sellers to continue pushing the rate lower and target the strong support zone of 176.00 (S1). Our daily momentum studies detect negative momentum and amplify the case for such a move. The 14-day RSI stand below its 50 line and continues lower, while the MACD, lies below both its zero and signal lines, pointing south. As for the bigger picture, the rate fell below the 200-day moving average, while a decisive dip below 176.00 could complete a 5-month failure swing top and perhaps turn the overall outlook negative.
• Support: 176.00 (S1), 175.00 (S2), 174.00 (S3).
• Resistance: 177.70 (R1), 178.50 (R2), 179.25 (R3).
AUD/USD trades near the moving averages
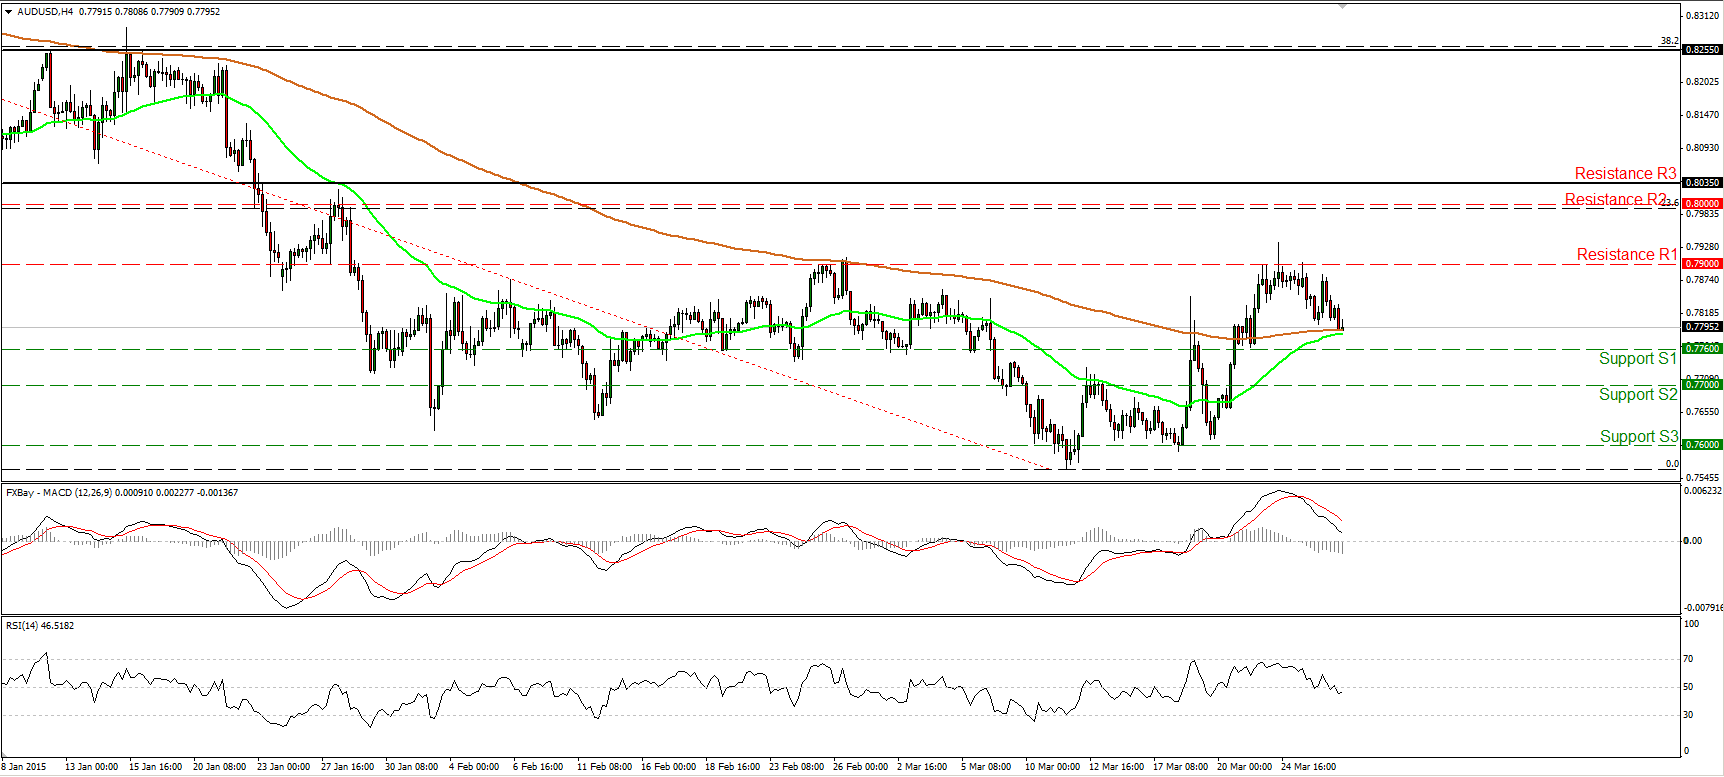
AUD/USD moved lower to meet both the 50- and the 200-period moving averages. Our short-term momentum studies reveal negative momentum, but personally I would like to see a dip below 0.7760 (S1) before getting confident on the downside. For now, I prefer to sit on the sidelines. In the case of a move below 0.7760 (S1), we will have a lower low on the 4-hour chart and we may see extensions towards the 0.7700 (S2) line.
As for the bigger picture, the rate is still trading above the downtrend line taken from back the peak of the 5th of September, confirming the positive divergence between our daily oscillators and the price action. This is another reason I would hold a neutral stance for now. I would like to wait for clearer directional signals.
• Support: 0.7760 (S1), 0.7700 (S2), 0.7600 (S3).
• Resistance: 0.7900 (R1), 0.8000 (R2), 0.8035 (R3).
Gold breaks above 1200
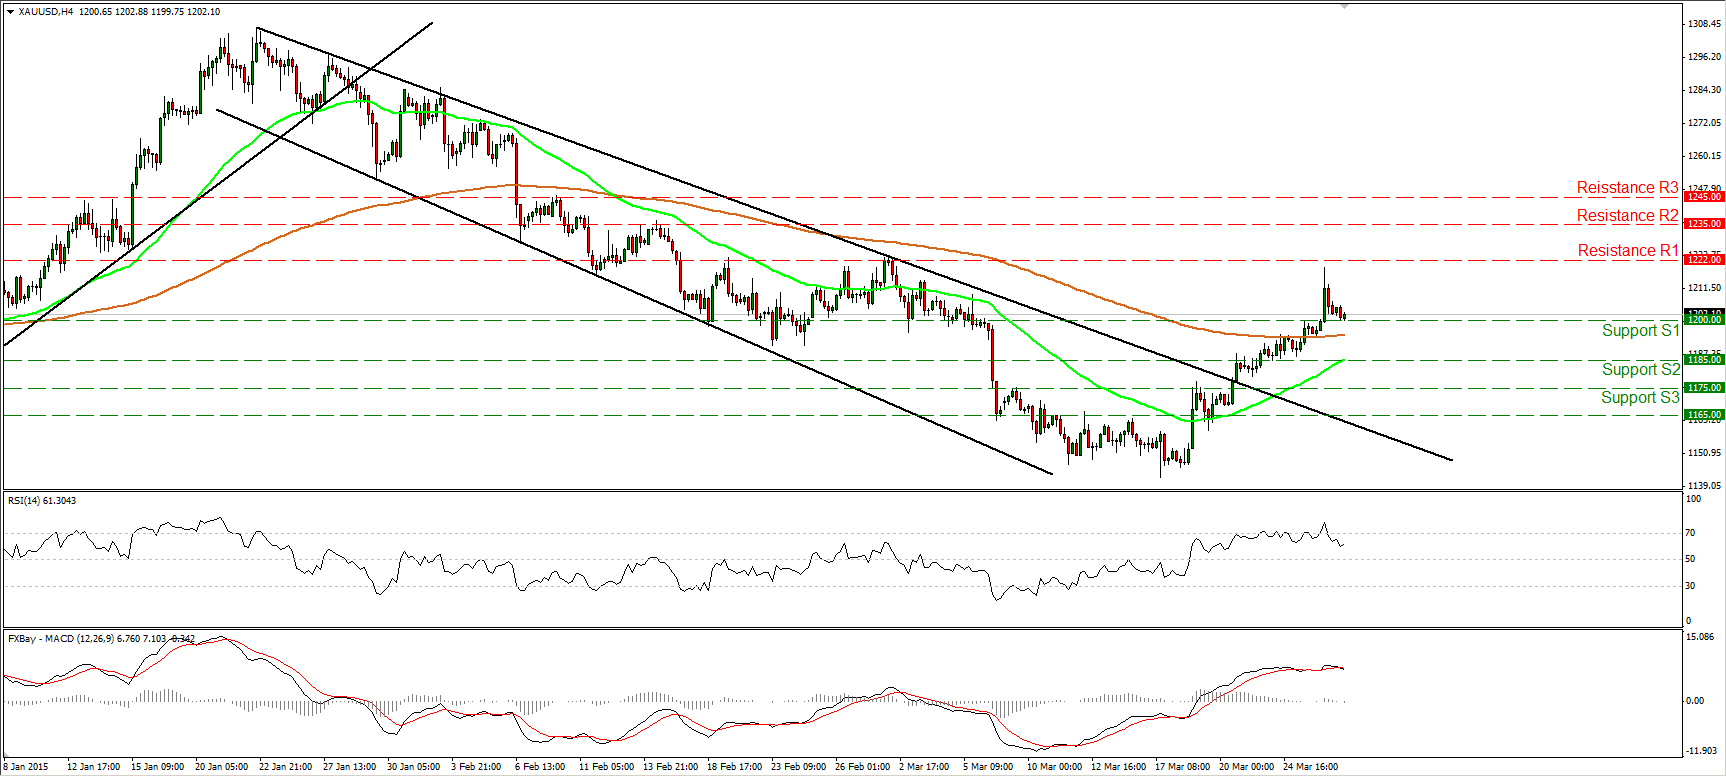
Gold surged on Thursday, breaking above the psychological figure of 1200 (S1). Subsequently, the metal found resistance marginally below our 1222 (R1) hurdle and pulled back to challenge the 1200 (S1) as a support this time. The short-term outlook remains positive and I would expect the bulls to seize control again and set the stage for a test at the 1222 (R1) line. Our daily oscillators support the near-term picture. The 14-day RSI continued to race higher and moved above its 50 line, while the daily MACD, already above its trigger, points up and is getting closer to its zero line.
As for the bigger picture, since the peak at 1307, the price structure has been lower highs and lower lows. However, yesterday’s rally almost reached the prior peak of the downtrend. I would switch my stance to neutral as far the longer-term trend is concerned.
• Support: 1200 (S1), 1185 (S2), 1175 (S3).
• Resistance: 1222 (R1), 1235 (R2), 1245 (R3).
WTI hits 52.45 and turns down
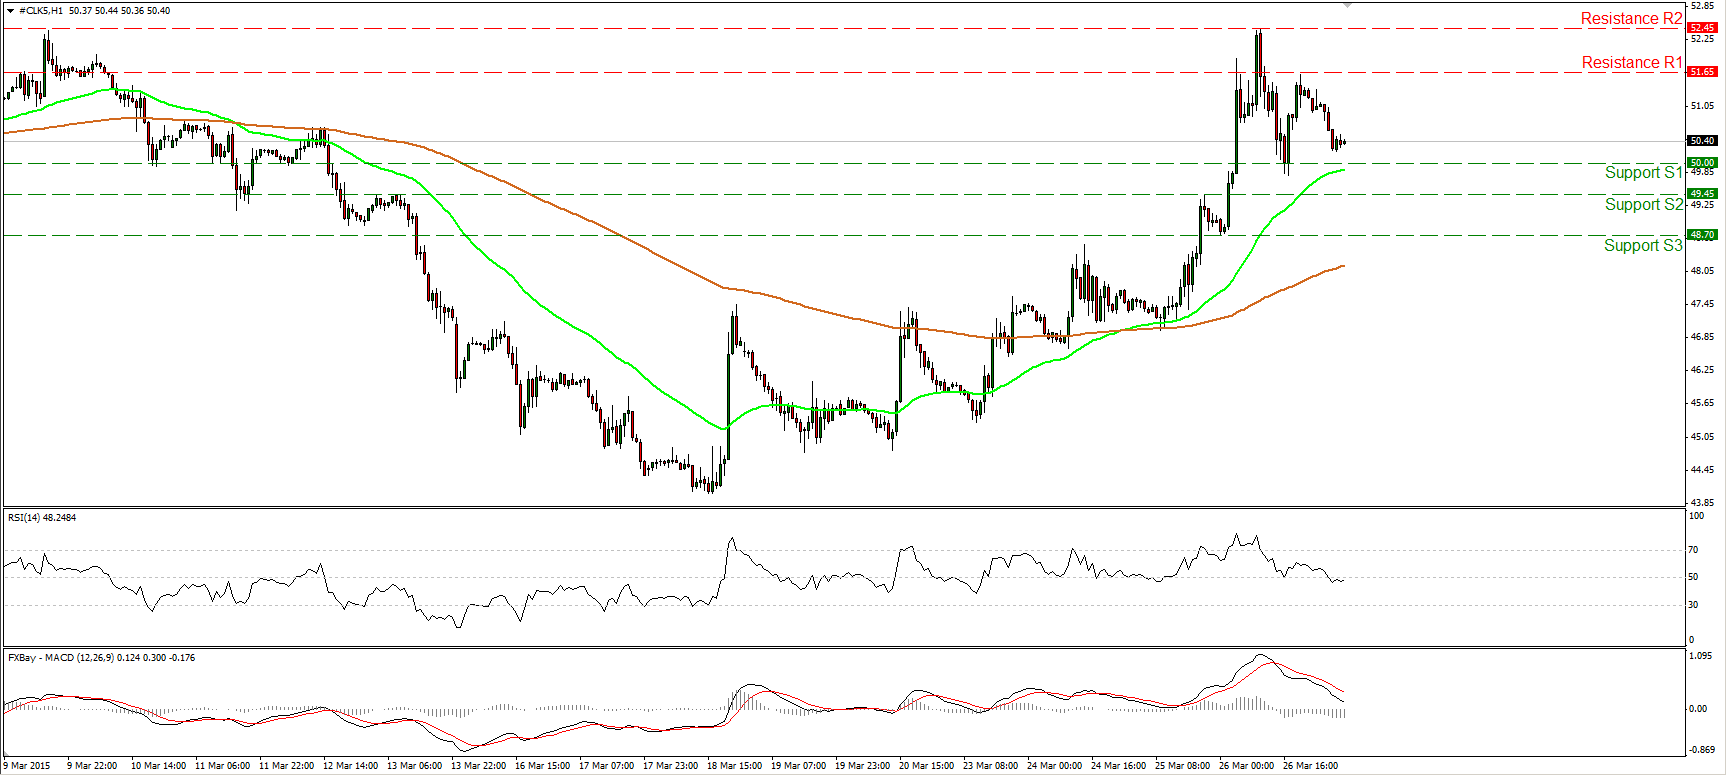
WTI continued its surge during the European morning Thursday and managed to hit our resistance line of 52.45 (R2) before turning down. The price now seems to be forming a failure swing top formation, thus I believe that the picture on the 1-hour chart has turned neutral. I would like to see a clear move below the psychological barrier of 50.00 (S1) before getting confident on the downside. Such a move would signal the completion of the failure swing and would confirm a forthcoming lower low. Our short-term momentum studies support the notion. The RSI slid below its 50 line, while the MACD, although positive, stands below its trigger, points down, and is headed towards its zero line. On the daily chart, WTI is trading well below the 200-day moving average, but traded for a while above the 50-day one. Moreover, there is still positive divergence between the daily oscillators and the price action. Therefore, I would prefer to stay neutral on the larger trend as well and wait for clearer directional signals.
• Support: 50.00 (S1), 49.45 (S2), 48.70 (S3).
• Resistance: 51.65 (R1) 52.45 (R2), 53.40 (R3).
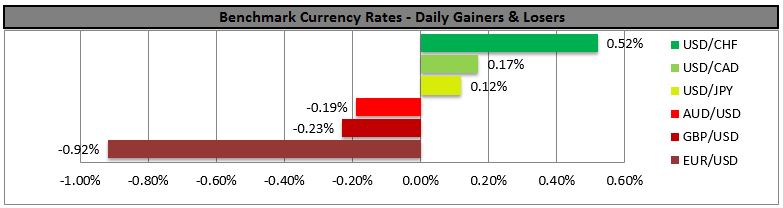
BENCHMARK CURRENCY RATES - DAILY GAINERS AND LOSERS
MARKETS SUMMARY