EUR/USD dips below 1.2760
EUR/USD broke below the 1.2760 line on Thursday, but after finding support at 1.2693 (S1), the rate rebounded to test the 1.2760 bar as a resistance. On the daily chart, the pair is still printing lower peaks and lower troughs below both the 50- and the 200-day moving averages, thus I will maintain the view that the overall path remains to the downside. I still expect the rate to challenge the low of the 13th of November 2012, at 1.2660 (S2). I decisive dip below that hurdle could set the stage for larger bearish extensions, perhaps towards the psychological level of 1.2500 (S3).
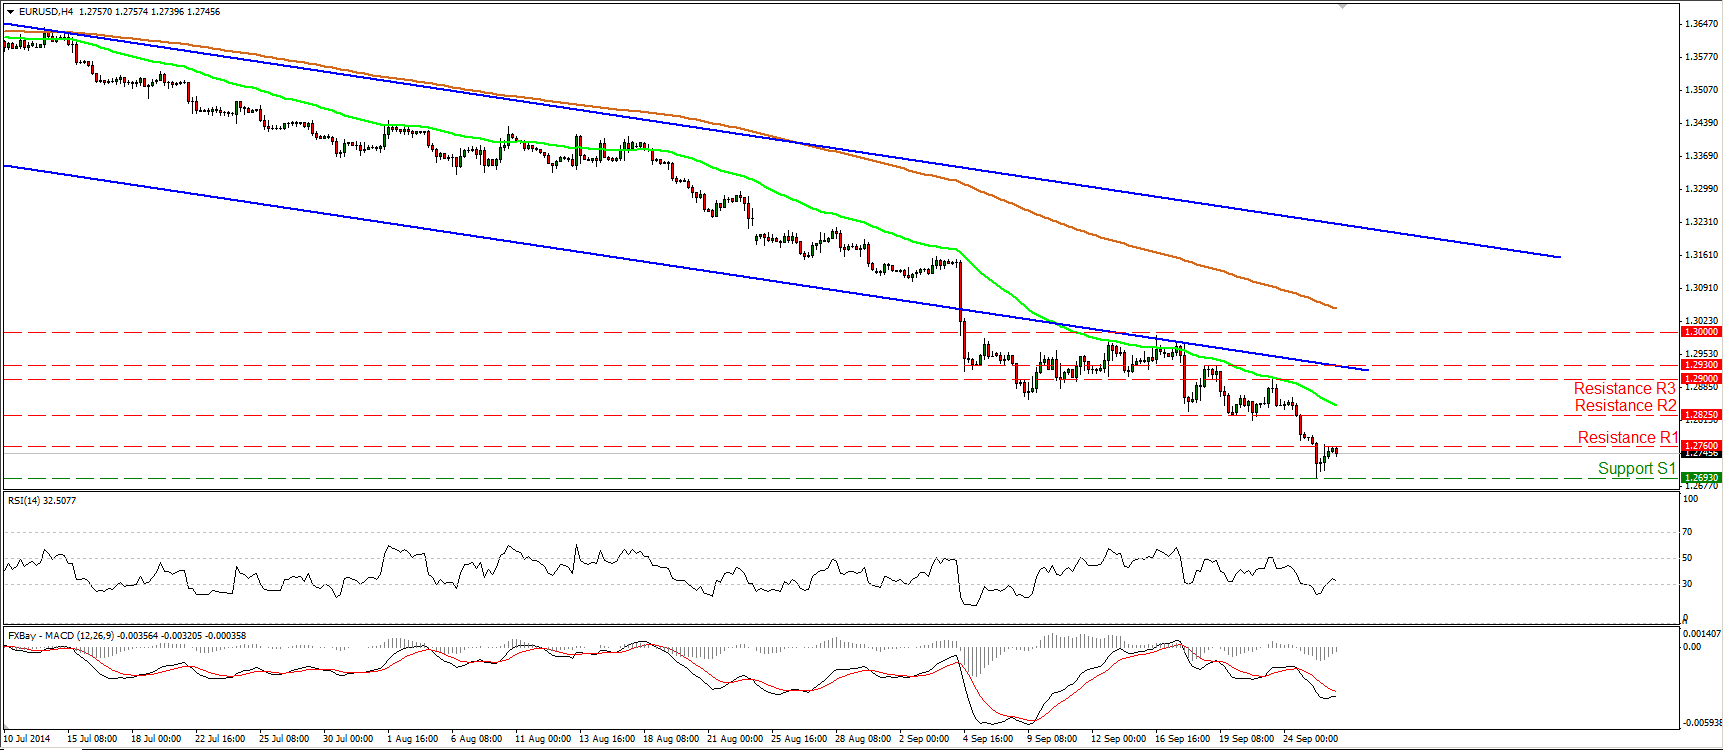
• Support: 1.2693 (S1), 1.2660 (S2), 1.2500 (S3).
• Resistance: 1.2760 (R1), 1.2825 (R2), 1.2900 (R3).
GBP/USD marginally above the support of 1.6280
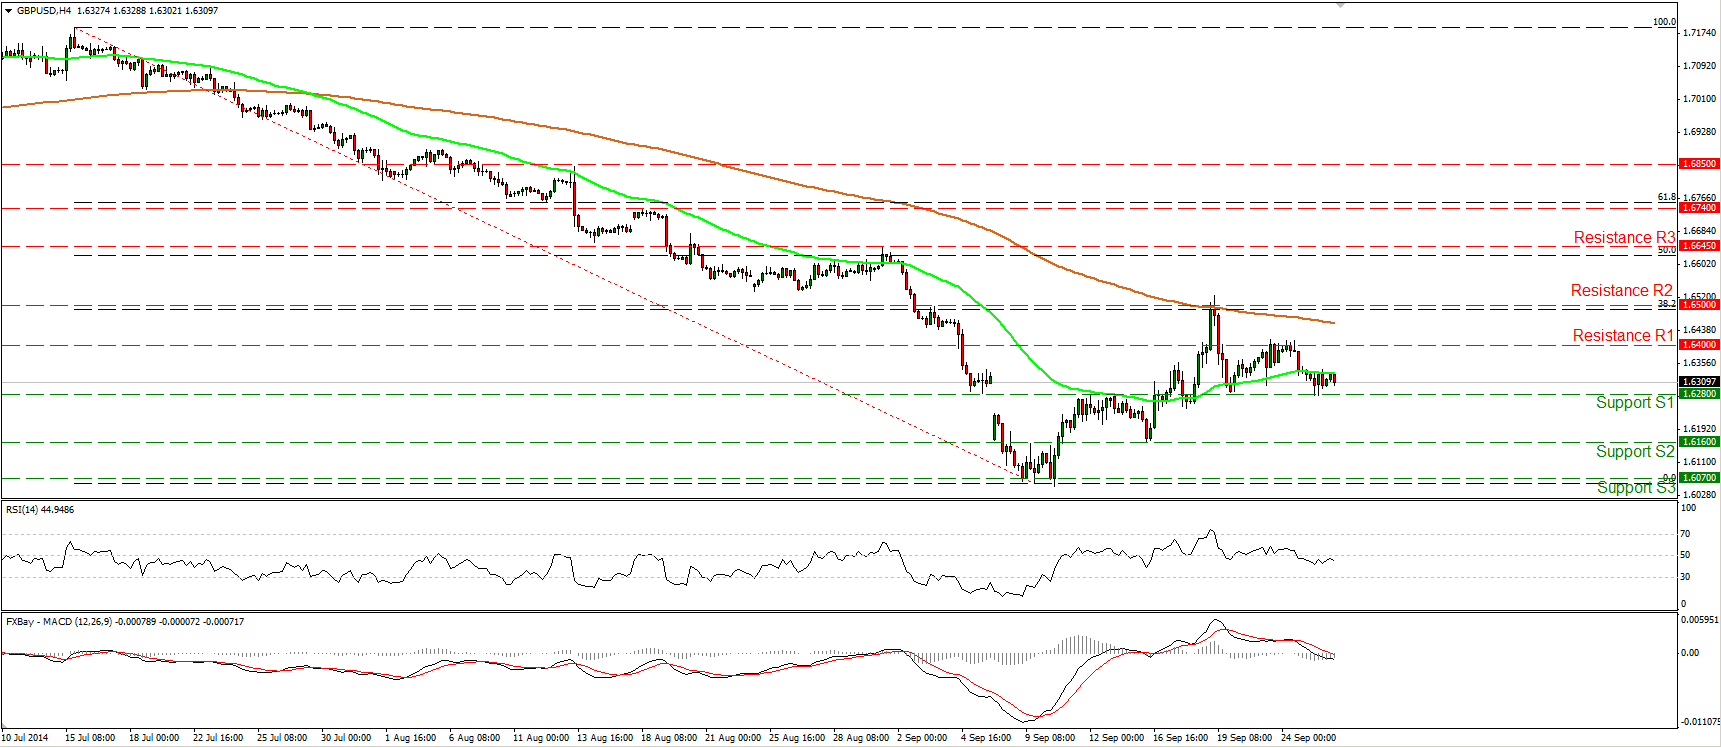
GBP/USD moved in a consolidative mode, remaining marginally above the support line of 1.6280 (S1). A decisive dip below that barrier could confirm that the 9th -19th of September up move was just a 38.2% retracement level of the 15th of July – 9th of September decline, and could trigger extensions towards our next support line of 1.6160 (S2). Looking at our momentum studies, the RSI remains below its 50 line and is pointing somewhat down, while the MACD, already below its trigger, obtained a negative sign. This designates negative momentum and magnifies the case for further declines in the near future. In the bigger picture, the fact that Cable remains below the 80-day exponential moving average, is an additional reason why I treat the 9th -19th of September up move as corrective.
• Support: 1.6280 (S1), 1.6160 (S2), 1.6070 (S3).
• Resistance: 1.6400 (R1), 1.6500 (R2), 1.6645 (R3).
EUR/JPY finds support at 138.45

EUR/JPY tumbled yesterday, but found some buy orders near the 138.45 (S1) support line and the 50% retracement level of the 5th -19th of September advance. A break above the resistance of 139.20 (R1) is likely to confirm the rebound and that the 19th - 25th September down wave was just a corrective move. Such a break could pull the trigger for another test near the 140.20 (R2) resistance zone. The RSI found support at its 30 line and moved higher, while the MACD shows signs of bottoming and could move above its trigger in the close future. These momentum signs increase the possibilities for the aforementioned rebound. In the bigger picture, as long as the pair remains above the upper bound of the downside channel drawn from back the beginning of April, I would consider the overall picture to be mildly positive.
• Support: 138.45 (S1), 138.25 (S2), 137.50 (S3).
• Resistance: 139.20 (R1), 140.20 (R2), 141.00 (R3).
Gold rebounds again from near 1208
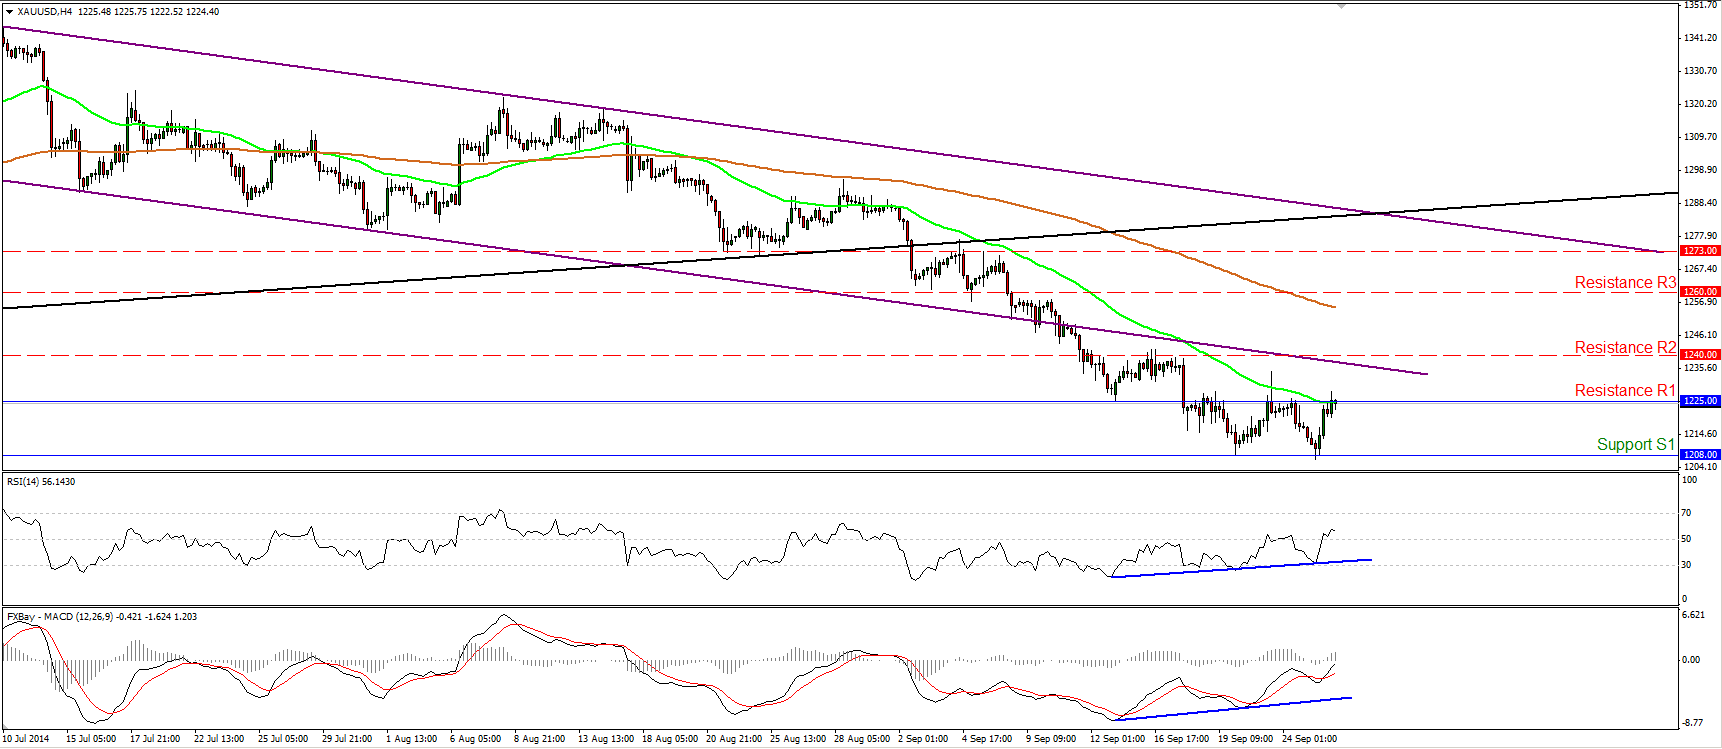
Gold moved lower yesterday, but after touching again the 1208 (S1) support area, it rebounded to find resistance near the resistance of 1225 (R1). Taking into account that the metal seems to be oscillating between these two lines, and that the positive divergence between the price action and both of our momentum studies is still in effect, I would prefer to take the side-lines again. On the daily chart, the price structure still suggests a downtrend, but our daily momentum indicators give me an extra reason to remain flat. The 14-day RSI exited its oversold field and is now pointing up, while the daily MACD shows signs of bottoming and looks ready to move above is signal line any time soon.
• Support: 1208 (S1), 1200 (S2), 1180 (S3).
• Resistance: 1225 (R1), 1240 (R2), 1260 (R3).
WTI finds support at 92.00
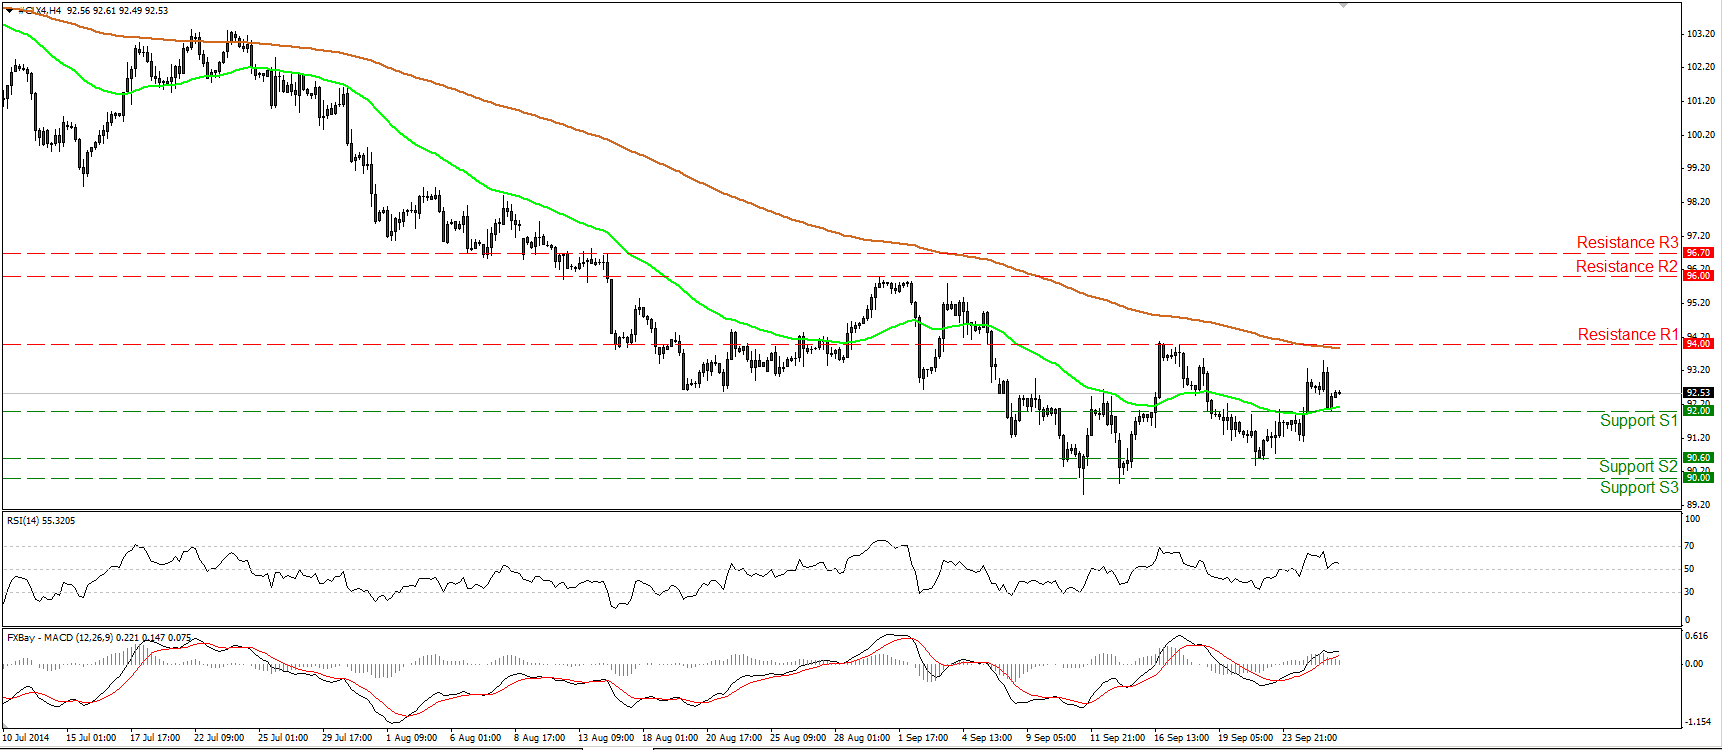
WTI declined yesterday, tested the 92.00 barrier as a support and then, it rebounded somewhat. As long as I don’t see a clear trending structure on the 4-hour chart, I would prefer to maintain my “wait and see” stance. Moreover, zooming out on the daily chart, the trend remains to the downside in my view, but I still see positive divergence between both the daily oscillators and the price action. This is another reason I would prefer to stay neutral. A move above the 94.00 (R1) resistance is likely to confirm the divergence and could open the way for the next obstacle at 96.00 (R2). On the other hand, I would like to see a clear dip below the psychological level of 90.00 (S3) before getting more confident about larger declines.
• Support: 92.00 (S1), 90.60 (S2), 90.00 (S3).
• Resistance: 94.00 (R1), 96.00 (R2), 96.70 (R3) .
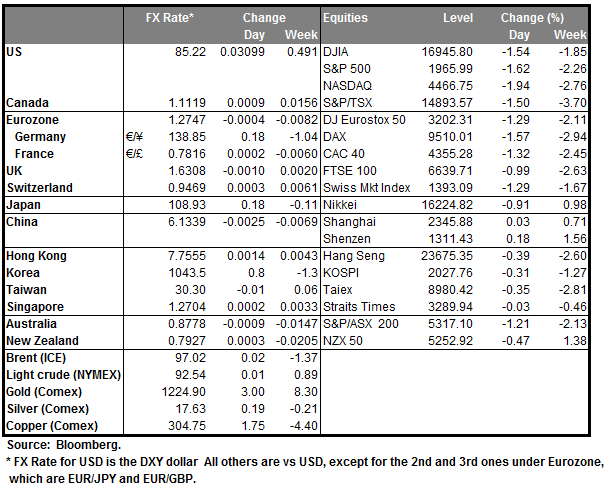
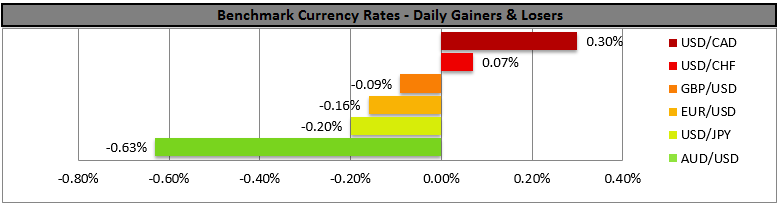
BENCHMARK CURRENCY RATES - DAILY GAINERS AND LOSERS
MARKETS SUMMARY