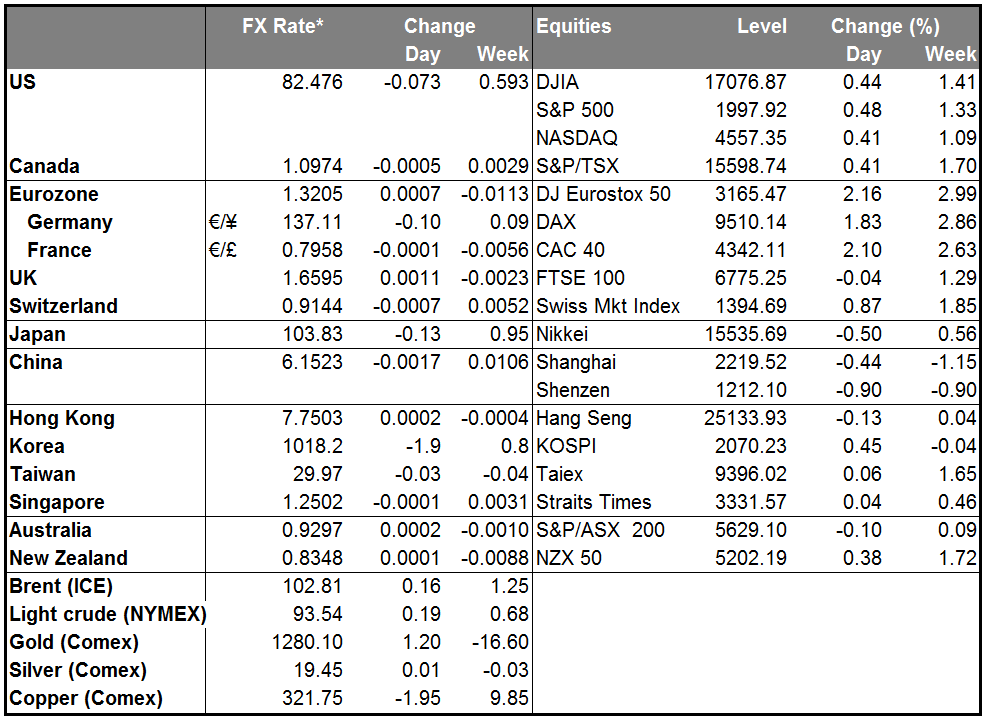
EUR/USD finds strong support at 1.3185
EUR/USD remained supported by the 1.3185 (S1) line, despite the greater-than-expected decline in all three Ifo indices yesterday. Today, during the early European morning the pair rebounded from that barrier and is back above 1.3200. The RSI exited oversold conditions and is pointing up, while the MACD, although negative, seems ready to move above its trigger line. Having these momentum signs in mind, an upside corrective wave is likely, maybe to challenge the 1.3240 (R1) barrier as a resistance this time. However, I will stick to the view that the overall picture is to the downside. The rate is still trading within the downside channel, connecting the highs and the lows on the daily chart, and a decisive dip below 1.3185 (S1) in the near future could see scope for extensions towards our next support line of 1.3100 (S2).
• Support: 1.3185 (S1), 1.3100 (S2), 1.3000 (S3).
• Resistance: 1.3240 (R1), 1.3300 (R2), 1.3330 (R3).
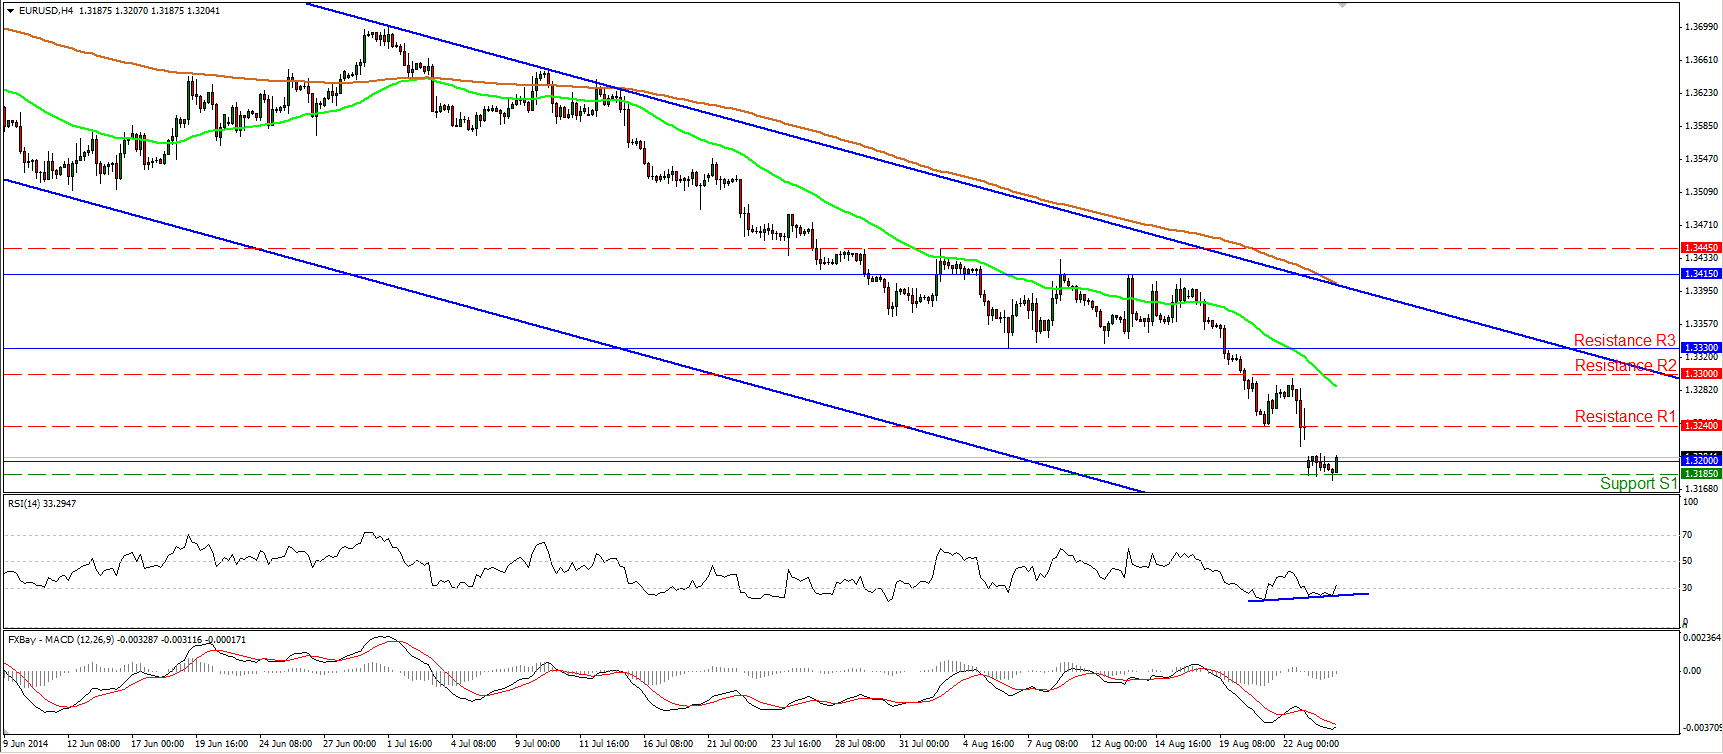
GBP/JPY hits the resistance zone of 172.60
GBP/JPY moved in a consolidative mode after hitting the resistance line of 172.60 (R1) and the black downside resistance line. Under normal circumstances I would expect the forthcoming wave to be to the downside, but I still see both my momentum indicators within their positive territories and supported by their blue upside support lines. As a result, I would remain neutral here as well until we have clearer directional signals. A clear price dip below 171.60 (S1) alongside a dip by our momentum studies below their support lines is likely to confirm that the downside path is still intact and could target the next support, at 170.75 (S2).
• Support: 171.60 (S1), 170.75 (S2), 170.45 (S3).
• Resistance: 172.60 (R1), 173.50 (R2), 174.20 (R3).
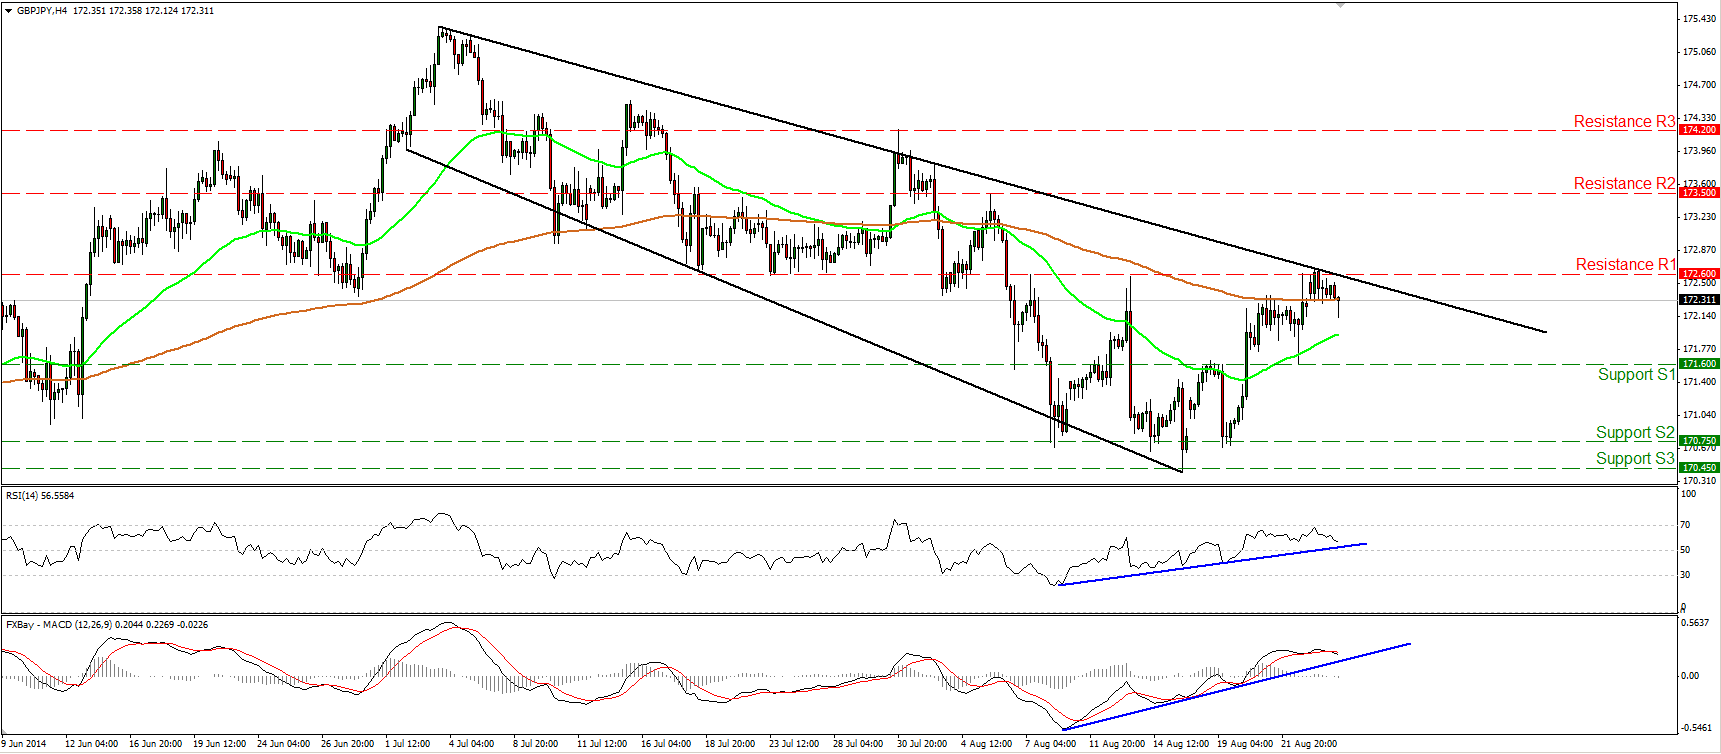
AUD/USD within a possible triangle formation
AUD/USD moved lower on Monday after finding resistance at the upper boundary of a possible triangle formation, slightly below the 0.9330 obstacle and the 200-period moving average. The MACD found resistance at its prior support line and moved below its signal and zero lines, while the RSI seems ready to re-cross above 50. Considering that the pair is trading within a sideways formation and that we have mixed momentum signals, I would prefer to stay neutral and wait for the rate to break out of the possible triangle. The longer-term picture is cautiously to the downside, since the pair is trading within a downside channel after the completion of a possible complex head and shoulders formation.
• Support: 0.9270 (S1), 0.9240 (S2), 0.9200 (S3).
• Resistance: 0.9330 (R1), 0.9375 (R2), 0.9415 (R3).
Gold remains within its recent range

Gold moved somewhat higher on Monday, but remained within the range between the support of 1273 (S1) and the resistance of 1283 (R1). The RSI rebounded from its 30 line and is pointing up, while the MACD crossed above its signal line. Bearing these technical signs in mind, I will take to the sidelines for now and will wait for the metal to exit the aforementioned range. A move above 1283 (R1) could confirm our oscillators and could pave the way towards our next resistance at 1295 (R2). On the other hand, a dip below 1273 (S1) is likely to find support at 1267 (S2). In the bigger picture, the yellow metal is trading within a downside channel and this keeps the overall outlook cautiously to the downside.
• Support: 1273 (S1), 1267 (S2), 1258 (S3).
• Resistance: 1283 (R1), 1295 (R2), 1305(R3).
Is WTI ready for a leg higher?
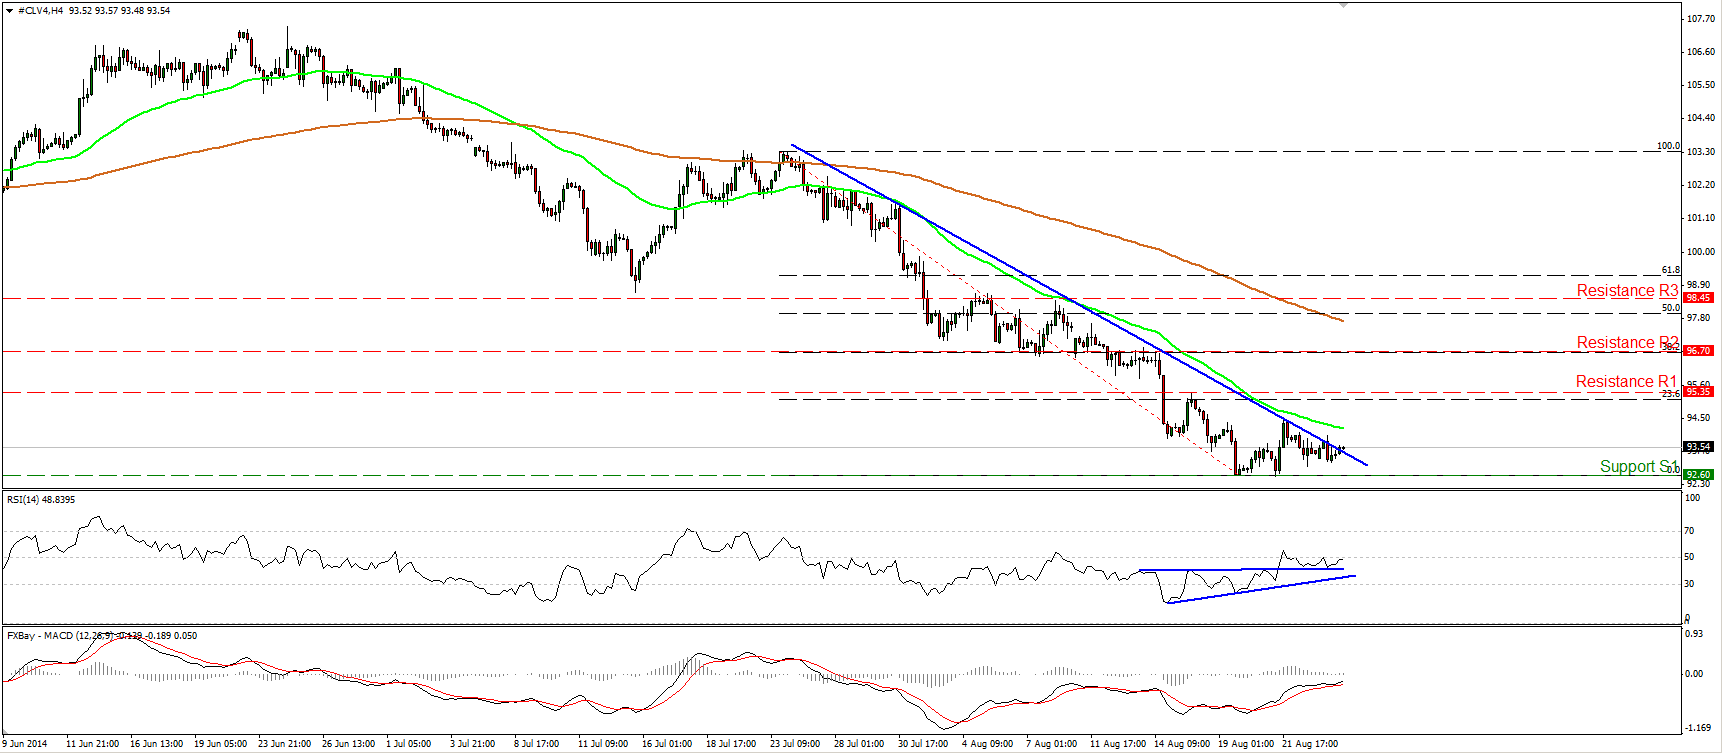
WTI moved in a consolidative mode yesterday, but seems ready to move above the blue short-term downtrend line. The price is at a critical point in my view. Looking at our momentum studies, I would maintain my flat view. The RSI rebounded from a prior resistance line (turned into support), while the MACD, although in its bearish territory, remains above its signal line. Moreover, we have positive divergence between the RSI and the price action. A price move above the trend-line and the resistance of 95.35 (R1) is likely to confirm the divergence and pave the way for the next resistance obstacle at 96.70 (R2), which coincides with the 38.2% retracement level of the 23rd July – 19th August downtrend. On the other hand, we need a dip below 92.60 (S1) to have a forthcoming lower low and the continuation of the downside path. On the daily chart, the 14-day RSI exited its oversold zone, while the daily MACD seems ready to move above its trigger line. This amplifies the case that we may have a decisive move above the trend line in the near future.
• Support: 92.60 (S1), 91.60 (S2), 90.00 (S3).
• Resistance: 95.35 (R1), 96.70 (R2), 98.45 (R3).
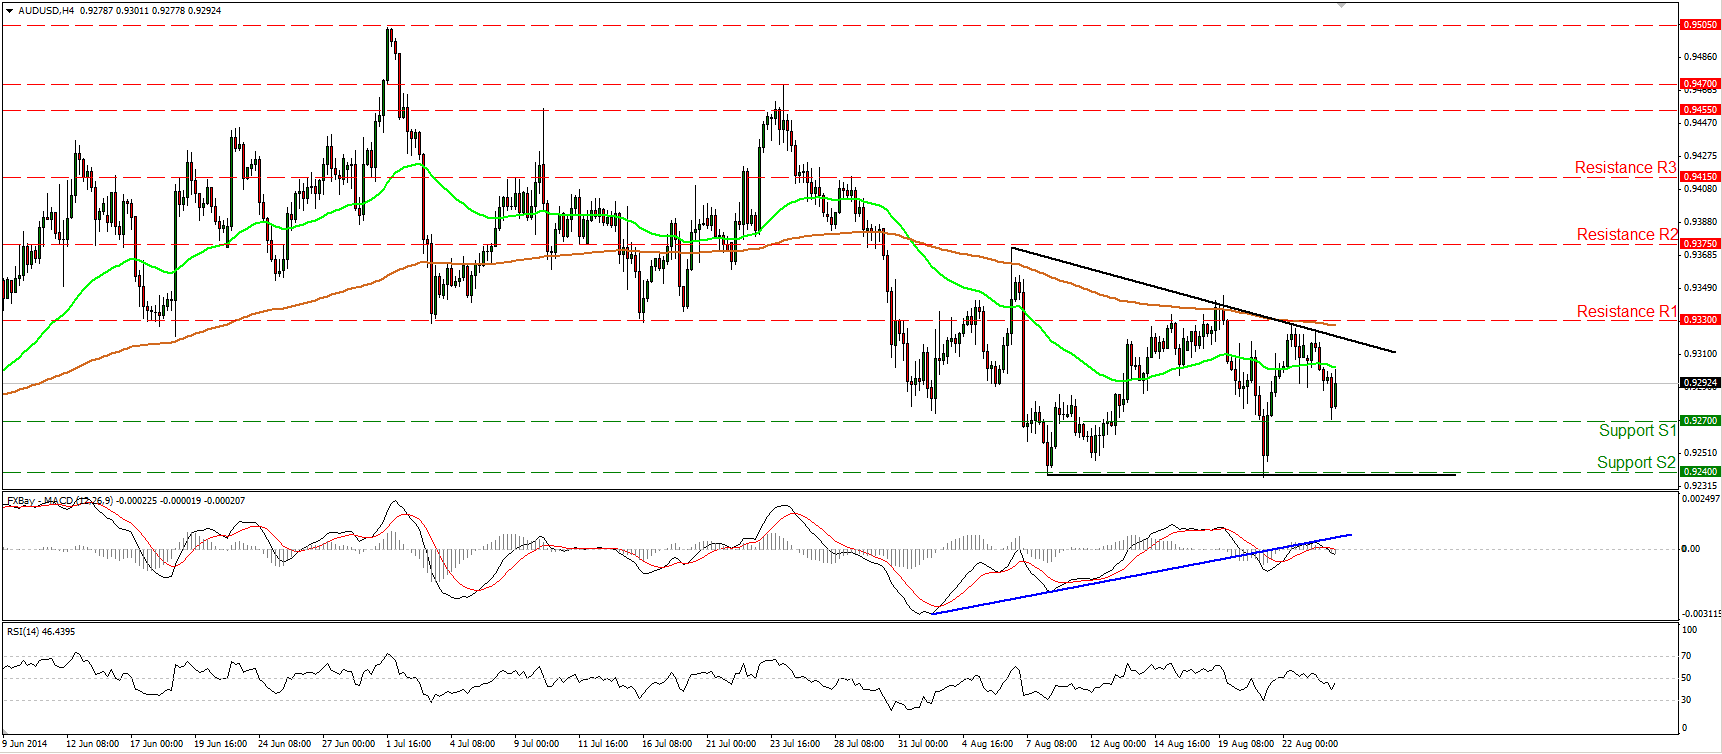
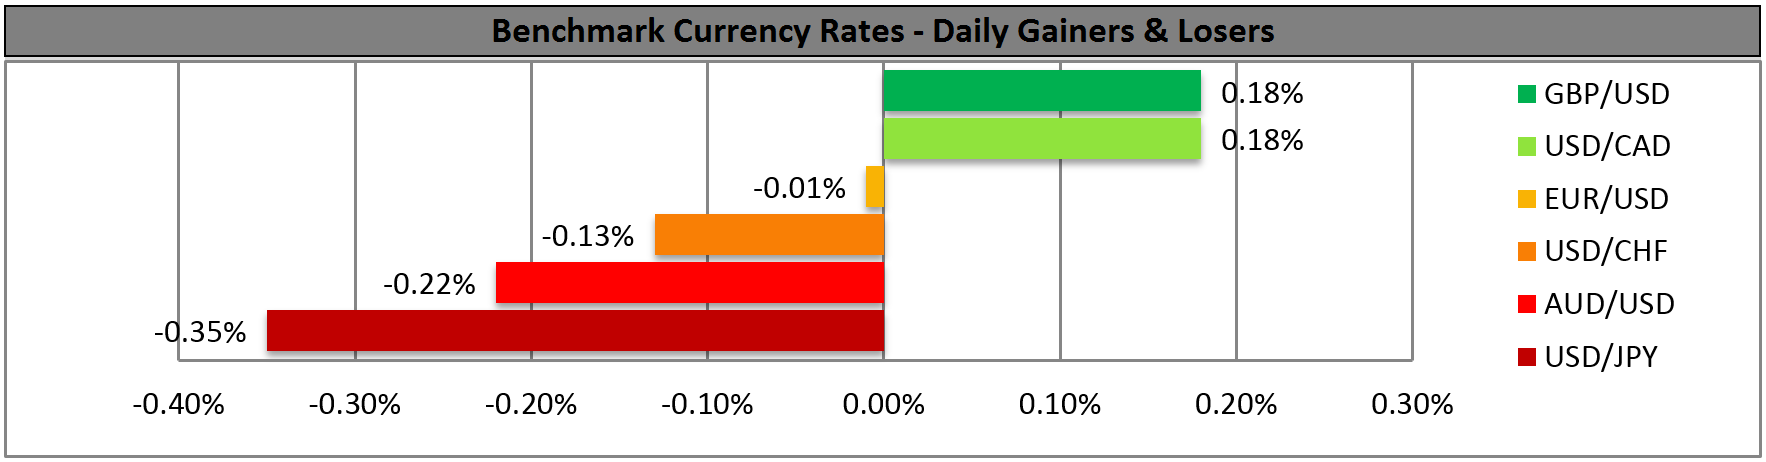
BENCHMARK CURRENCY RATES - DAILY GAINERS AND LOSERS
MARKETS SUMMARY