EUR/USD rebounds and hits 1.2440
EUR/USD continued its rebound on Monday to hit the resistance line of 1.2440 (R1) and the lower bound of the short-term blue upside channel. Since the possibility of a lower high near that area is high, I would expect the forthcoming wave to be negative and target once again the support area of 1.2360 (S1), defined by yesterday’s lows and the lows of the 6th and 7th of November. A clear move below that obstacle would confirm a forthcoming lower low on the daily chart and perhaps open the way for the 1.2250 (S2) area, marked by the lows of August 2012. Taking a look at our daily momentum studies, I still see positive divergence between them and the price action, something that gives me additional reasons to wait for a decisive dip below 1.2360 (S1) before getting more confident on longer-term downtrend.
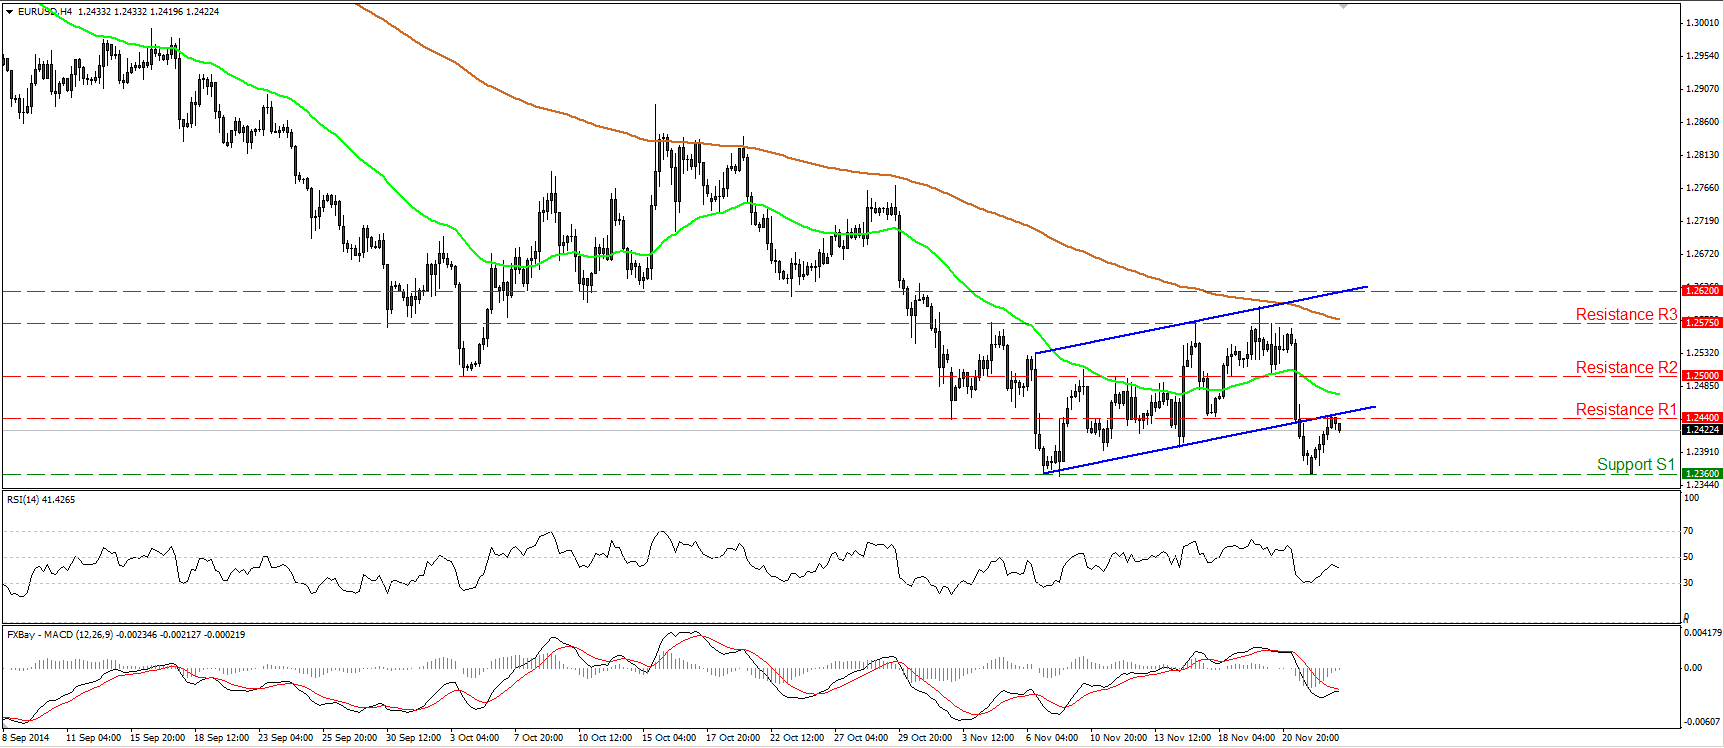
• Support: 1.2360 (S1), 1.2250 (S2), 1.2130 (S3).
• Resistance: 1.2440 (R1), 1.2500 (R2), 1.2575 (R3).
Is USD/JPY ready for a correction?
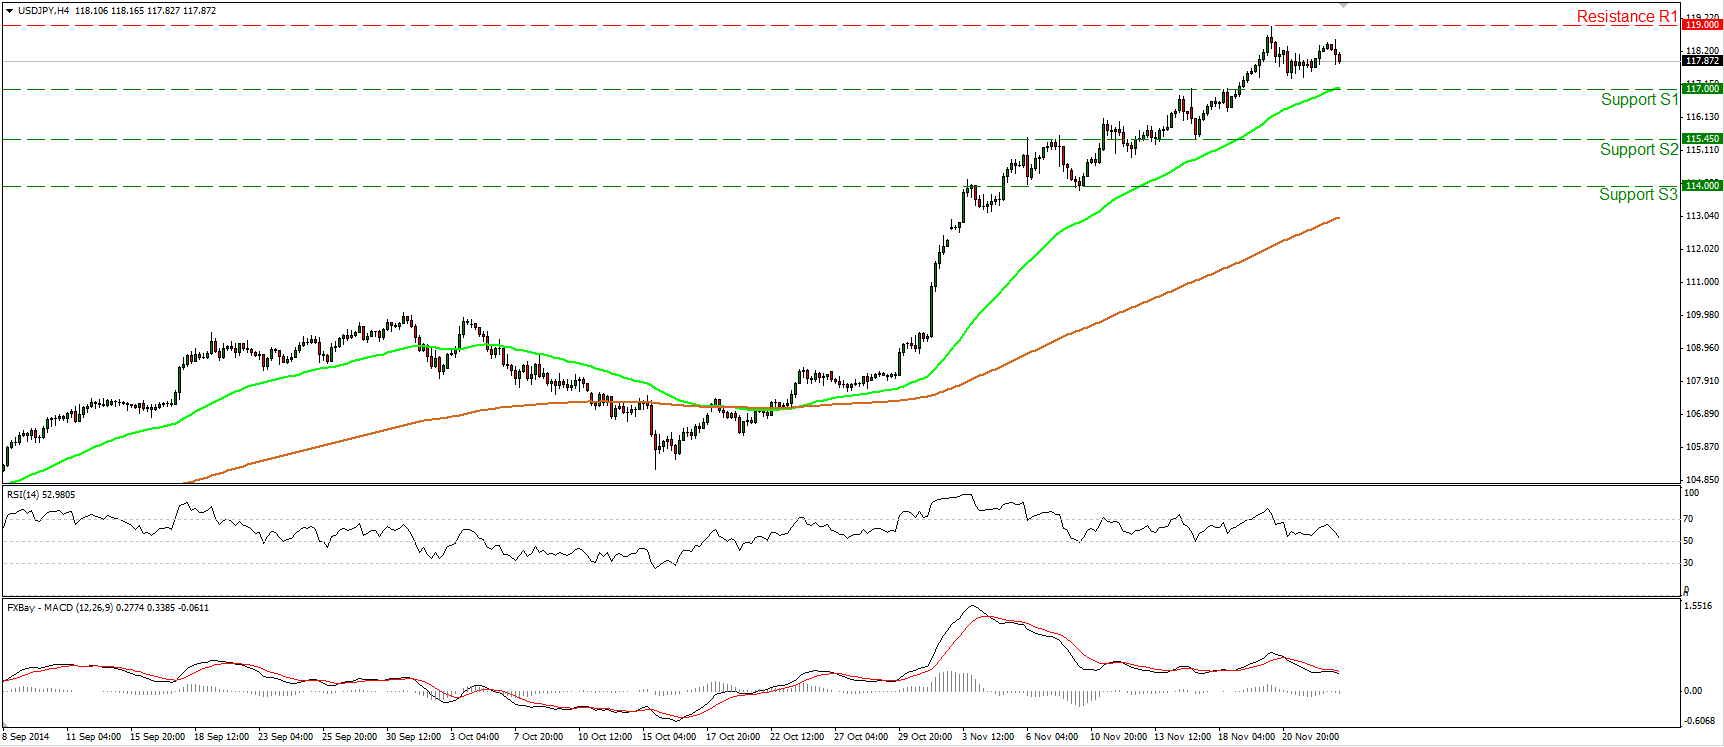
USD/JPY moved in a quiet mode staying between the support line of 117.00 (S1) and the resistance of 119.00 (R1). The RSI, although above 50, it is pointing down, while the MACD, although positive, stands below its signal line. Having in mind our momentum studies, I would expect USD/JPY to correct lower, perhaps for a test at the 117.00 (S1) barrier. A clear break below the 117.00 (S1) hurdle could extend the correction, perhaps towards the next support line, at 115.45 (S2). Switching to the daily chart, I still see a longer-term uptrend, but our daily momentum signs amplify the case for the beginning of a corrective move. The 14-day RSI is pointing down and could exit its overbought territory, while the daily MACD shows signs of topping and could cross below its trigger line in the near future.
• Support: 117.00 (S1), 115.45 (S2), 114.00 (S3).
• Resistance: 119.00 (R1), 120.00 (R2), 121.00 (R3).
AUD/USD finds resistance near the 0.8700 line
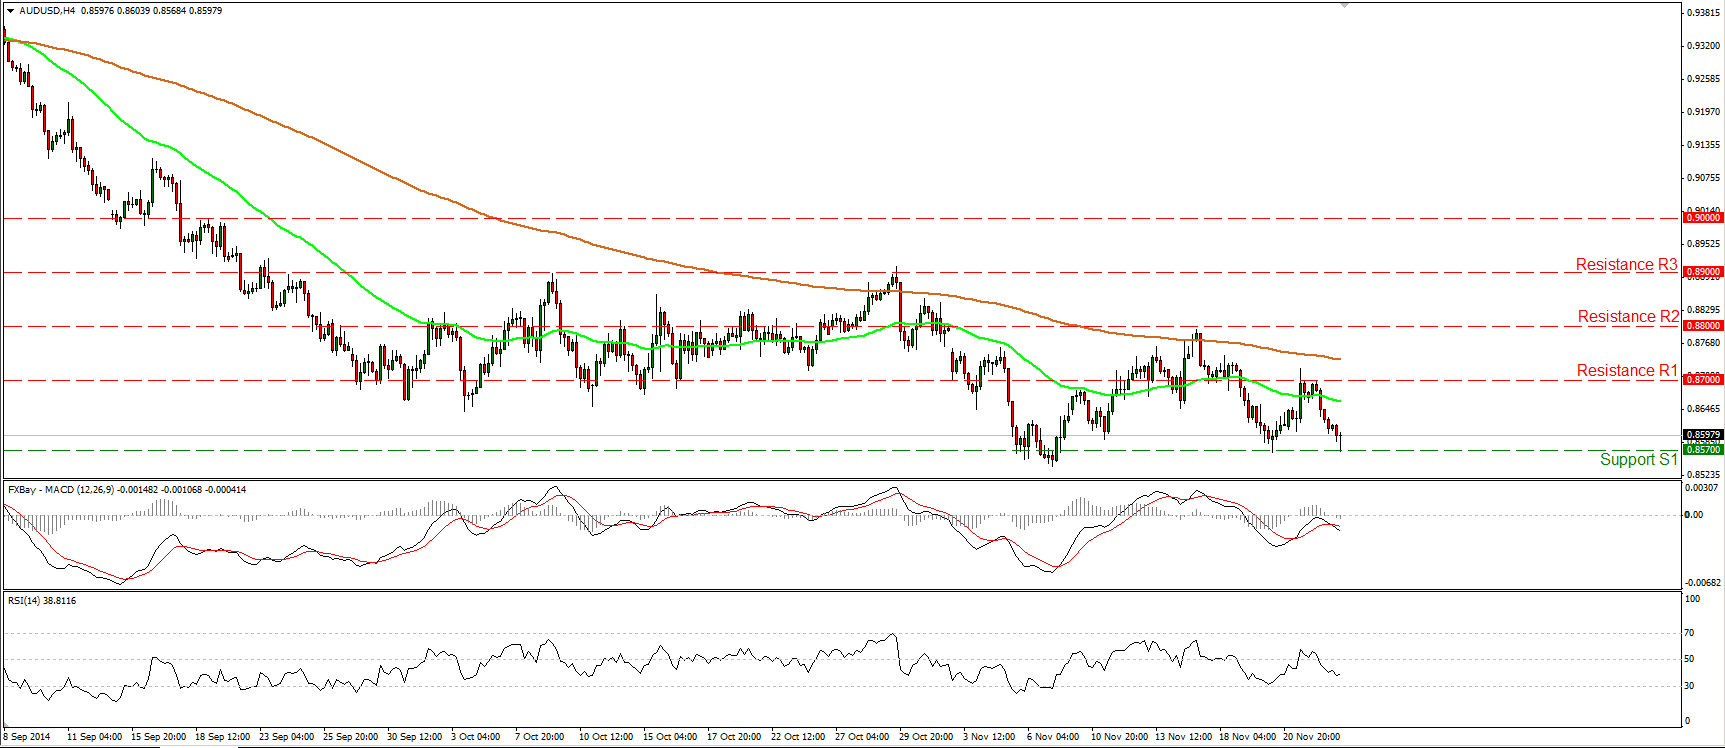
AUD/USD formed a lower high near the 0.8700 (R1) area and declined to find support at 0.8570 (S1), a support line determined by the low of last Thursday. On the daily chart, since the rate remains below both the 50- and 200- day moving averages, I still see a longer-term downtrend, but I still can spot positive divergence between both our daily momentum studies and the price action. As a result, I would prefer to see a dip below the key line of 0.8500 (S2) before getting more confident on the downside. Such a move is likely to confirm a lower low on the daily chart and perhaps open the way for the 0.8300 (S3) area, defined by the lows of July 2010.
• Support: 0.8570 (S1), 0.8500 (S2), 0.8300 (S3).
• Resistance: 0.8700 (R1), 0.8800 (R2), 0.8900 (R3).
Gold consolidates below 1205
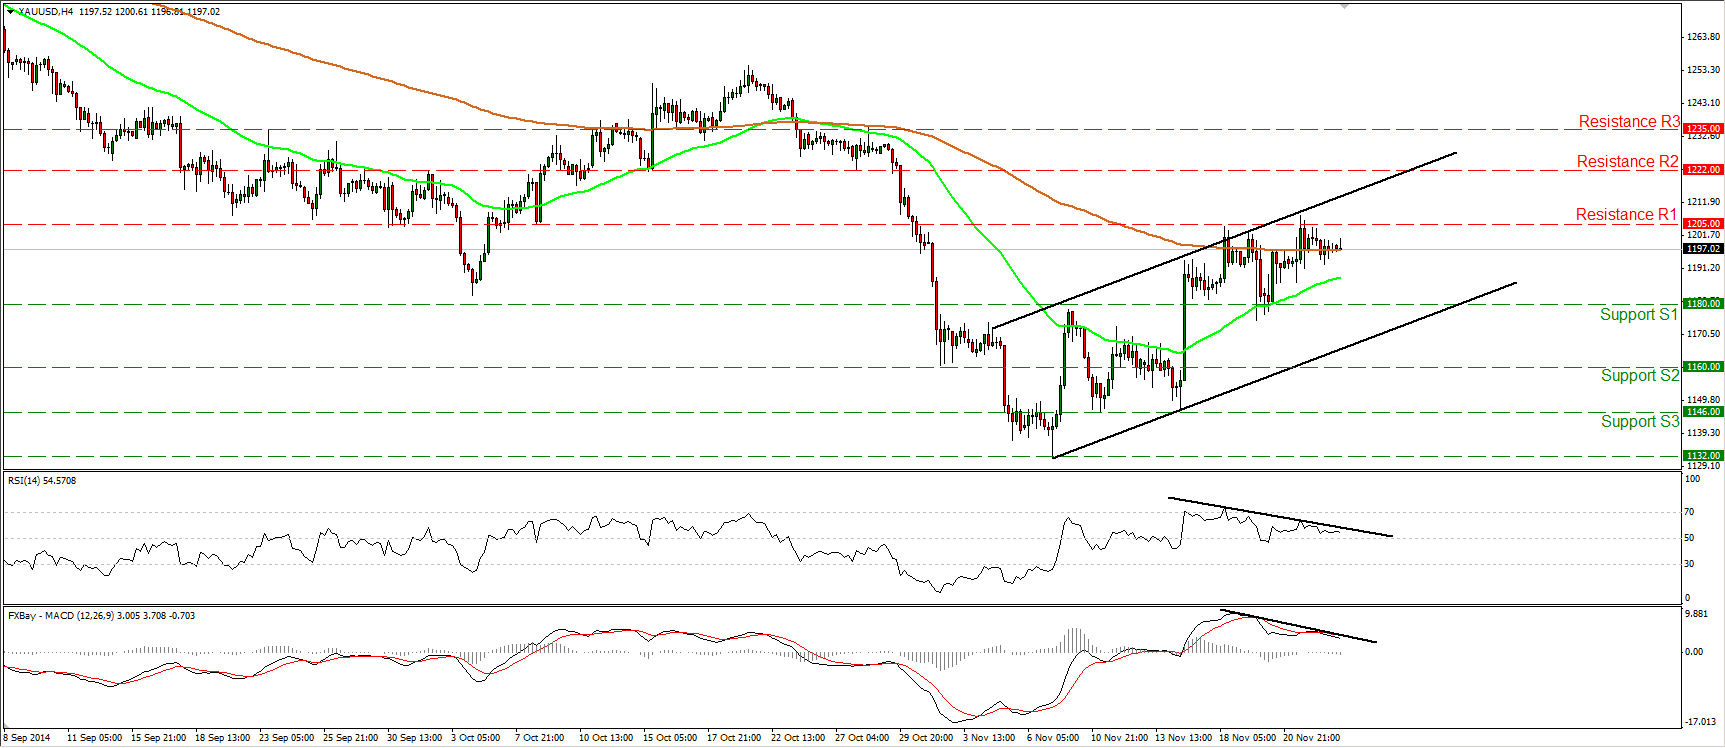
Gold moved in a consolidative manner on Monday, staying below the 1205 (R1) resistance hurdle. Shifting my attention to our near-term momentum studies, I see negative divergence between both of them and the price action. As a result, I would not rule out a short-term top near the 1205 (R1) area and a pullback towards the 1180 (S1) area or the lower boundary of the black upside channel. In the bigger picture, I still see a longer-term downtrend. Hence I would treat the recovery from 1132 as a corrective move for now. In the absence of any major bullish trend reversal signal, I would prefer to adopt a “wait and see” stance as far as the overall outlook of the precious metal is concerned.
• Support: 1180 (S1), 1160 (S2), 1146 (S3).
• Resistance: 1205 (R1), 1222 (R2), 1235 (R3).
WTI slightly lower
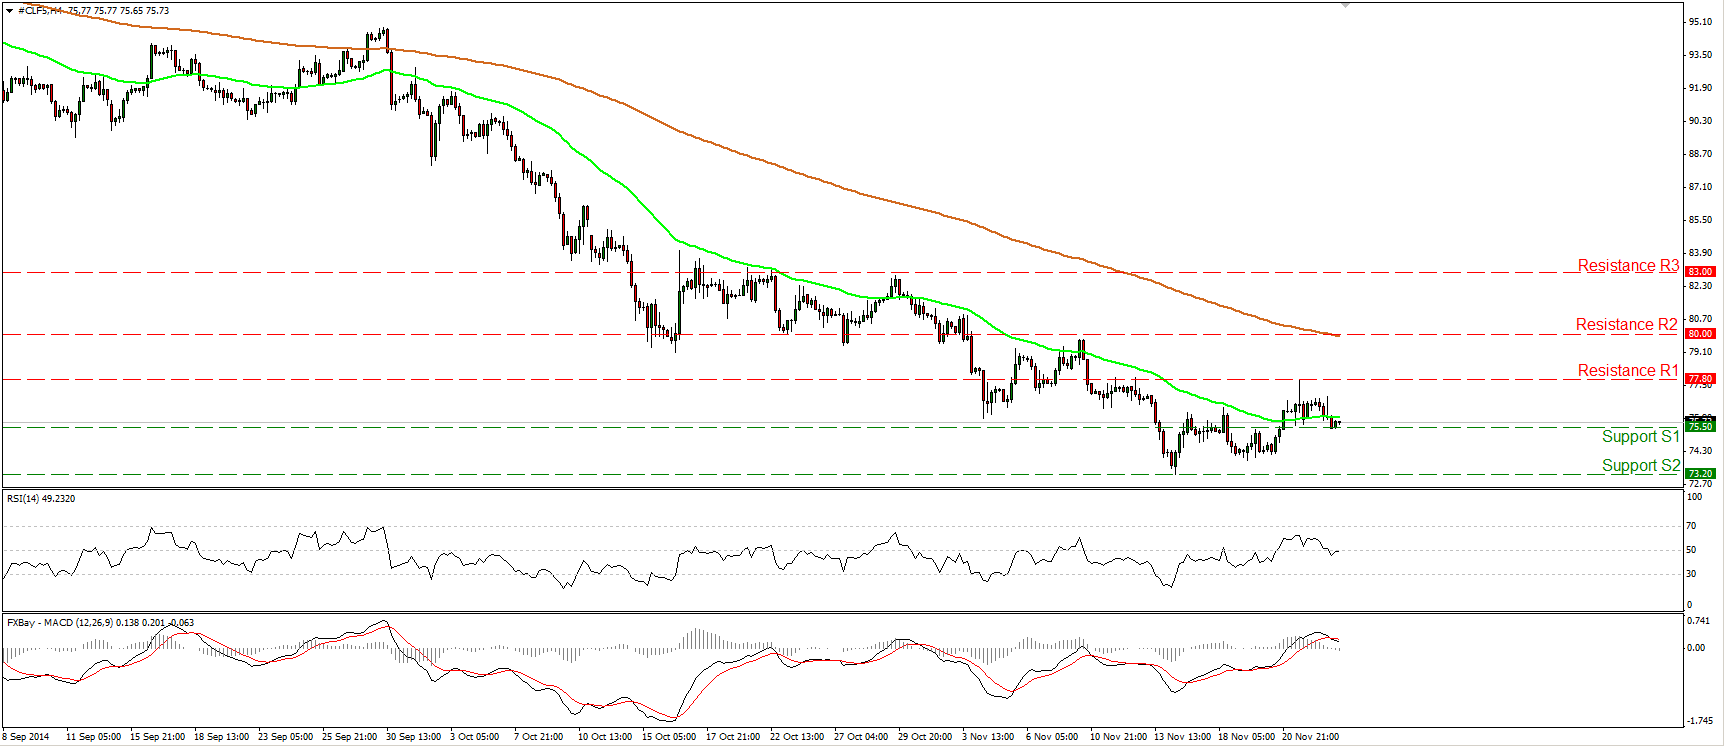
WTI declined slightly yesterday to find support near the 75.50 (S1) line. A dip below that line is likely to extend the bearish wave perhaps towards the 73.20 (S2) zone, defined by the low of the 14th of November. The RSI moved below 50, while the MACD has topped and fell below its signal line. These signs designate somewhat negative momentum and support the case for further declines in the close future. On the daily chart, the price structure is still lower highs and lower lows below both the 50- and the 200-day moving averages, thus the overall path remains to the downside, at least for now. However, I would like to see a dip below 73.20 (S2) before trusting more that trend. Such a move would confirm a forthcoming lower low and perhaps open the way for the 71.00 (S3) area, determined by the lows of July and August 2010.
• Support: 75.50 (S1), 73.20 (S2), 71.00 (S3).
• Resistance: 77.80 (R1), 80.00 (R2), 83.00 (R3).
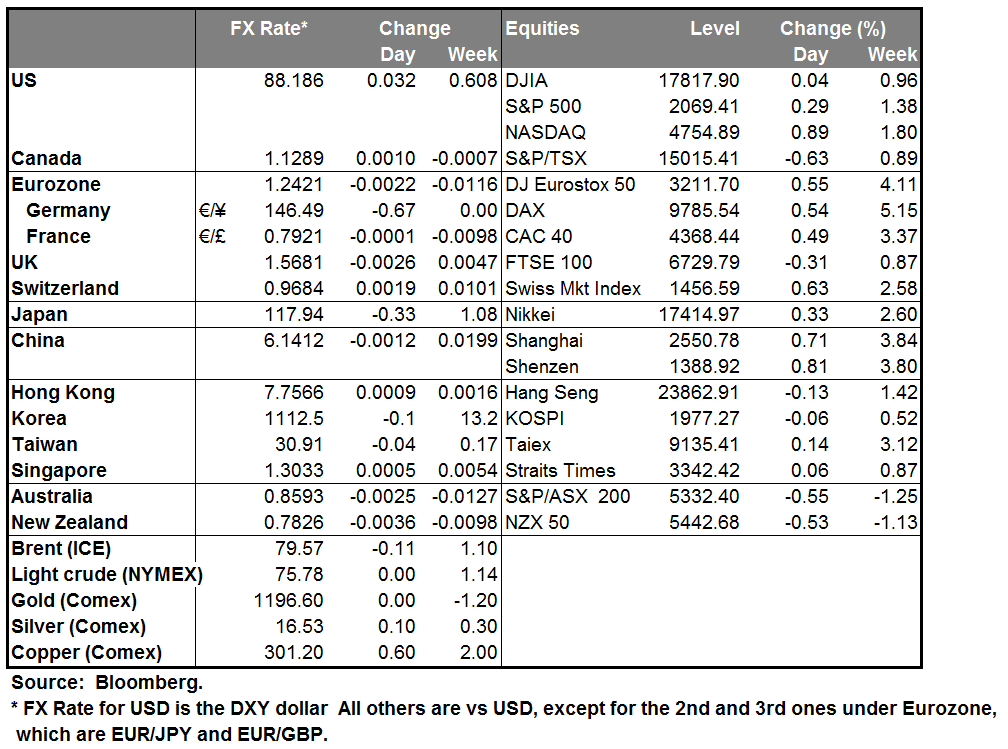
BENCHMARK CURRENCY RATES - DAILY GAINERS AND LOSERS
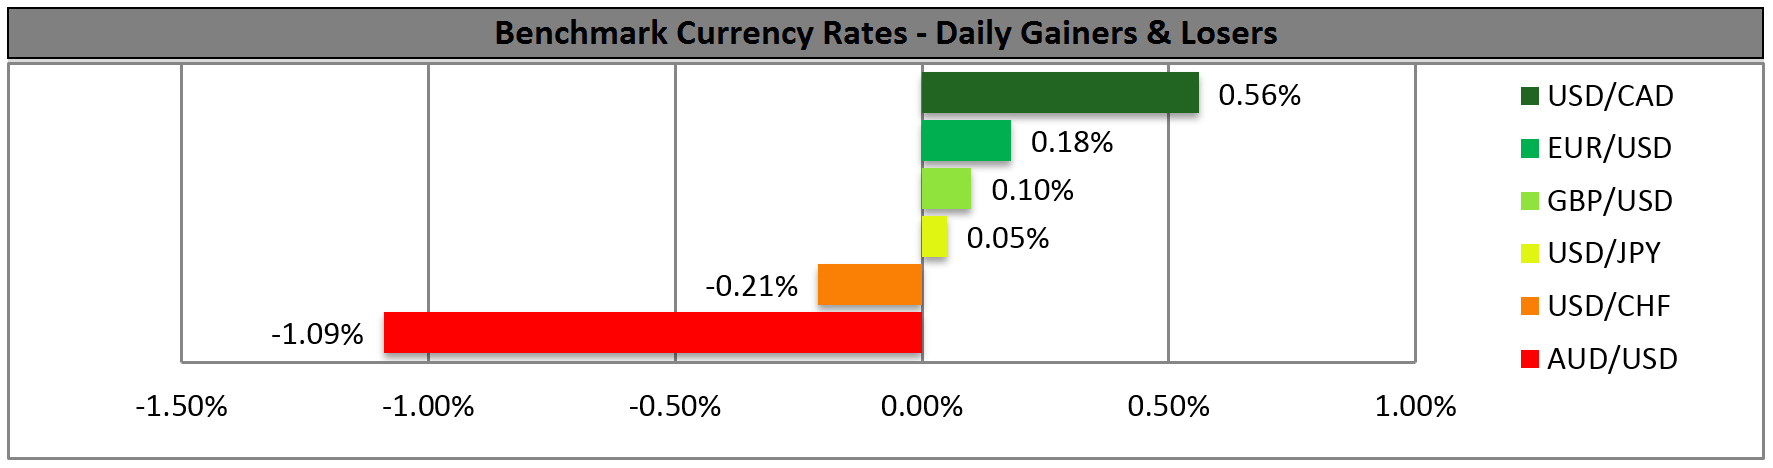
MARKETS SUMMARY