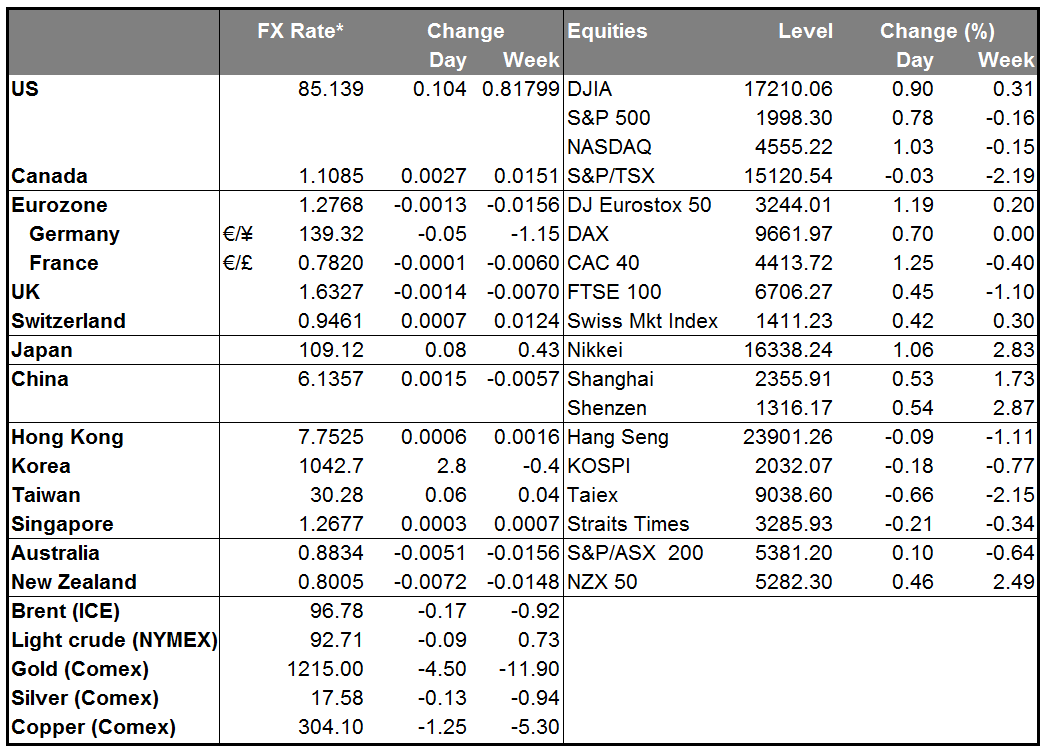
EUR/USD ready to challenge 1.2760
EUR/USD declined on Wednesday, falling below the support line (turned into resistance) of 1.2825. During the early European morning, the pair appears ready to challenge the key support area of 1.2760 (S1), defined by the lows of March and July 2013. If the bears are strong enough to overcome that strong support area, I would expect them to set the stage for further extensions, perhaps towards the low of the 13th of November 2012, at 1.2660 (S2). On the daily chart, the pair is still printing lower peaks and lower troughs, below both the 50- and the 200-day moving averages, thus I hold the view that the overall path remains to the downside.
• Support: 1.2760 (S1), 1.2660 (S2), 1.2500 (S3)
• Resistance: 1.2825 (R1), 1.2900 (R2), 1.2930 (R3)
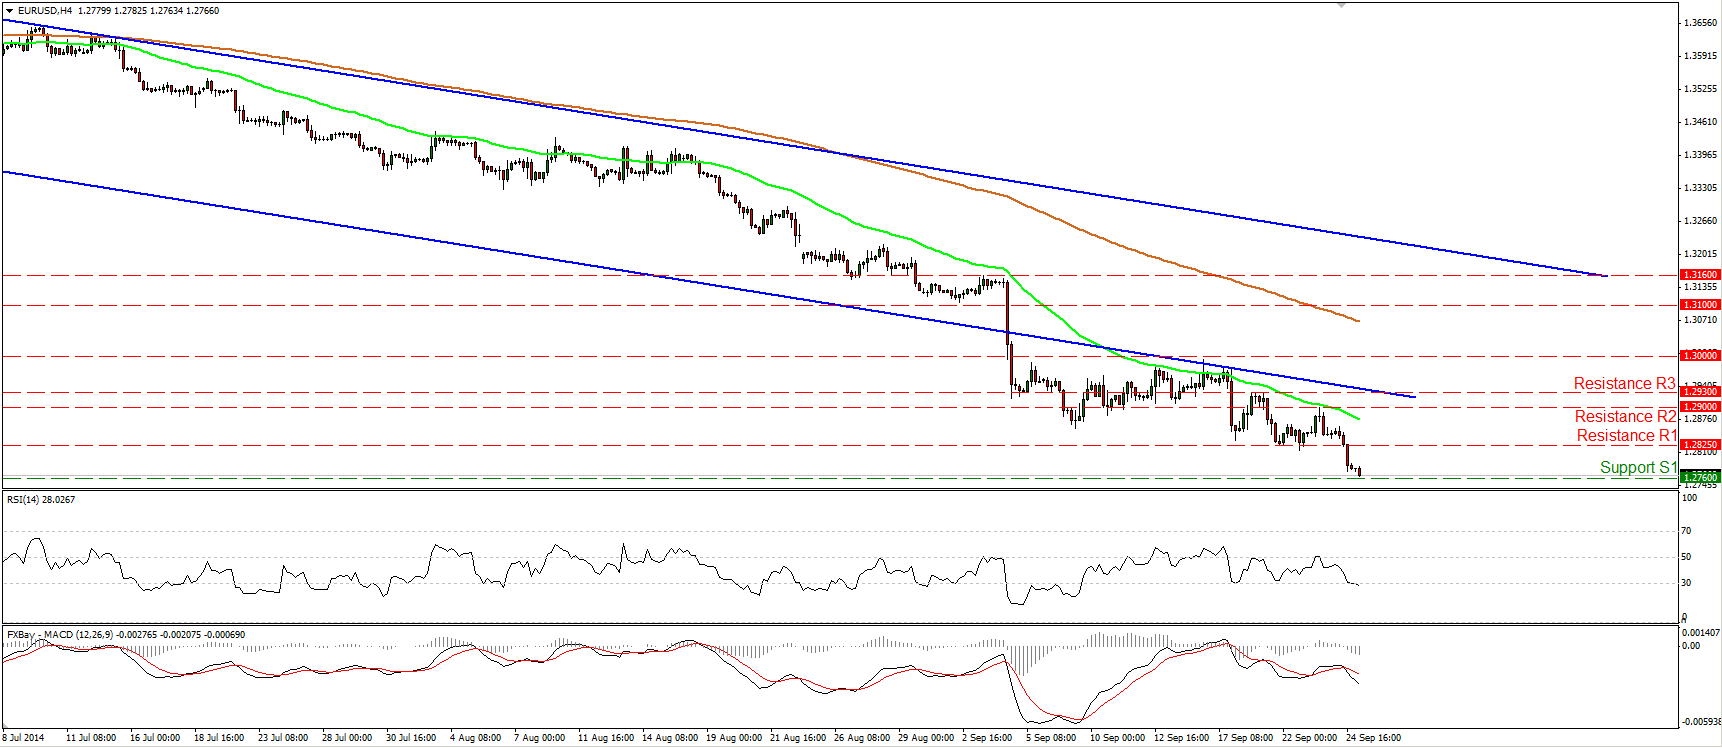
USD/JPY hits again the resistance of 109.25
USD/JPY moved higher yesterday and reached again the resistance zone of 109.25 (R1). As long as the price is trading above the blue uptrend line and above both the moving averages, I consider the near-term bias to be to the upside. A clear break above the 109.25 (R1) zone will confirm a forthcoming higher high and could probably trigger extensions towards the psychological line of 110.00 (R2). In the bigger picture, I still see a newborn long-term uptrend, since, after the exit of a triangle on the daily chart, the price structure remains higher highs and higher lows above both the 50- and the 200-day moving averages.
• Support: 108.25 (S1), 107.40 (S2), 106.80 (S3)
• Resistance: 109.25 (R1), 110.00 (R2), 110.70 (R3)
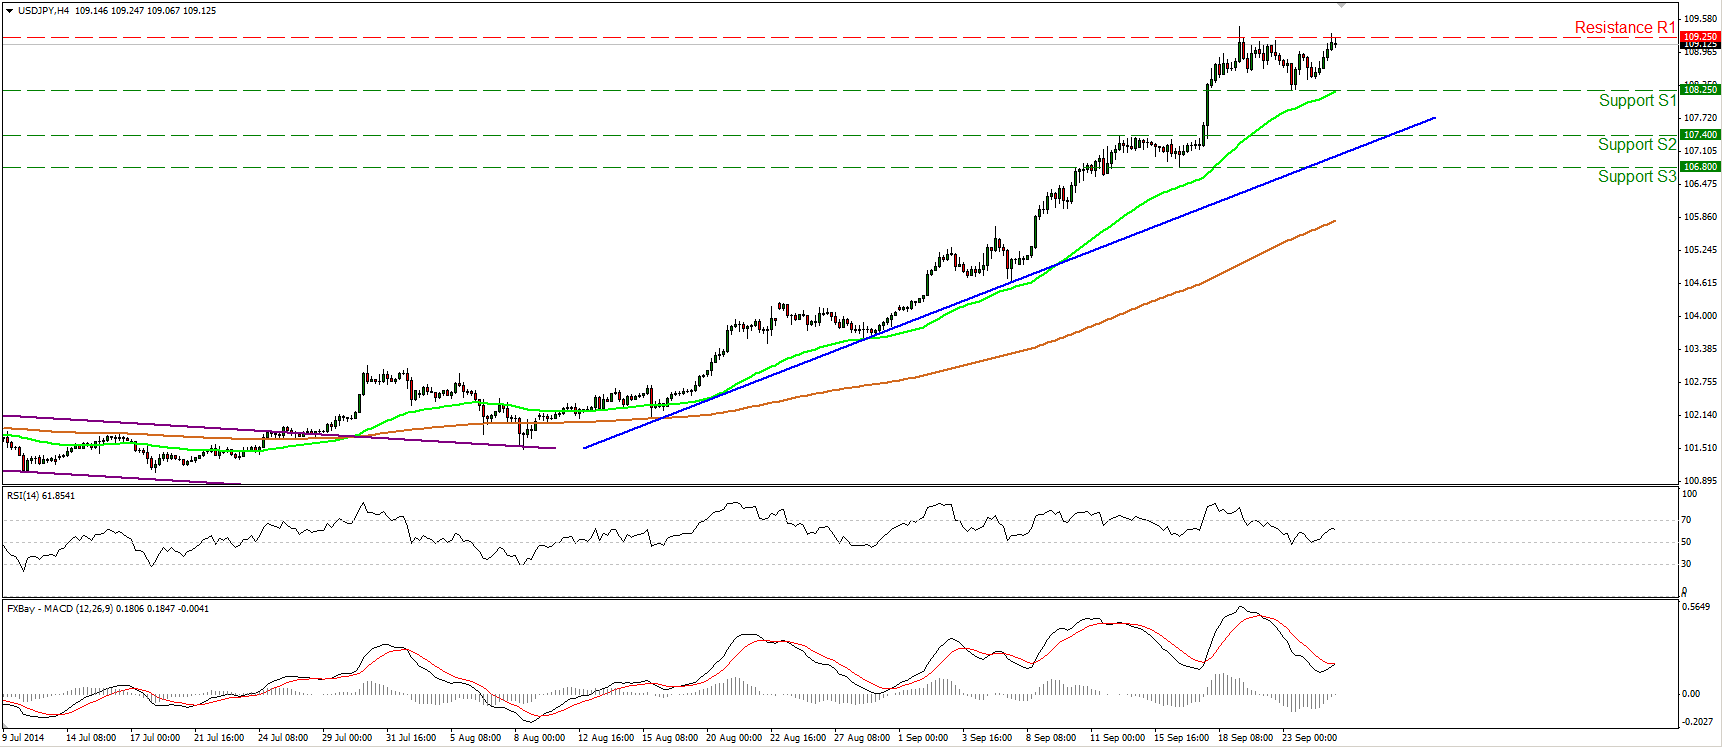
NZD/USD dips below 0.8000
NZD/USD tumbled during the Asian morning, falling below the psychological barrier of 0.8000. If the bears are strong enough to maintain the rate below that key line, I would expect them to pull the trigger for extensions towards the next support obstacle at 0.7930 (S1). Shifting our attentions to our momentum studies, the RSI crossed below its 30 line, while the MACD remains below both its zero and signal lines, pointing down. This designates accelerating bearish momentum and amplifies the case for further declines in the near future. As long as the pair is trading below the near-term blue downtrend line and below the prior longer-term uptrend line (light blue line), drawn from back at the 30th of August 2013, the overall picture remains negative, in my view.
• Support: 0.7930 (S1), 0.7850 (S2), 0.7725 (S3)
• Resistance: 0.8000 (R1), 0.8080 (R2), 0.8180 (R3)
Gold declines after finding resistance near 1225
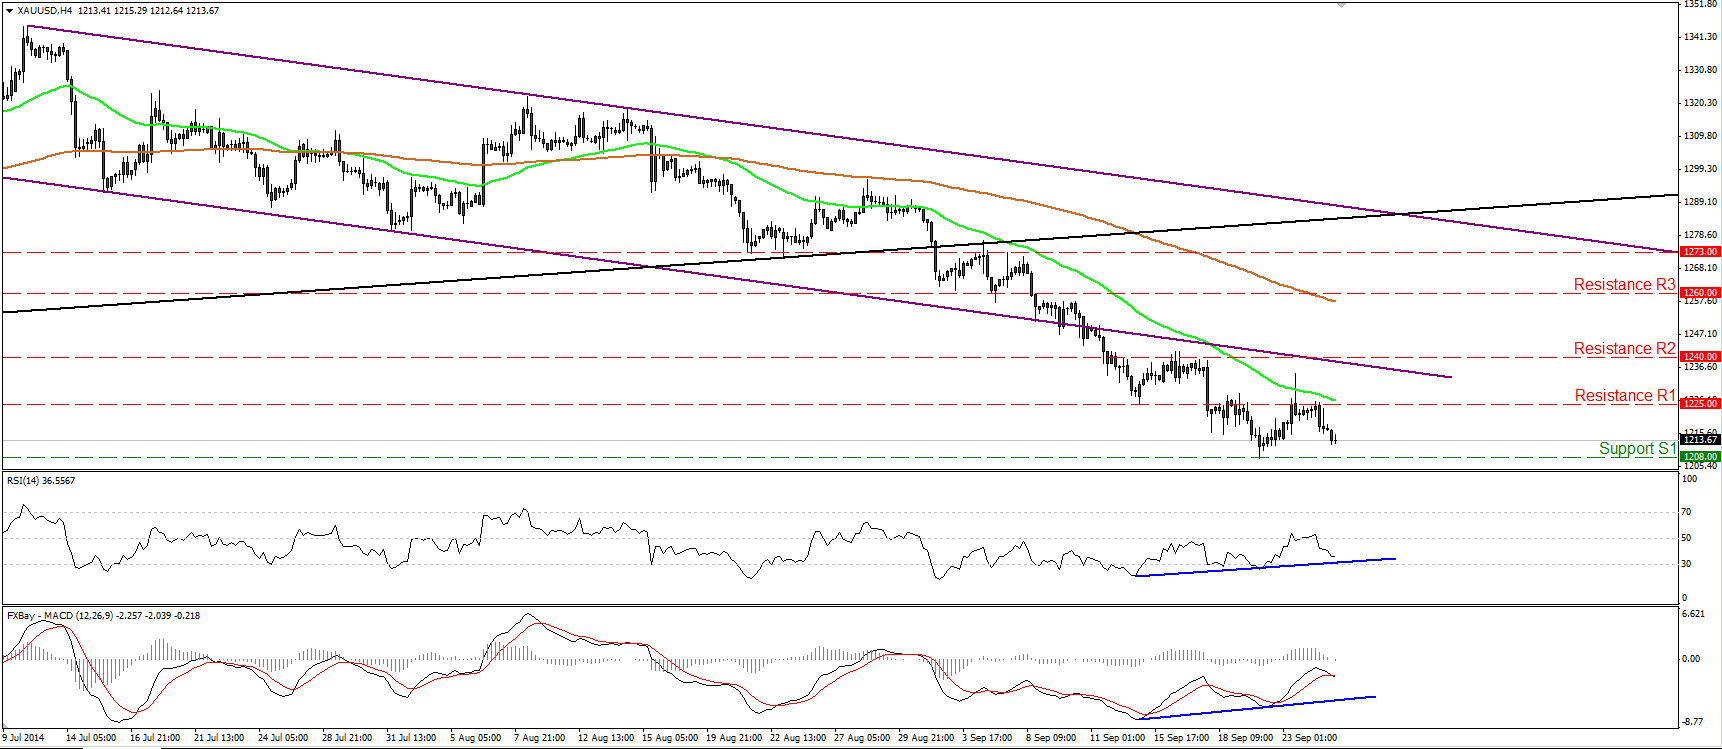
Gold declined after consolidating near the 1225 (R1) barrier. The precious metal is now trading between that resistance line and the support of 1208 (S1). Having in mind that yesterday’s move keeps the downtrend structure intact, I would expect the metal to challenge once again the 1208 (S1) line. Our momentum studies also support the notion. The RSI moved below its 50 line, while the MACD, already negative, just crossed below its trigger line. In the absence of any bullish reversal signals, but taking into consideration that we have positive divergence between the price action and our oscillators, I would see a cautiously negative technical picture. I believe that a decisive dip below the psychological line of 1200 (S2) is needed to trigger a larger leg down. Such a move could open the way for the strong support zone of 1180 (S3), determined by the lows of July and December 2013.
• Support: 1208 (S1), 1200 (S2), 1180 (S3)
• Resistance: 1225 (R1), 1240 (R2), 1260 (R3)
WTI returns back above 92.00
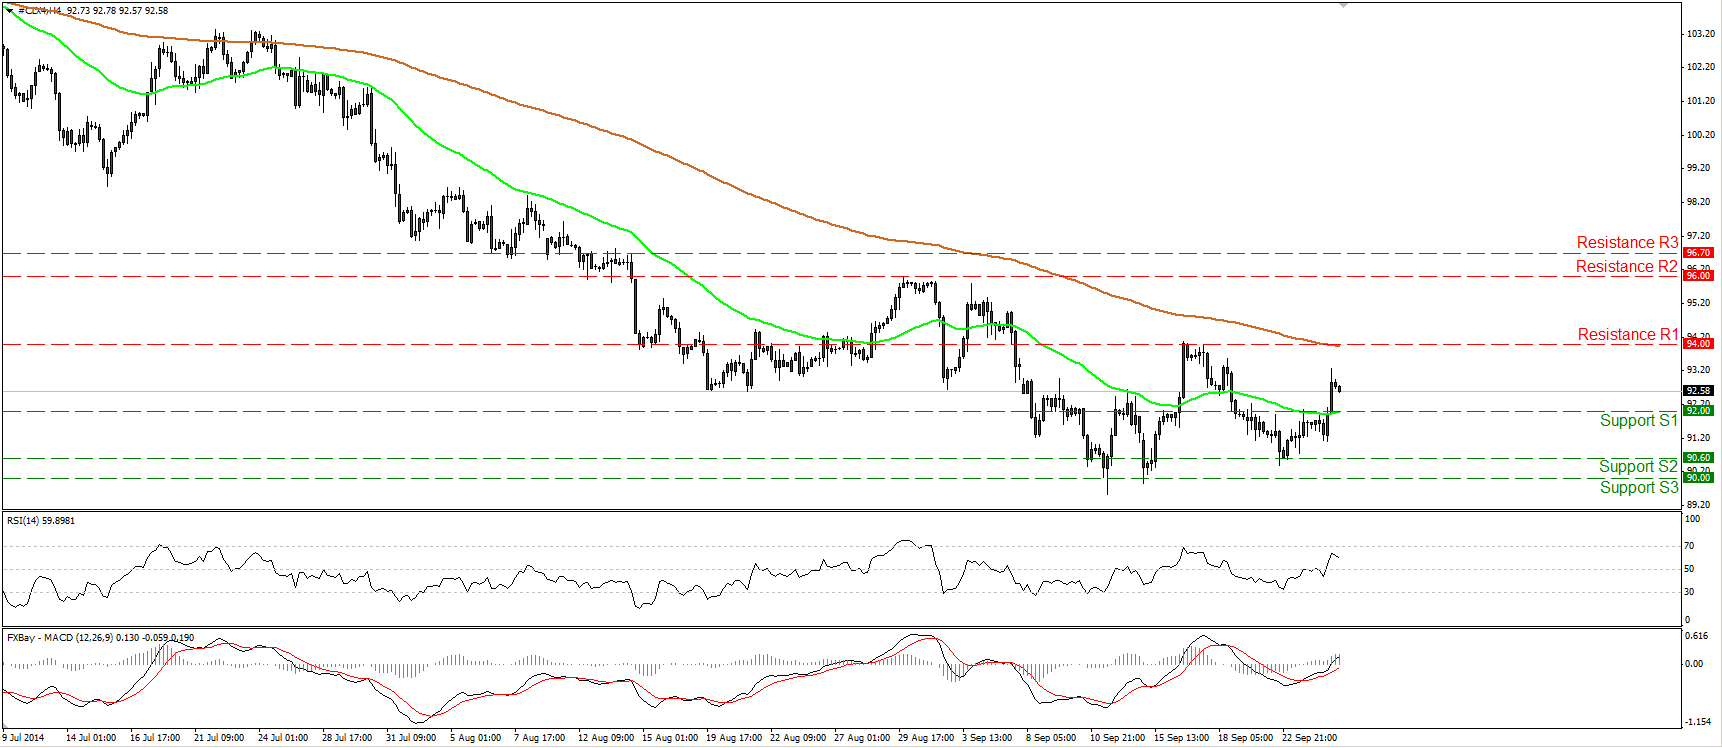
WTI moved higher on Wednesday, breaking back above the 92.00 line. However, as long as I don’t see a clear trending structure, I would prefer to maintain my “wait and see” stance. Moreover, zooming out on the daily chart, the trend remains to the downside in my view, but I still see positive divergence between both the daily oscillators and the price action. This is another reason I would prefer to stay neutral. A move above the 94.00 (R1) resistance is likely to confirm the divergence and could open the way for the next obstacle at 96.00 (R2). On the other hand, I would like to see a clear dip below the psychological level of 90.00 (S3) before getting more confident about larger declines.
• Support: 92.00 (S1), 90.60 (S2), 90.00 (S3)
• Resistance: 94.00 (R1), 96.00 (R2), 96.70 (R3)
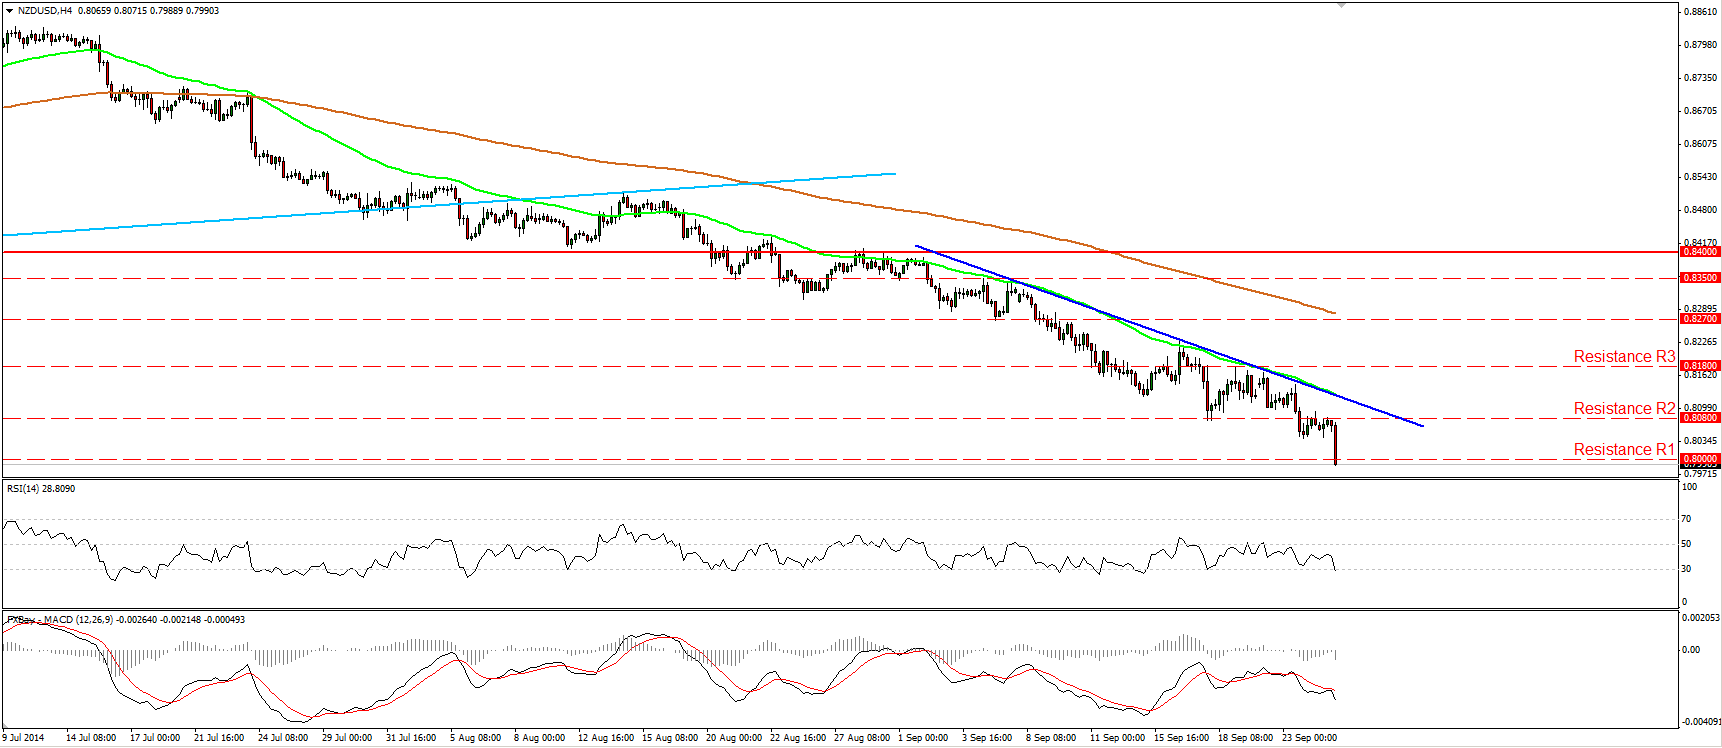
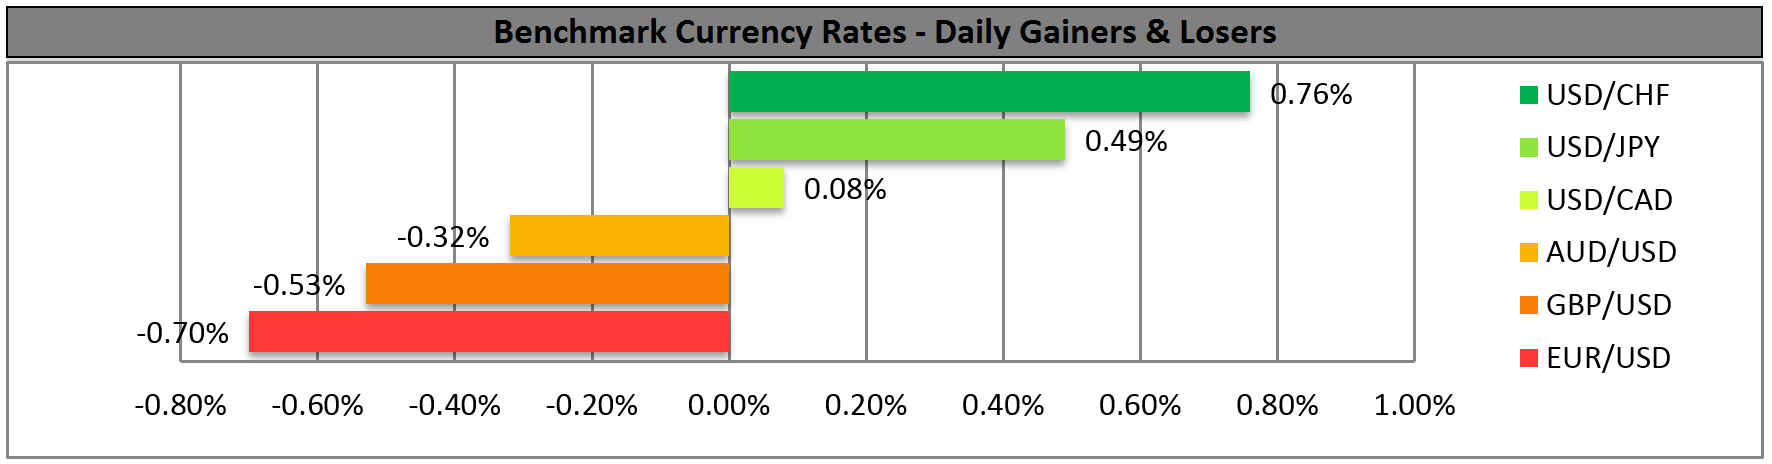
BENCHMARK CURRENCY RATES - DAILY GAINERS AND LOSERS
MARKETS SUMMARY