EUR/USD virtually unchanged
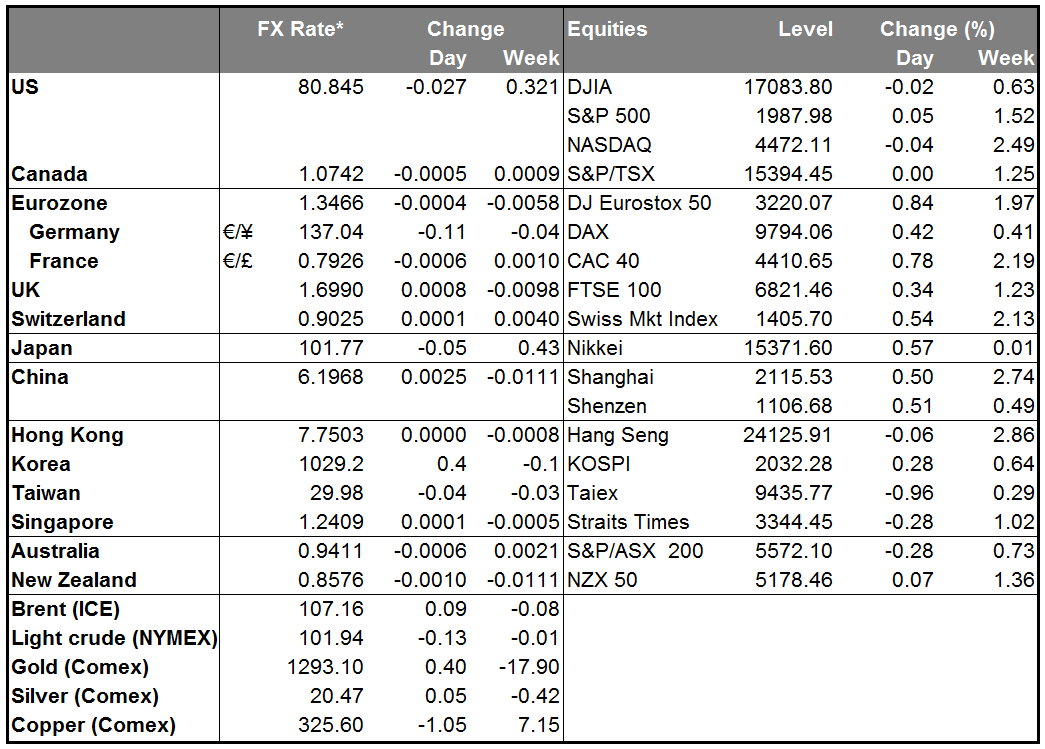
EUR/USD rebounded from 1.3435 (S1) on Thursday, but the advance was halted by 1.3485 (R1) and the pair moved lower to trade virtually unchanged. The price structure remains lower highs and lower lows below both the moving averages, while rate traded below the 1.3500 barrier for a third consecutive day. Nevertheless, although I still see a negative short-term picture, taking a look on our momentum studies I would remain to the sidelines for today. The MACD, although negative, moved above its trigger line, while the RSI exited its oversold zone and moved higher, amplifying the case for further consolidation or an upside corrective move, maybe to test the validity of the 1.3500 (R1) line as a resistance this time.
• Support: 1.3435 (S1), 1.3400 (S2), 1.3350 (S3).
• Resistance: 1.3485 (R1), 1.3500 (R2), 1.3580 (R3).
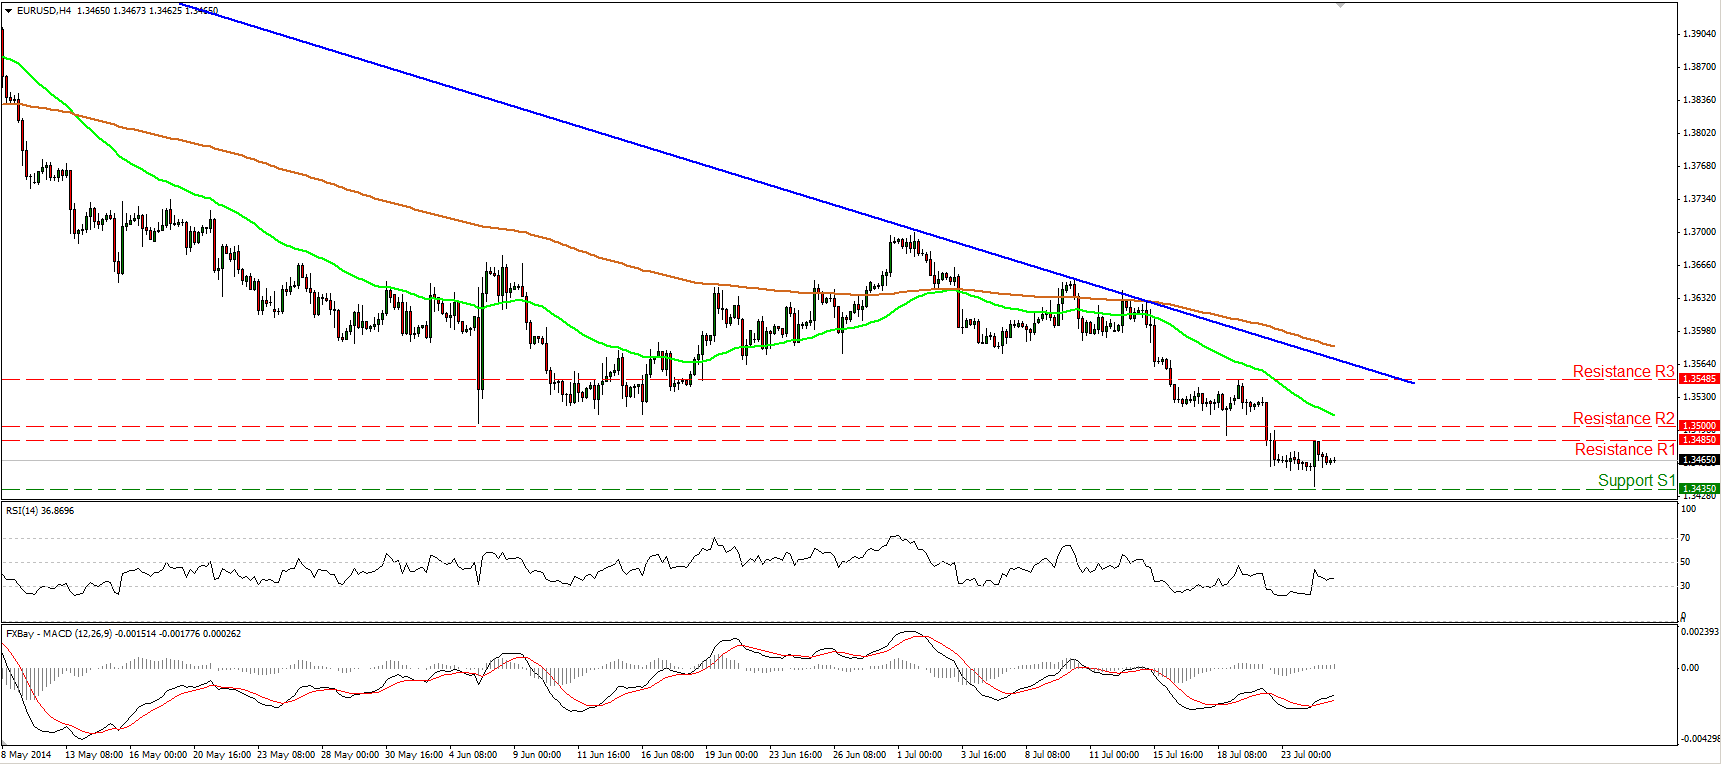
EUR/JPY rebounds from 136.40
EUR/JPY rebounded from 136.40 (S1) and at the time of writing is testing the 50-period moving average. The rate remains below the resistance of 137.35 (R1), also below the downtrend line, and this keeps the near-term downtrend intact. However, I see positive divergence between the price action and both our momentum studies, while on the daily chart I can identify a possible morning doji star formation, magnifying the case for the continuation of the upside corrective wave. I would wait for trend continuation signals before expecting the continuation of the downtrend, since in my view, is not the better time to follow it.
• Support: 136.40 (S1), 136.20 (S2), 135.50 (S3).
• Resistance: 137.35 (R1), 138.45 (R2), 138.75 (R3).
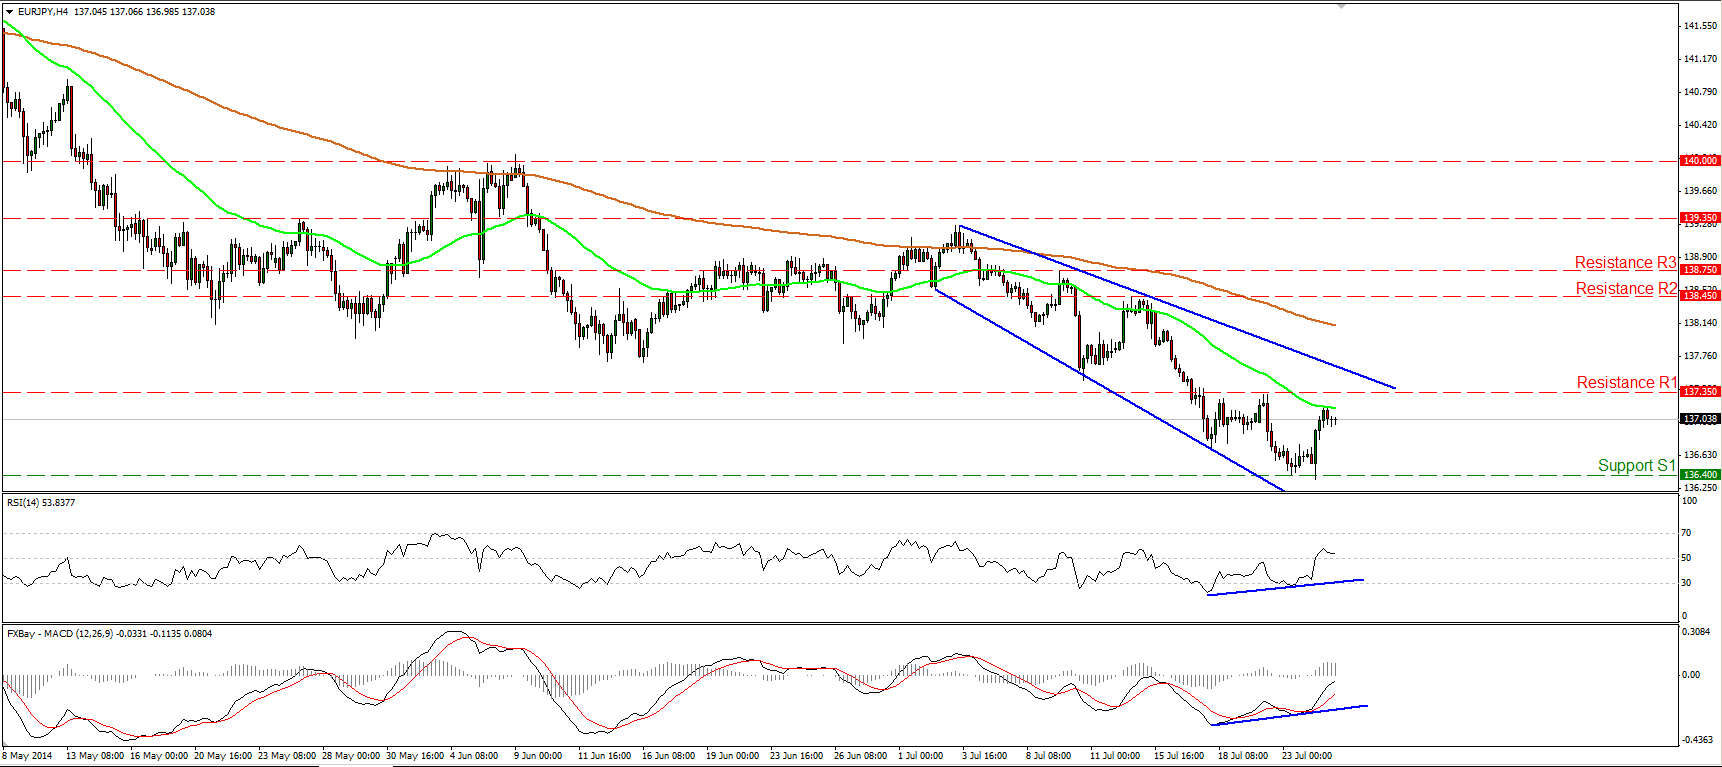
GBP/USD dips below 1.7000
GBP/USD fell below the 1.7035 barrier, which coincides with the 200-period moving average, and also dipped below the psychological barrier of 1.7000 (R1), which matches with the 32.8% retracement level of the 29th May – 15th of July advance. Yesterday’s decline confirms the signs of topping, mentioned in previous comments. Having that in mind and also considering that the rate lies within a downside channel, I would adopt a negative stance as far as the short-term trend is concerned. Nonetheless, on the daily chart, the 80-day exponential moving average continues to provide reliable support to the lows of the price action. This keeps the long-term path to the upside and as a result, I would see the near-term downtrend as a corrective phase of the major uptrend.
• Support: 1.6950 (S1), 1.6918 (S2), 1.6880 (S3).
• Resistance: 1.7000 (R1), 1.7035 (R2), 1.7100 (R3).
Gold reaches and breaks 1293
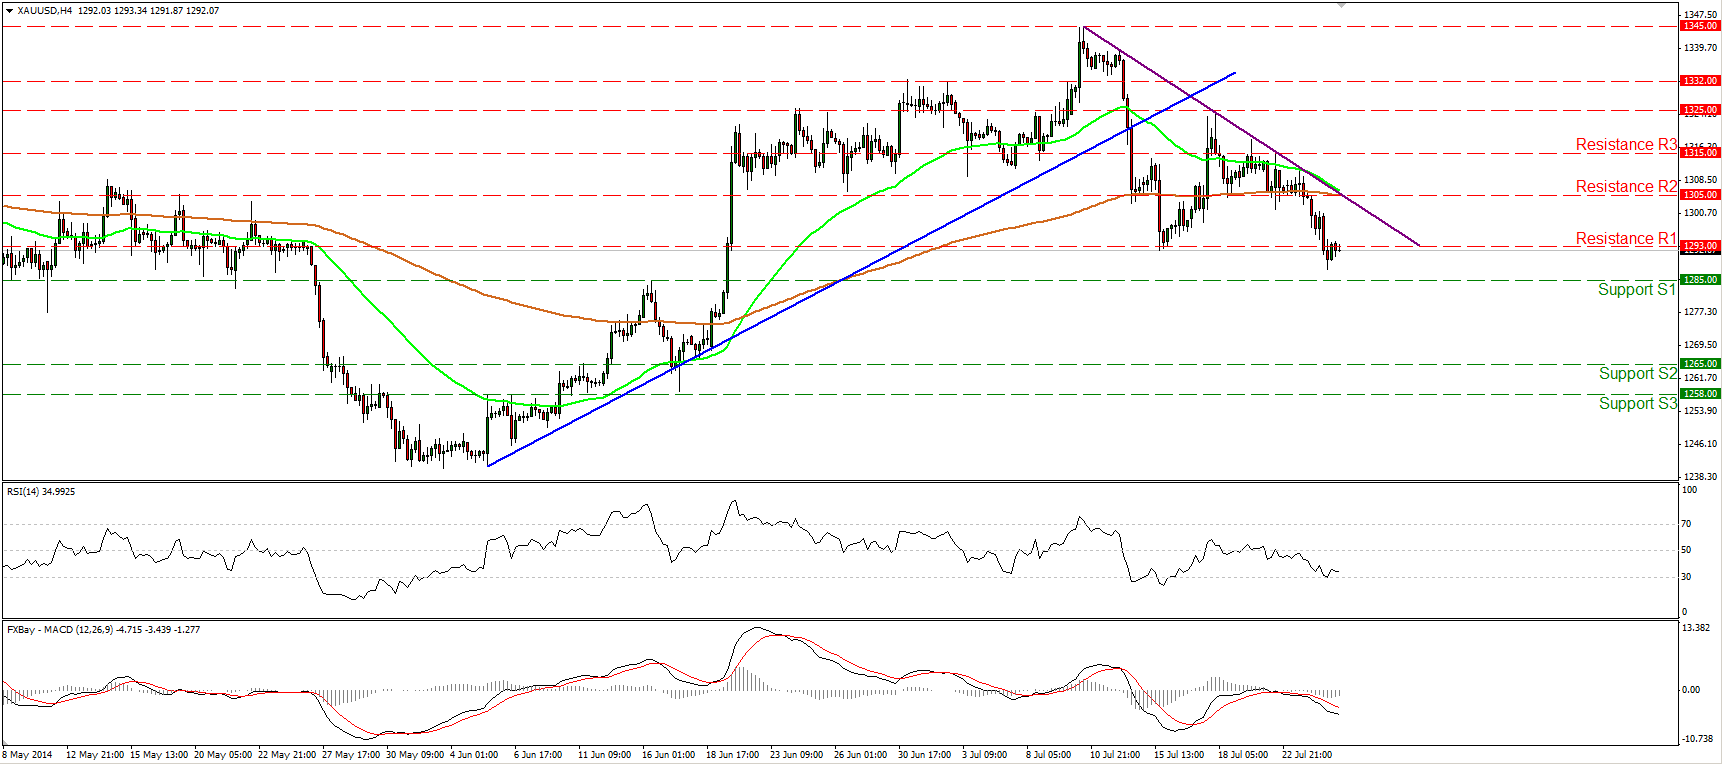
Gold continued declining, reaching the 1293 barrier, which coincides with the 50% retracement level of the 5th of June – 10th July uptrend, and breaking below it. The yellow metal is now likely to challenge the next support at 1285 (S1), where a clear break could open the way towards the 1265 (S2) zone. The MACD remains below both its zero and signal lines, indicating bearish momentum, but the RSI hit 30 and moved somewhat higher. Bearing that in mind, I cannot rule out further consolidation near the current levels before sellers regain control again.
• Support: 1285 (S1), 1265 (S2), 1258 (S3).
• Resistance: 1293 (R1), 1305 (R2), 1315 (R3).
WTI declines after finding resistance at 103.35

WTI fell sharply on Thursday after finding resistance at 103.35 (R1). The unsuccessful attempt of the bulls to overcome that barrier is worrisome and as a result I would remain flat for now. At the time of writing, the price seems ready to challenge our support barrier of 101.75 (S1), where a clear dip would confirm a forthcoming lower low and probably flip the outlook to the downside. Such a move is likely to pave the way towards our next support level at 100.70 (S2). The RSI moved below 50, while the MACD fell below its signal line, confirming yesterday’s negative momentum. Moreover, negative divergence is identified between the price action and both the momentum studies, increasing the likelihood for the dip below 101.75 (S1).
• Support: 101.75 (S1), 100.70 (S2), 98.65 (S3).
• Resistance: 103.35 (R1), 104.50 (R2), 105.45 (R3).
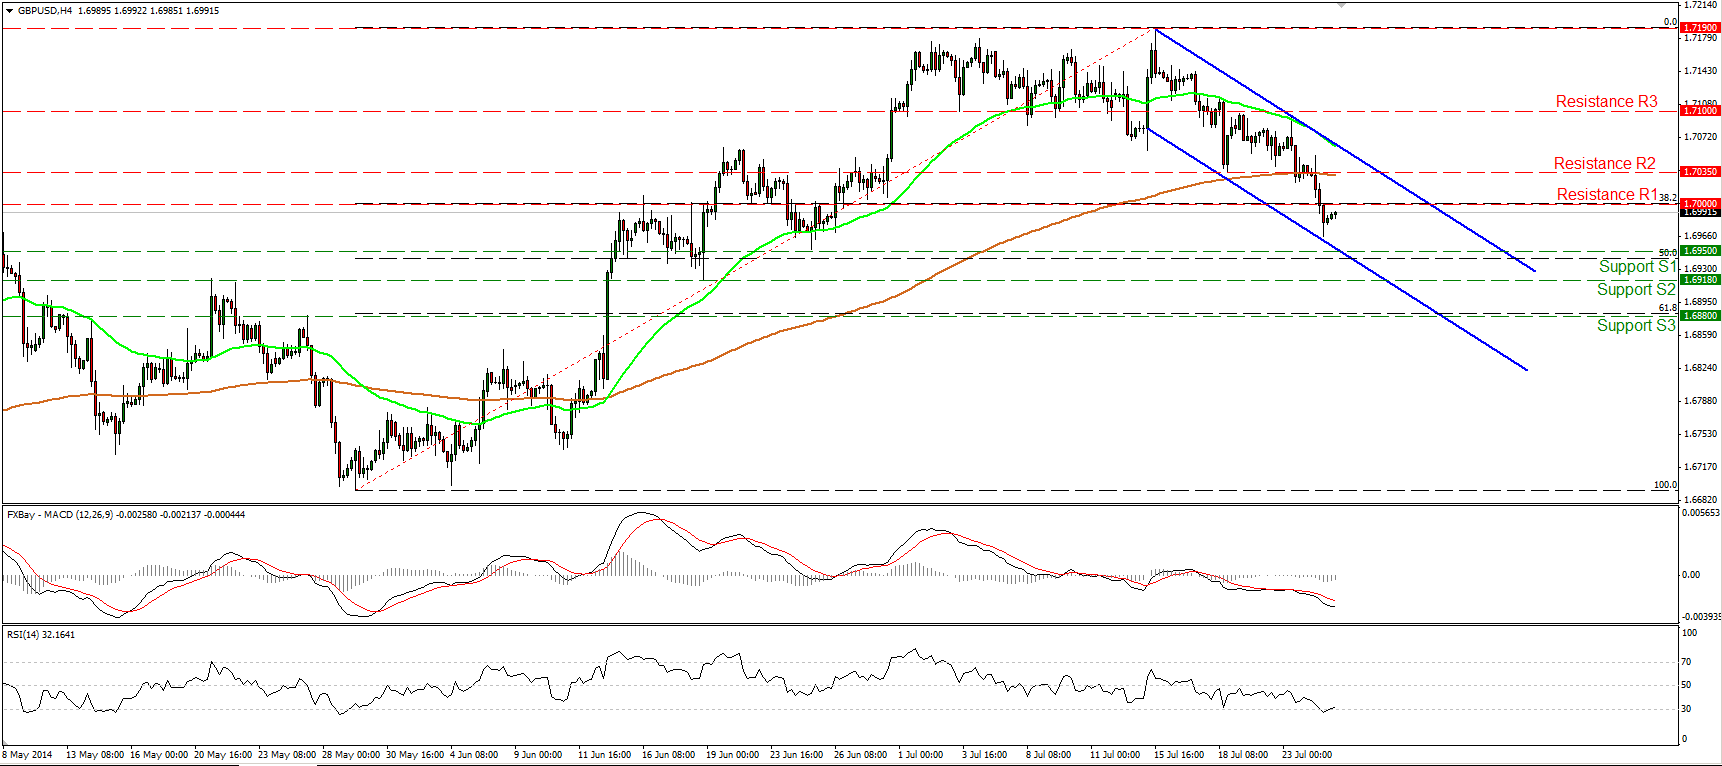
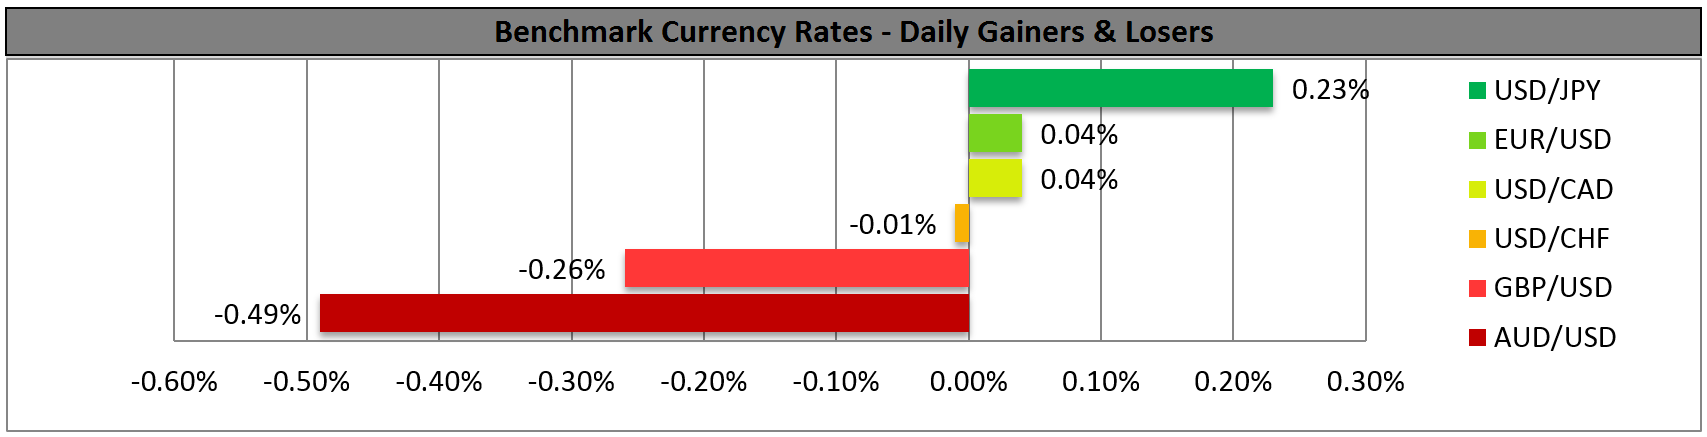
BENCHMARK CURRENCY RATES - DAILY GAINERS AND LOSERS
MARKETS SUMMARY