EUR/USD stays virtually unchanged
EUR/USD moved slightly higher on Tuesday during the European morning but after hitting 1.2900 (R1), it declined to trade virtually unchanged. On the 1-hour chart, I still see positive divergence between both of our hourly momentum studies and the price action, something that makes me believe that the rate may attempt another bounce. The notion is also supported by our daily momentum indicators. The 14-day RSI continued higher after exiting its oversold field, while the MACD remains above its signal line. However, the pair is printing lower peaks and lower troughs, below both the 50- and the 200-day moving averages, thus I hold the view that the overall path remains to the downside. I would see any possible bullish waves as corrective moves and renewed selling opportunities and I would wait for a decisive move below 1.2825 (S1) to open the way for the key zone of 1.2760 (S2).
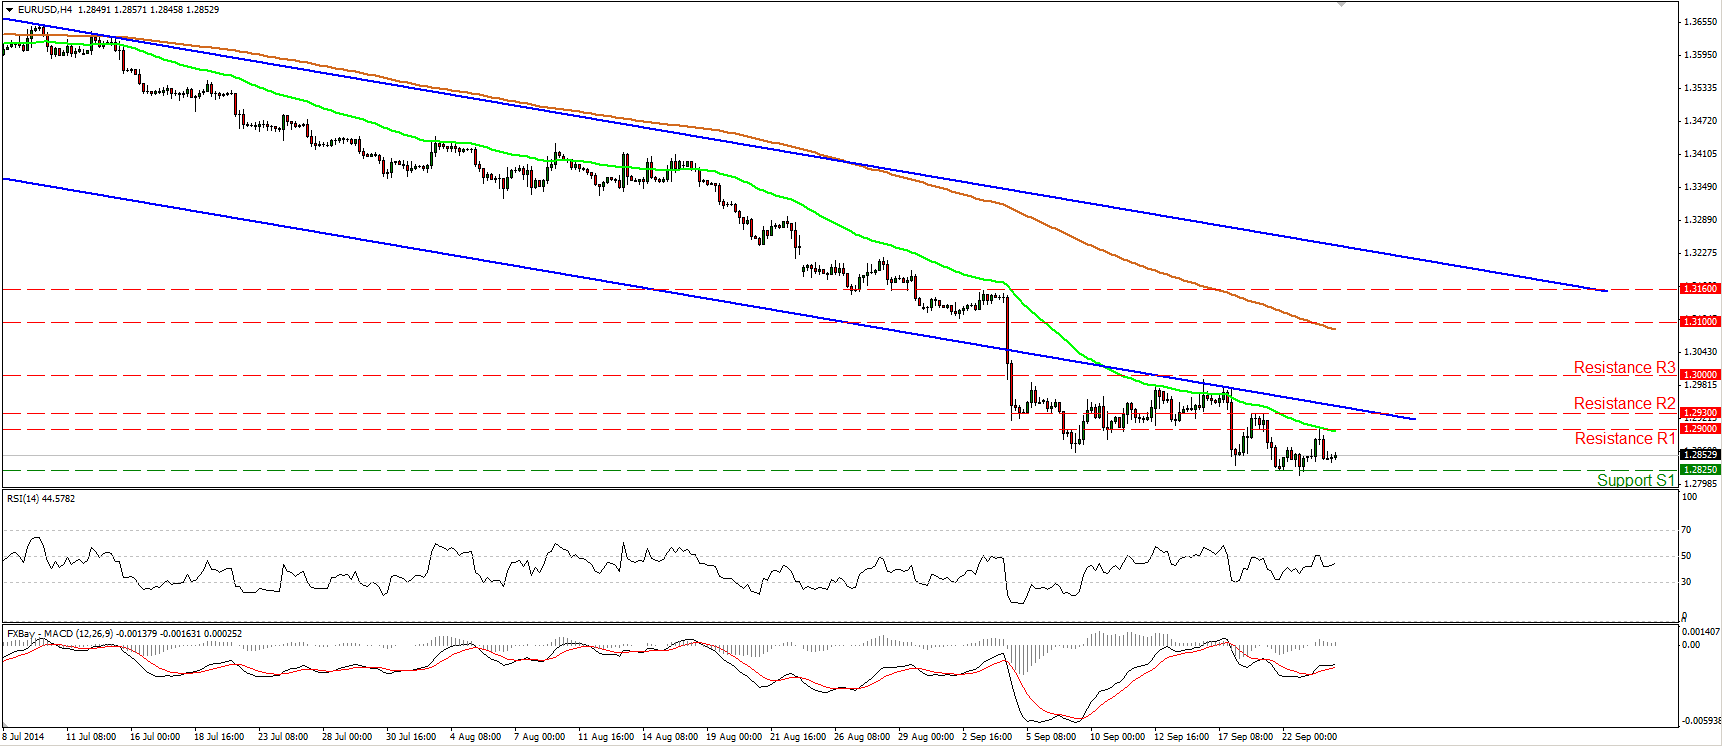
• Support: 1.2825 (S1), 1.2760 (S2), 1.2660 (S3).
• Resistance: 1.2900 (R1), 1.2930 (R2), 1.3000 (R3).
GBP/JPY finds support at 176.65
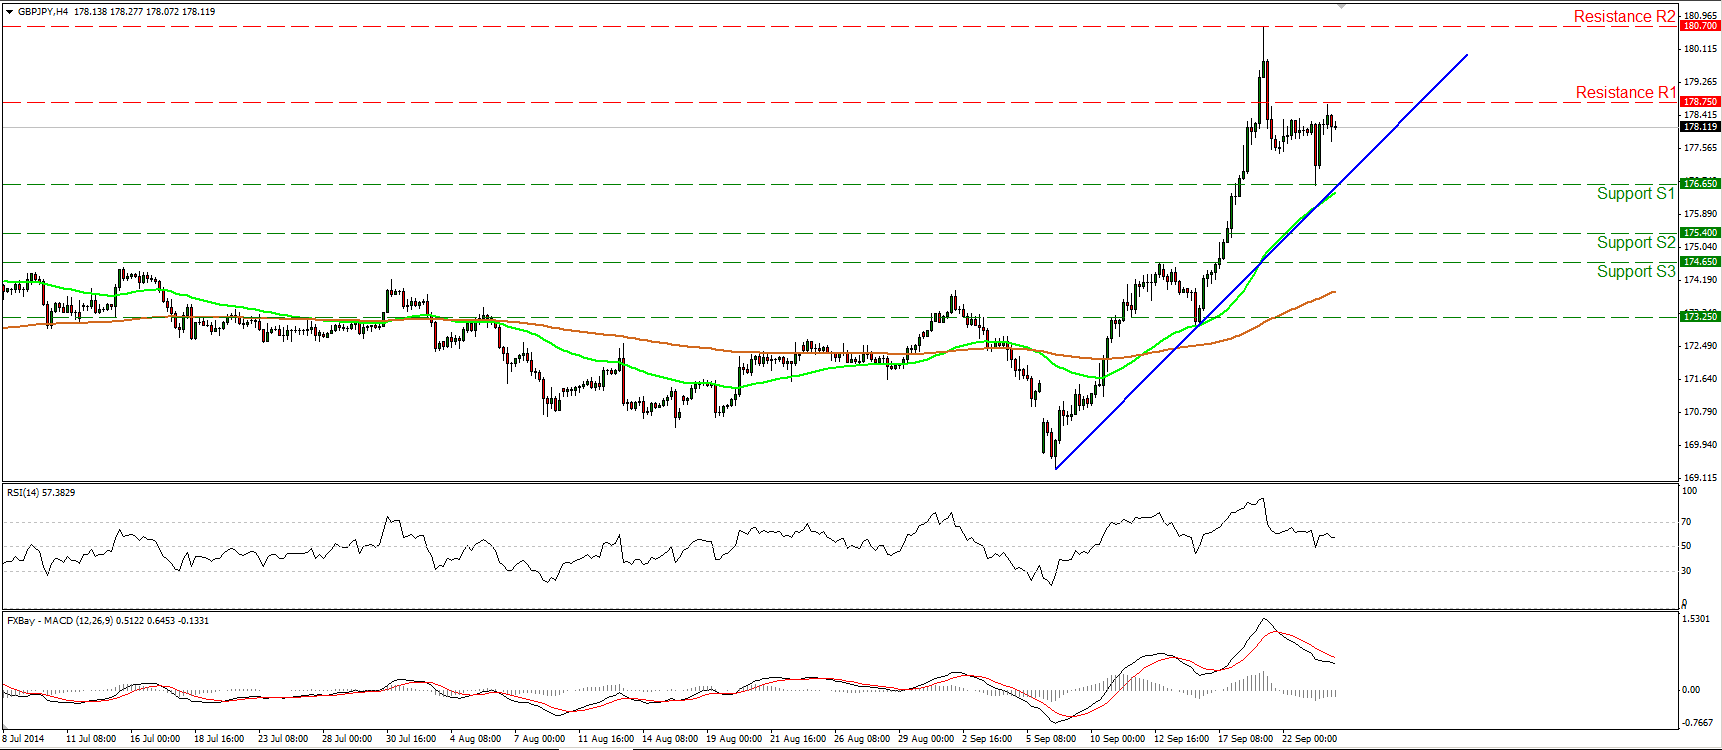
GBP/JPY moved lower on Tuesday, but triggered some buy orders near 176.65 (S1) and rebounded to find resistance at the 178.75 (R1) line. As long as the rate is trading above the near-term blue uptrend line and above both the 50- and the 200-period moving average, I consider the short-term upside path to be intact. On the daily chart, after the exit of a broadening formation, the price structure suggests an uptrend, and as a result I would expect to see the pair higher in the near future. However the 14-day RSI seems willing to exit its overbought area, thus I would be cautious of another pullback before the bulls take control again.
• Support: 176.65 (S1), 175.40 (S2), 174.65 (S3).
• Resistance: 178.75 (R1), 180.70 (R2), 181.00 (R3).
AUD/USD finds support near 0.8835
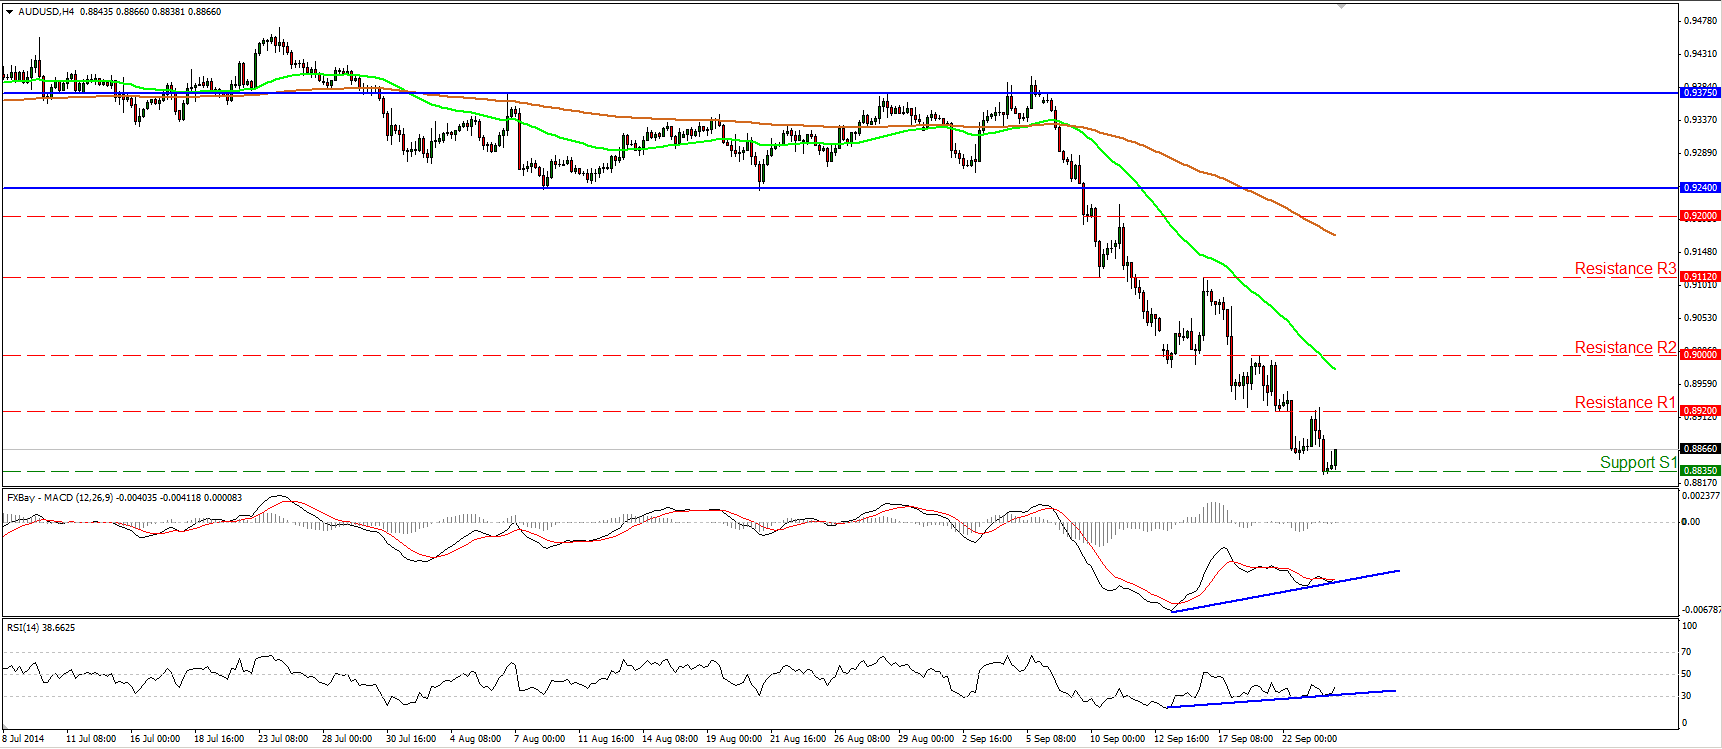
AUD/USD continued declining and managed to reach our support line of 0.8835 (S1). Although the near-term downtrend remains intact, I believe that now is the time to take the sidelines. The reason is that I see positive divergence between both our momentum indicators and the price action. This indicates that the downtrend is running out of momentum and increases the possibilities for the beginning of an upside corrective phase. Moreover, on the daily chart, the RSI is pointing up and appears willing to move above its 30 line. This is another reason I would be watchful of a possible corrective move. I prefer to see a clear dip below 0.8835 (S1), before regaining my confidence on the downtrend. Such a dip is likely to open the way for the support line of 0.8730 (S2).
• Support: 0.8835 (S1), 0.8730 (S2), 0.8660 (S3).
• Resistance: 0.8920 (R1), 0.9000 (R2), 0.9112 (R3).
Gold fails to close above 1225
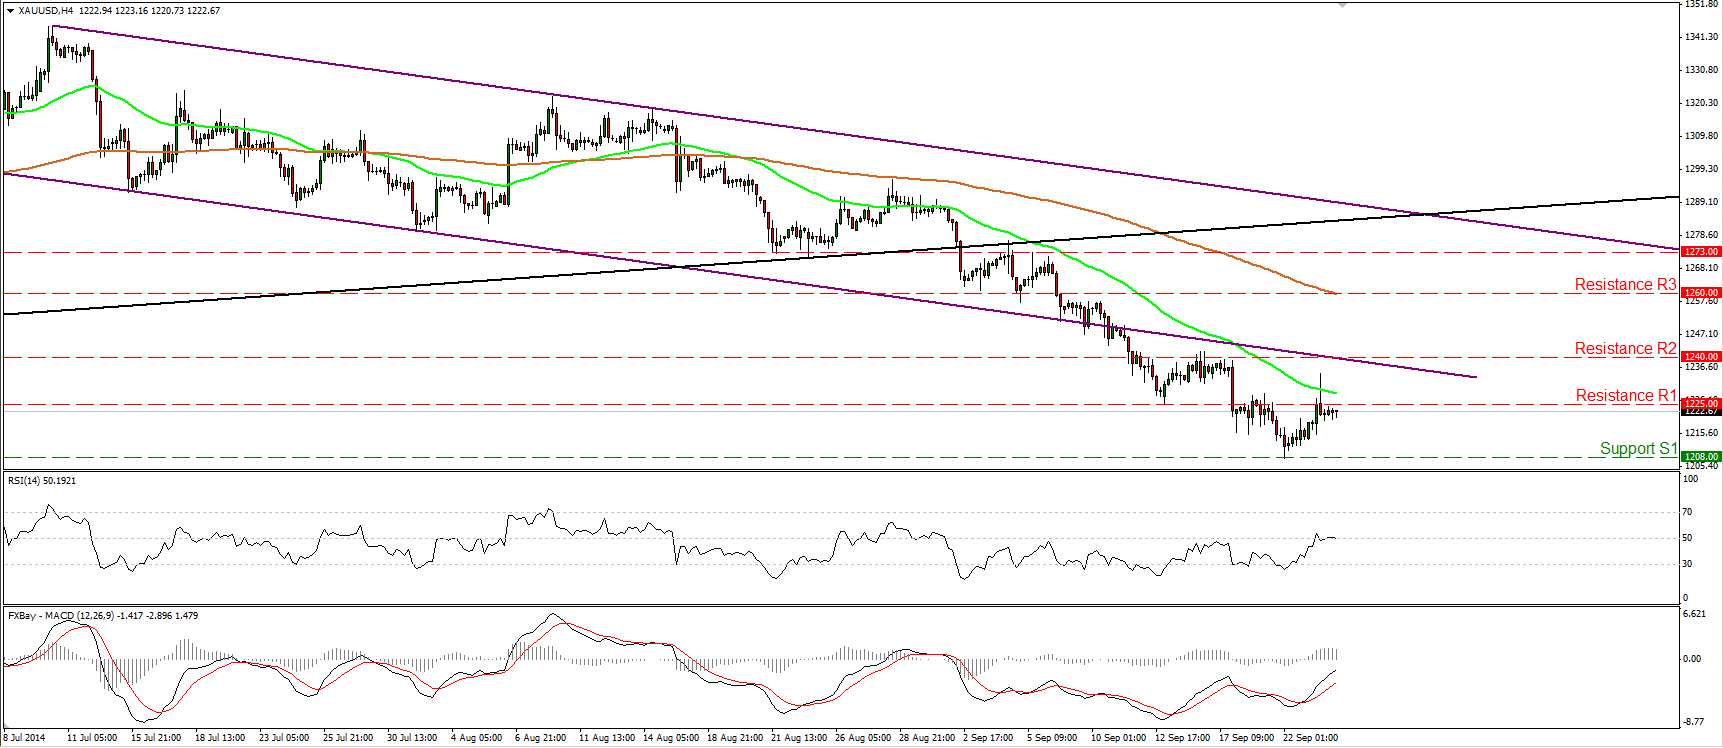
Gold continued moving higher yesterday and tried to rally above the 1225 (R1) line. However, the precious metal gave its gains back and returned to trade marginally below the 1225 (R1) barrier again. Although the aforementioned move hasn’t changed the downtrend structure, I would like to take the sidelines for now since our momentum studies do not provide negative indications at the moment. The RSI lies near its neutral line, while the MACD, although negative, lies above its trigger and is pointing up. Moreover, on the daily chart, the 14-day RSI exited its oversold zone, while the daily MACD appears willing to move above its signal line. This is another reason I would prefer to remain neutral and wait for price action and momentum studies to confirm each other.
• Support: 1208 (S1), 1200 (S2), 1180 (S3).
• Resistance: 1225 (R1), 1240 (R2), 1260 (R3).
WTI rebounds from 90.60

WTI found support at 90.60 and moved slightly higher. As long as I don’t see a clear trending structure, I would prefer to stay flat. Our momentum studies also support my choice. The RSI found resistance at its 50 line and moved lower, while the MACD crossed above its signal line. Moreover, zooming out on the daily chart, the trend remains to the downside in my view, but I still see positive divergence between both the daily oscillators and the price action. As a result, I would retain my “wait and see” stance as far as the overall picture of oil is concerned and I would like to see a clear dip below the psychological level of 90.00 (S2) before getting more confident about larger declines.
• Support: 90.60 (S1), 90.00 (S2), 87.65 (S3).
• Resistance: 92.50 (R1), 94.00 (R2), 96.00 (R3) .
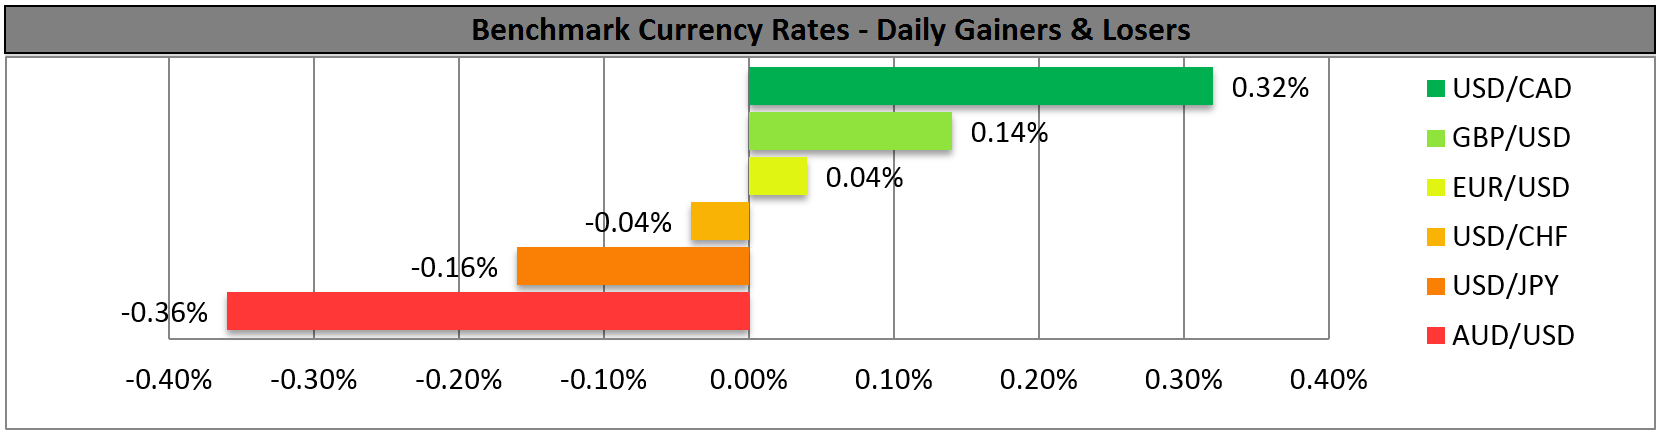
BENCHMARK CURRENCY RATES - DAILY GAINERS AND LOSERS
MARKETS SUMMARY