
EUR/USD ahead of Eurozone’s PMIs
EUR/USD moved in a consolidative mode on Wednesday ahead of Eurozone’s preliminary PMI data for July. The rate remains slightly below the lows of February at 1.3475 (R1) with the euro-area PMIs, coming out later in the day, expected to show a modest decline. This could cause the bears to regain momentum and push the pair lower, perhaps towards the support zone of 1.3400 (S1), marked by the low of the 21st of November. As long as EUR/USD remains below both the moving averages and the 1.3500 (R1) key resistance holds, I see a negative near-term picture. On the daily chart, the 50-day moving average is still touching the 200-day one and a bearish cross in the near future will add to the negative outlook of the pair.
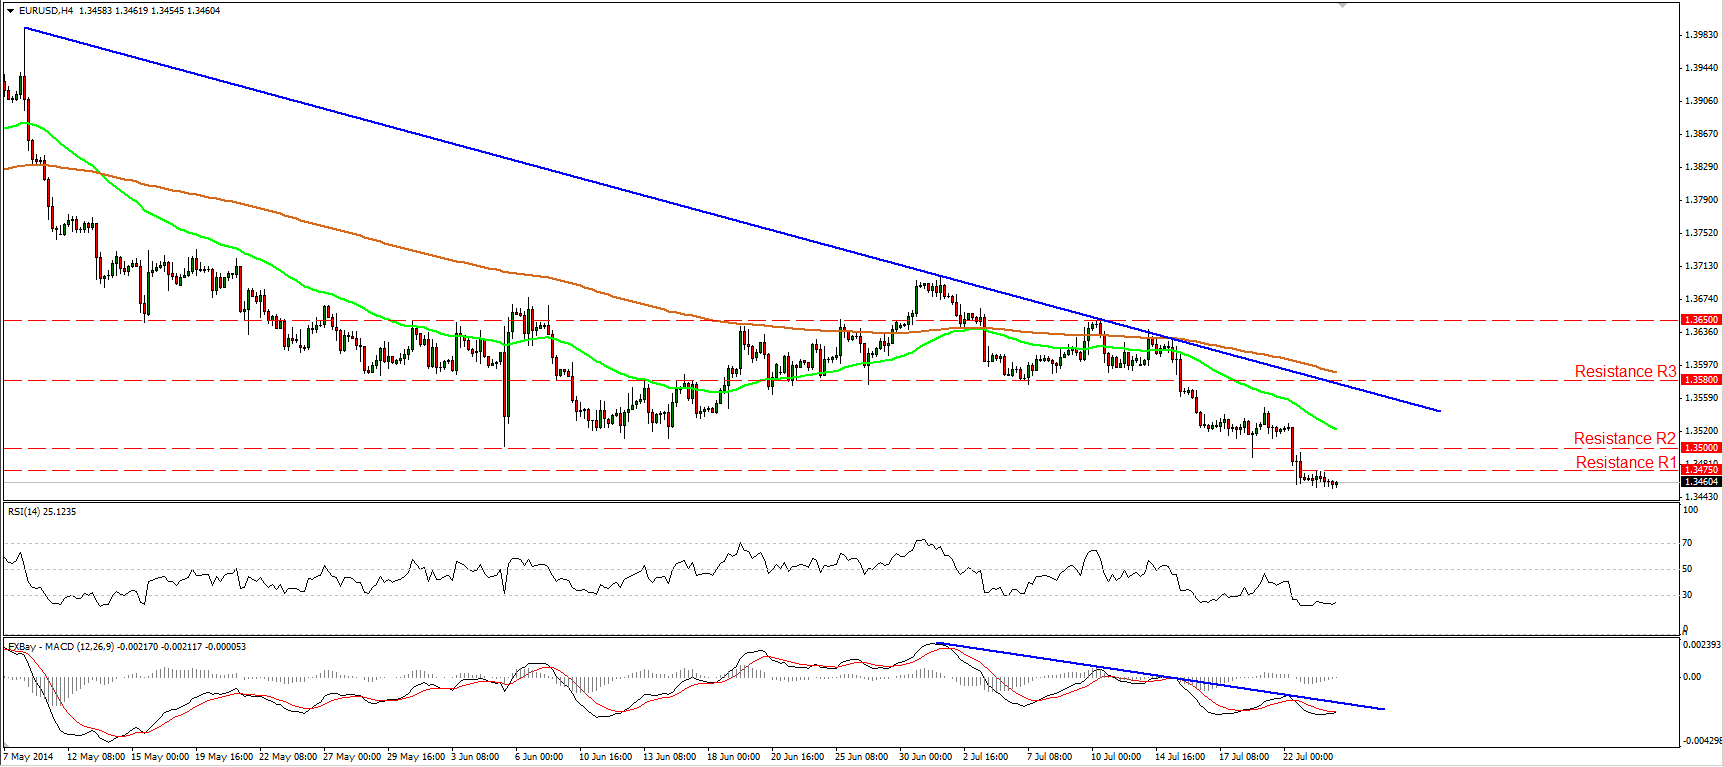
• Support: 1.3400 (S1), 1.3300 (S2), 1.3250 (S3)
• Resistance: 1.3475 (R1), 1.3500 (R2), 1.3580 (R3)
USD/JPY ready to challenge 101.60
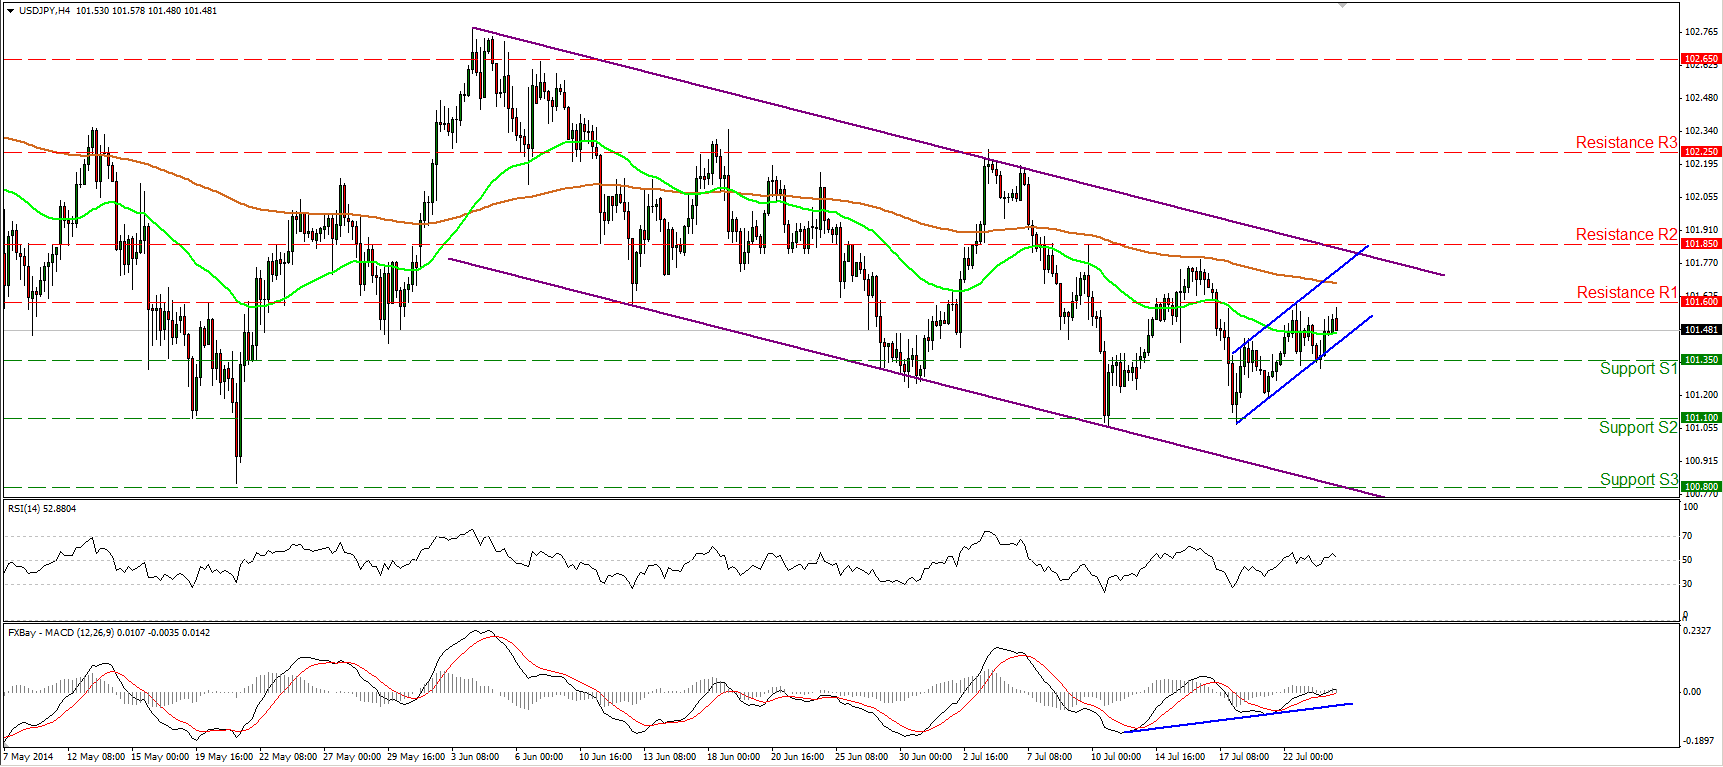
USD/JPY rebounded from 101.35 (R1) and at the time of writing is heading towards the resistance of 101.60 (R1). I still expect the bulls to find the strength to overcome that barrier and drive the rate up to the 101.85 (R2), zone, near the crossroad of the upper bound of the purple channel and the upper boundary of the minor-term upside blue channel. Even though I expect the upside wave to continue, the overall short-term picture of the pair remains to the downside, since the rate is still trading within the purple downside channel. Bearing that in mind, I would see any upside waves within the channel as corrective waves.
• Support: 101.35 (S1), 101.10 (S2), 100.80 (S3)
• Resistance: 101.60 (R1), 101.85 (R2), 102.25 (R3)
EUR/GBP rebounds from 0.7875
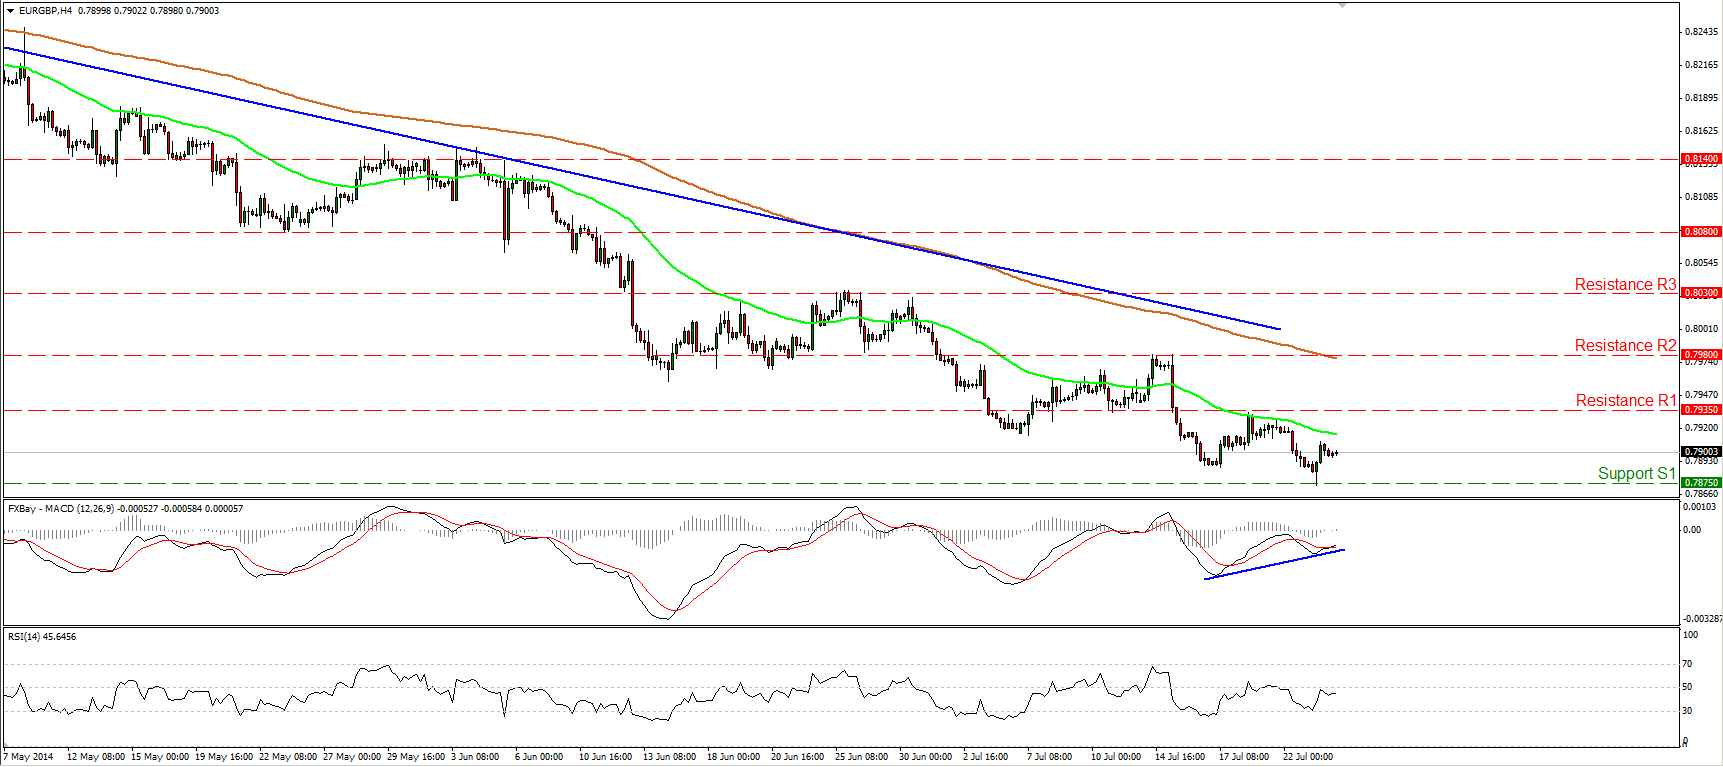
EUR/GBP moved slightly higher yesterday, after finding support near the 0.7875 (S1) zone. Although the overall trend remains to the downside (marked by the downtrend line drawn from back the 11th of April), I see negative divergence between the MACD and the price action, indicating the lack of the necessary bearish momentum, at least for now. Also, bearing in mind that the indicator crossed above its signal line and is now pointing up, I cannot rule out the continuation of the upside corrective wave, perhaps towards the resistance of 0.7935 (R1). On the daily chart, I see negative divergence between the price action and both the daily MACD and the 14-day RSI, corroborating my view that the downtrend is the best to rely on.
• Support: 0.7875 (S1), 0.7815 (S2), 0.7755 (S3)
• Resistance: 0.7935 (R1), 0.7980 (R2), 0.8030 (R3)
Gold below 1300 again

Gold declined significantly, falling below the 1305 barrier (support turned into resistance) and the 200-period moving average. The yellow metal is likely to challenge the 1293 (S1) support level, which coincides with the 50% retracement level of the 5th of June – 10th July uptrend. In my view, the price has the necessary momentum to challenge that barrier since the RSI has further to go before signaling oversold conditions, while the MACD left its neutral line and also dipped below its signal line. A clear break below 1293 (S1) could pave the way towards the next obstacle at 1285 (S2), slightly above the 61.8% retracement level of the aforementioned uptrend.
• Support: 1293 (S1), 1285 (S2), 1265 (S3)
• Resistance: 1305 (R1), 1315 (R2), 1325 (R3)
WTI rebounds as stockpiles decline
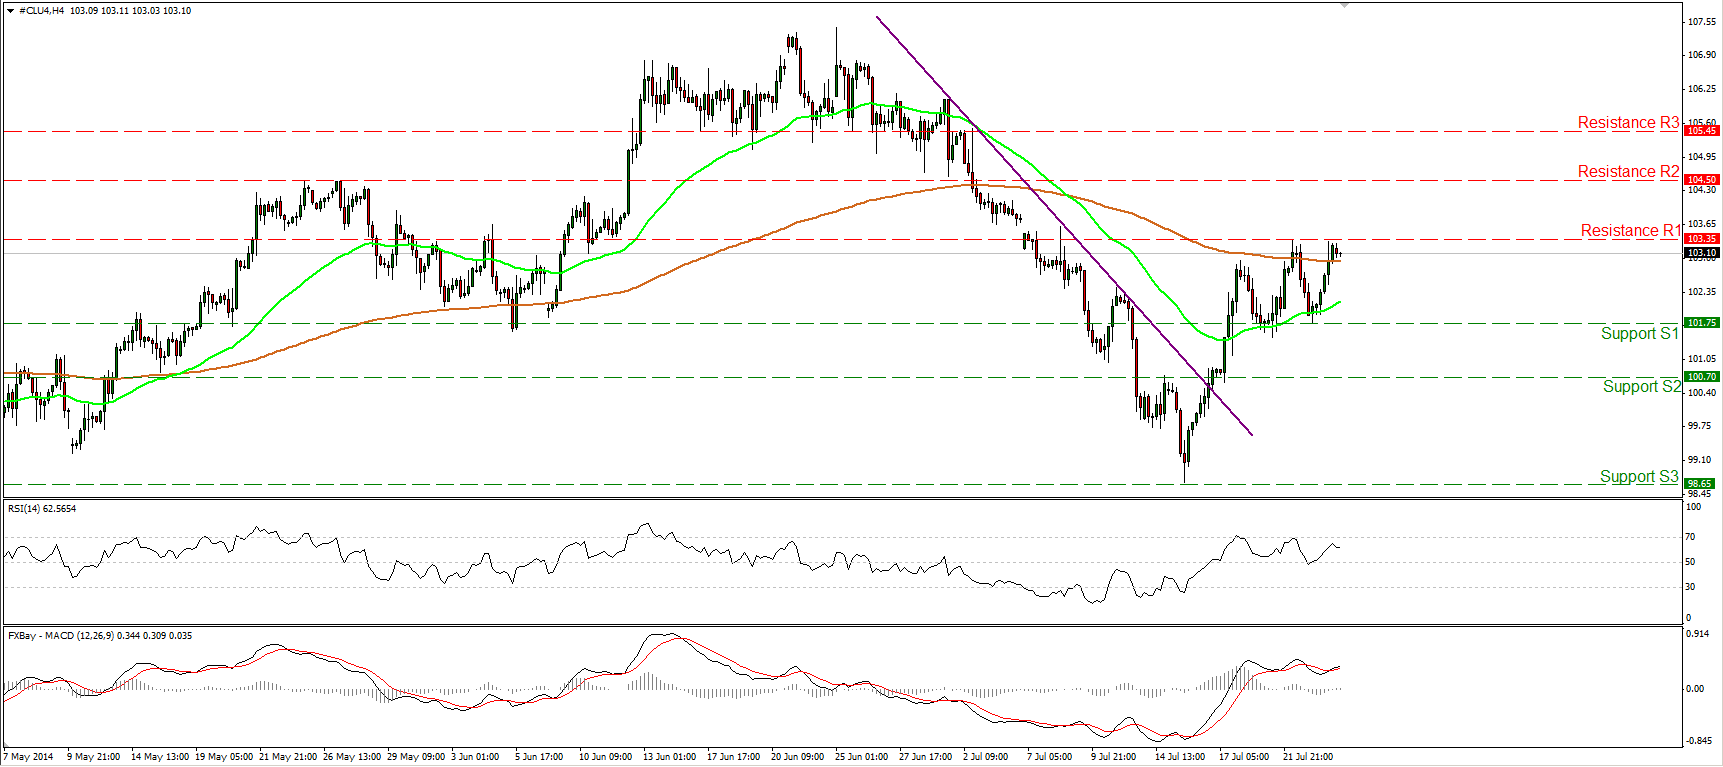
WTI rebounded from 101.75 (S1) yesterday and edged higher after the EIA reported that US crude oil inventories declined by 4.0mn barrels in the week ended on July 18, below estimates of a 2.8mn decline. The price is now testing the resistance marked by the prior high, at 103.35 (R1), where a decisive break could reinforce the near-term uptrend and target the next resistance level at 104.50 (R2). The RSI rebounded from its 50 level and moved higher, while the MACD, already in its positive field, crossed above its signal line, confirming yesterday’s bullish momentum.
• Support: 101.75 (S1), 100.70 (S2), 98.65 (S3)
• Resistance: 103.35 (R1), 104.50 (R2), 105.45 (R3)
BENCHMARK CURRENCY RATES - DAILY GAINERS AND LOSERS

MARKETS SUMMARY
