EUR/USD consolidates near 1.2825
EUR/USD moved in a consolidative mode, remaining slightly above the support line of 1.2825 (S1). Zooming in on the 1-hour chart, I still see positive divergence between both of our hourly momentum studies and the price action, which makes me believe that we may see the pair rebounding somewhat. The notion is also supported by our daily momentum indicators. The 14-day RSI moved higher and exited its oversold field, while the MACD crossed above its signal line. However, bearing in mind that the Eurozone’s preliminary PMIs for September are expected to have declined, we may experience the next leg down earlier than the technical picture points to at the moment. On the daily chart, the price structure remains lower highs and lower lows below both the 50- and the 200-day moving averages, thus I will stick the view that the overall picture remains negative and I would see any possible bullish waves as corrective moves and renewed selling opportunities. I would wait for a decisive move below 1.2825 (S1) to open the way for the key zone of 1.2760 (S2).
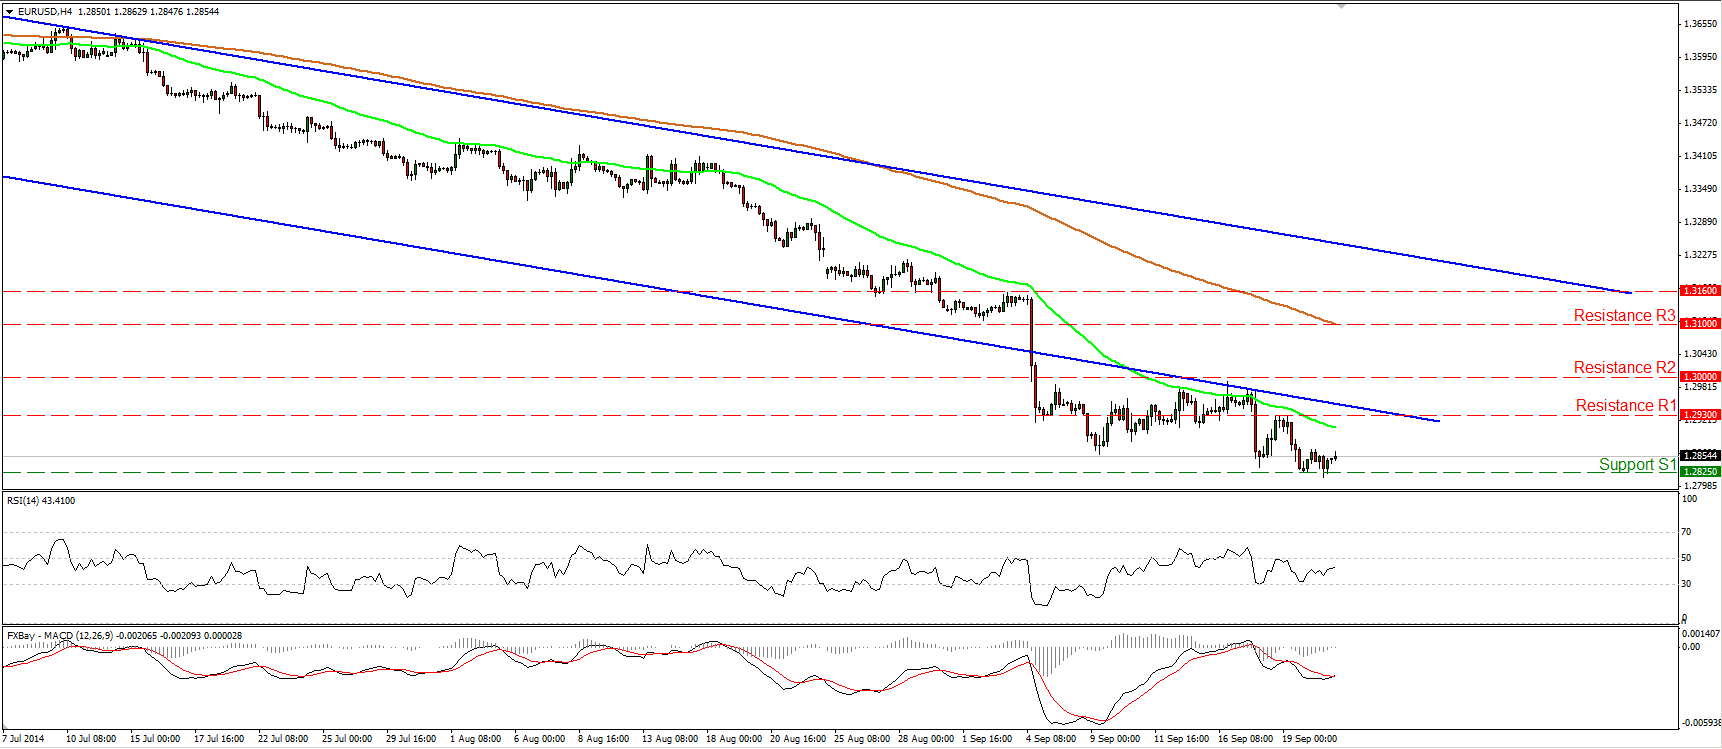
• Support: 1.2825 (S1), 1.2760 (S2), 1.2660 (S3).
• Resistance: 1.2930 (R1), 1.3000 (R2), 1.3100 (R3).
USD/JPY in a consolidative mode below 109.25
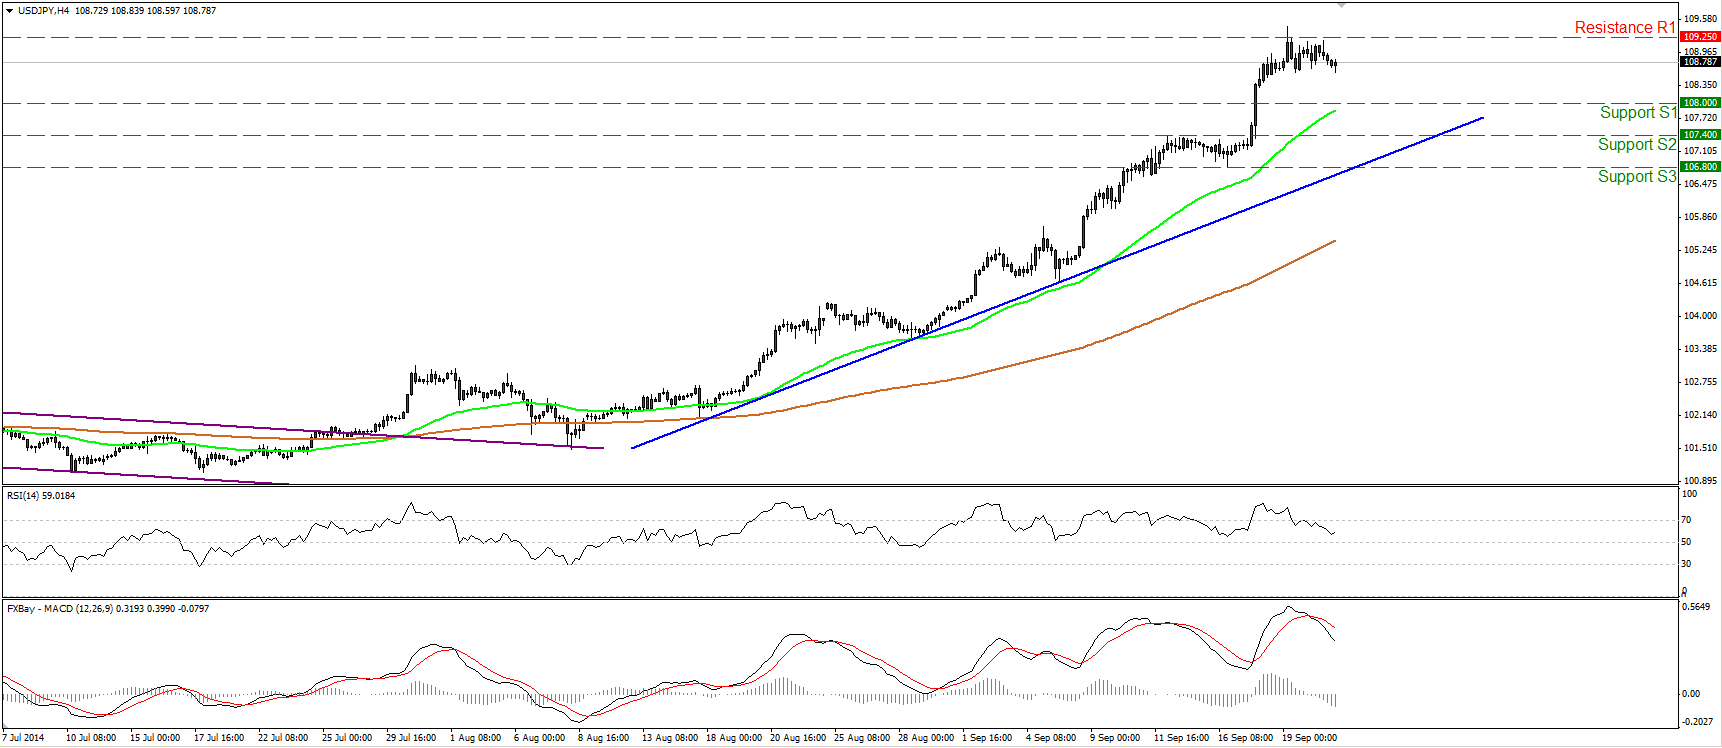
USD/JPY remains in consolidative mode, slightly below the resistance zone of 109.25 (R1). As long as the price is trading above the blue uptrend line and above both the moving averages, I consider the near-term bias to be to the upside. However, I would be mindful of a possible pullback before the next leg higher. The RSI declined further after exiting its overbought zone, while the MACD topped and moved below its signal line. In the bigger picture, I still see a newborn long-term uptrend, since, after the exit of a triangle on the daily chart, the price structure remains higher highs and higher lows above both the 50- and the 200-day moving averages.
• Support: 108.00 (S1), 107.40 (S2), 106.80 (S3).
• Resistance: 109.25 (R1), 110.00 (R2), 110.70 (R3).
GBP/USD rebounds from 1.6280
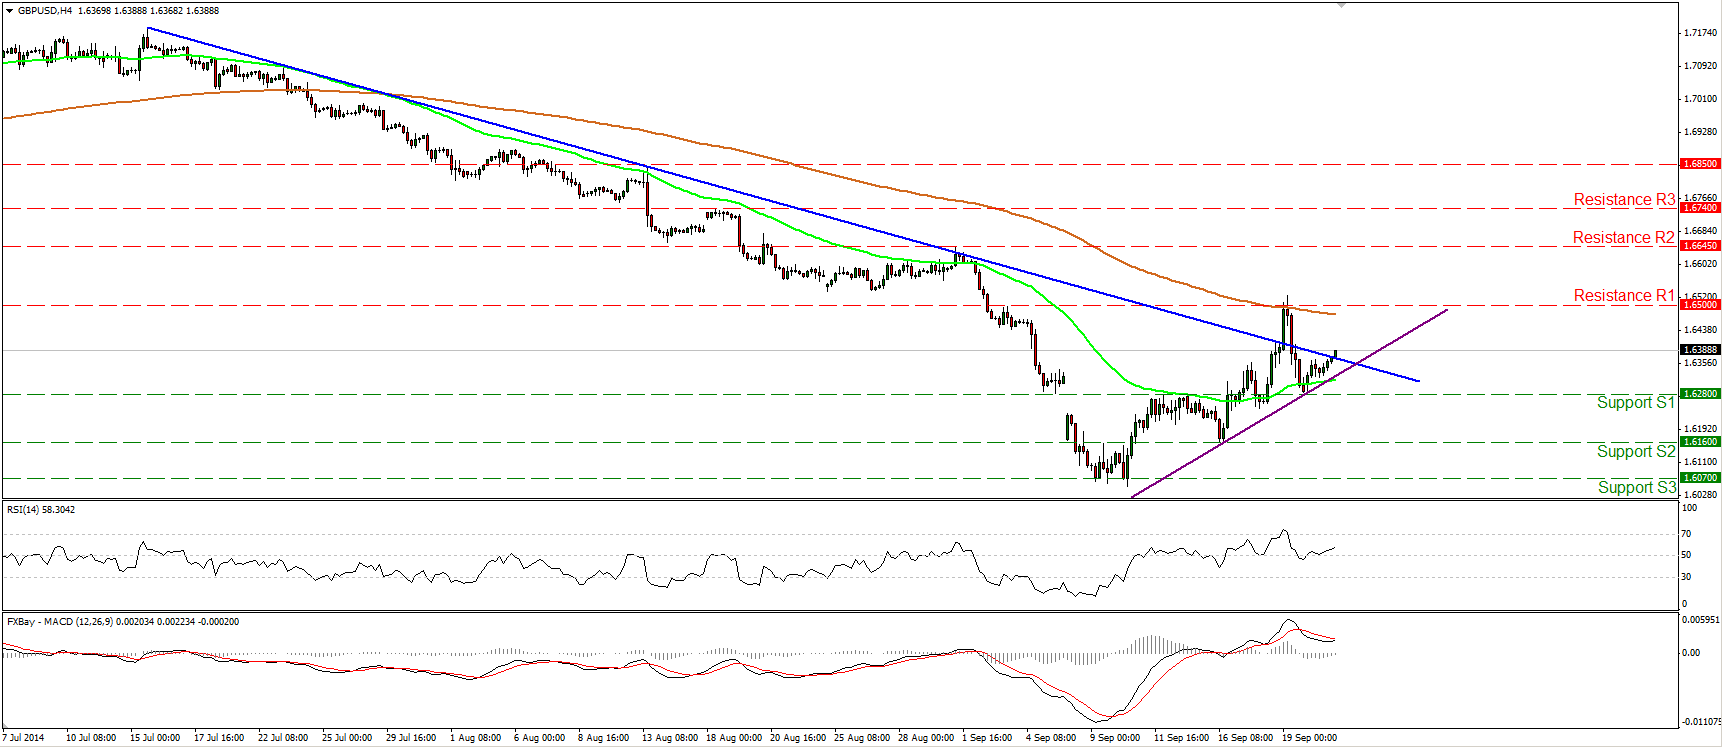
GBP/USD moved higher after finding support at 1.6280 (S1). Although this signals a higher low and keeps the near-term bias cautiously to the upside, I would wait for a clear move above 1.6500 (R1) to trigger further upside extensions. Such a move would signal a forthcoming higher high and is likely to find resistance near the area of 1.6645 (R2), which coincides with the 80-day exponential moving average. On the daily chart, the 14-day RSI moved higher and is now getting closer to its 50 line, while the MACD has bottomed and crossed above its trigger. This amplifies the case that we may see further upside in the near future, at least another test near 1.6500 (R1).
• Support: 1.6280 (S1), 1.6160 (S2), 1.6070 (S3).
• Resistance: 1.6500 (R1), 1.6645 (R2), 1.6740 (R3).
Gold rebounds from 1208
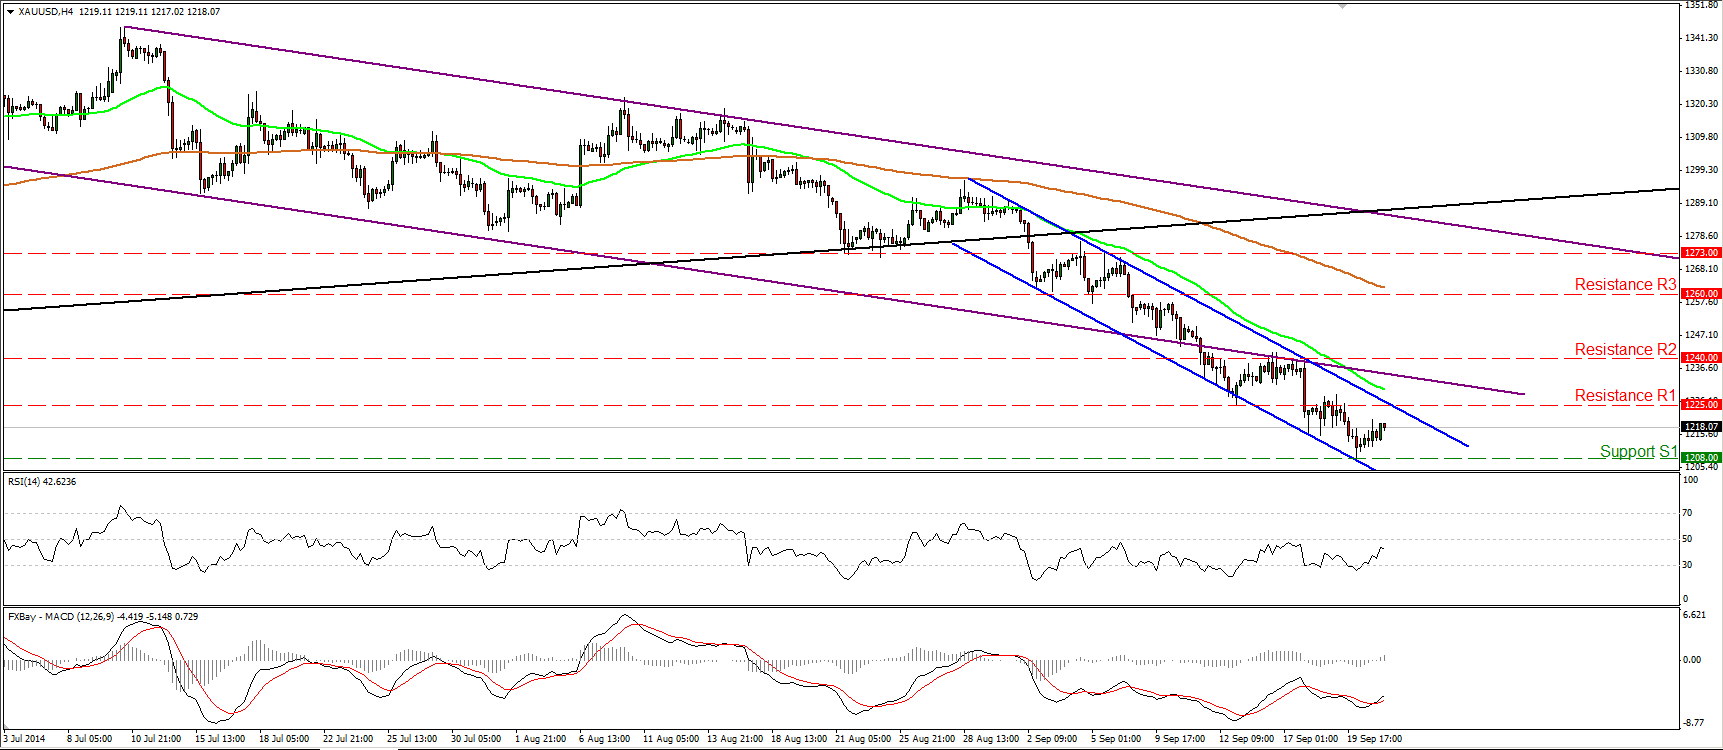
Gold moved higher after finding support at 1208 (S1), as expected. I will maintain the view that the rebound may continue, perhaps for a test near the 1225 (R1) line and the upper boundary of the blue near-term downside channel. The RSI exited its oversold field and moved higher, while the MACD, although negative moved above its signal line. Nevertheless, having in mind that the precious metal is trading within the near-term blue downside channel and below the black prior support line, drawn from back at the low of the 31st of December, I still see a downtrend and I would maintain the view that we are likely to see the metal challenging the psychological area of 1200 (S2) in the near future.
• Support: 1208 (S1), 1200 (S2), 1180 (S3).
• Resistance: 1225 (R1), 1240 (R2), 1260 (R3).
WTI keeps declining
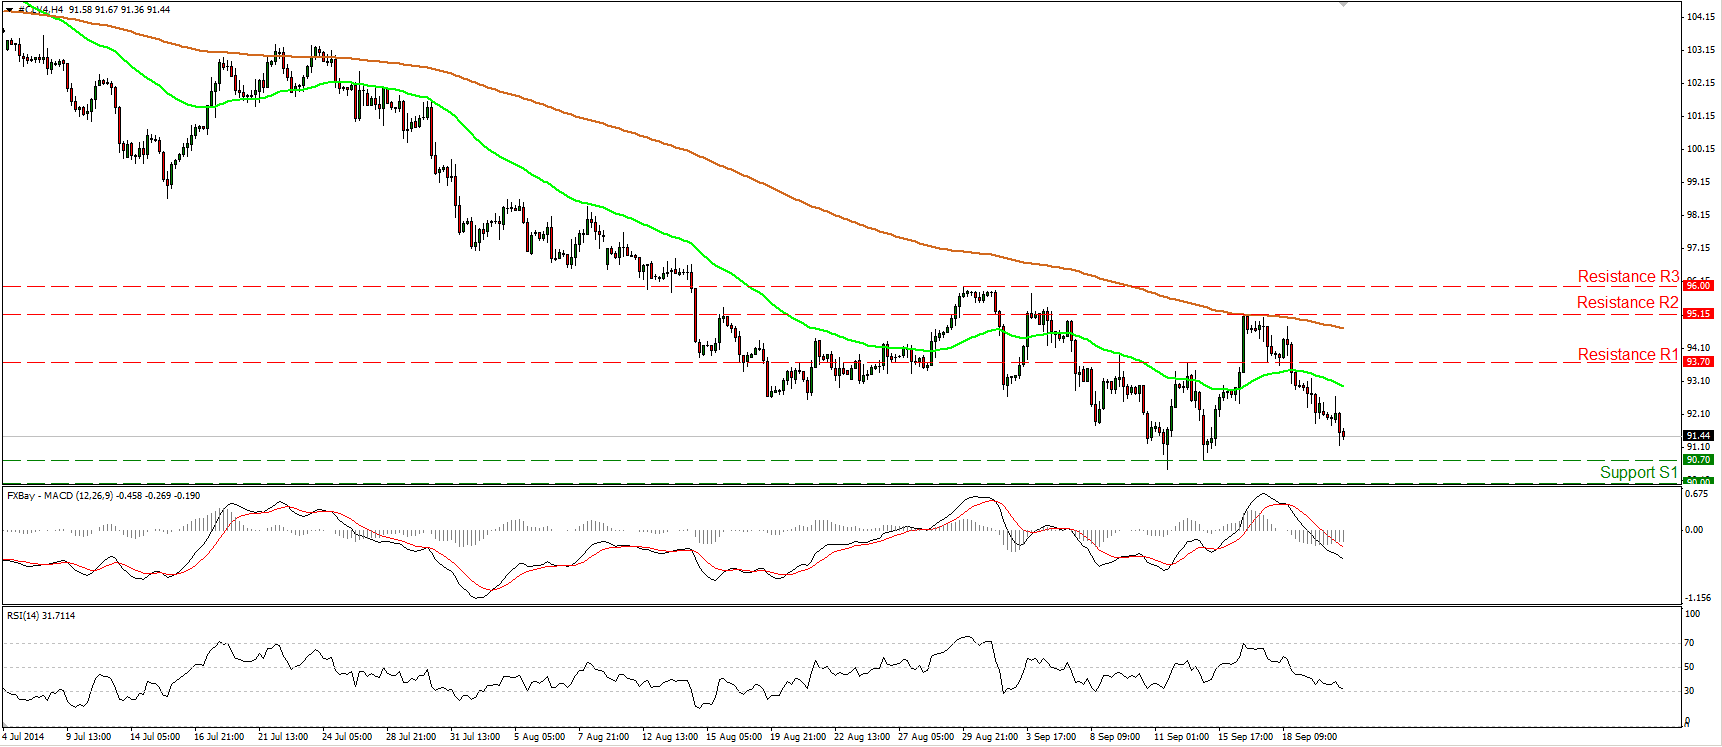
WTI continued declining on Monday and is getting closer to the 90.70 (S1) support line. The MACD moved lower after falling below zero, while the RSI declined and appears willing to fall below 30. This confirms the bearish momentum of the price action and that we are likely to see further near-term declines, at least for a test near the support line of 90.70 (S1). Zooming out on the daily chart, the trend remains to the downside in my view, but I still see positive divergence between both the daily oscillators and the price action. As a result, I would retain my “wait and see” stance as far as the overall picture of oil is concerned. I would like to see a clear dip below the psychological level of 90.00 (S2) before getting more confident about larger declines.
• Support: 90.70 (S1), 90.00 (S2), 87.65 (S3).
• Resistance: 93.70 (R1), 95.15 (R2), 96.00 (R3) .
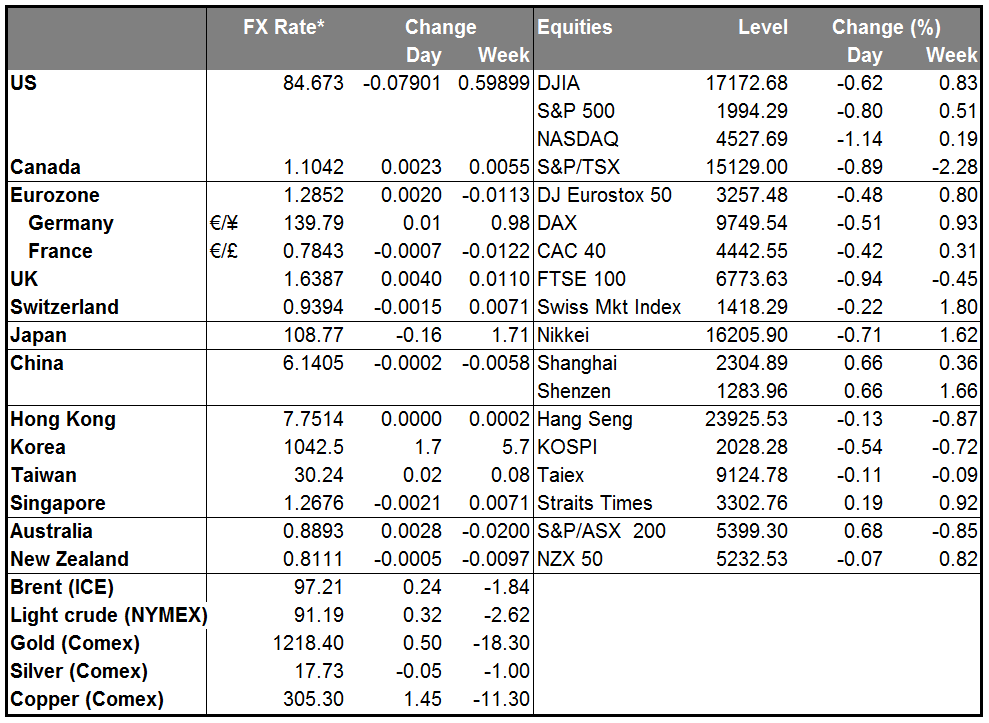
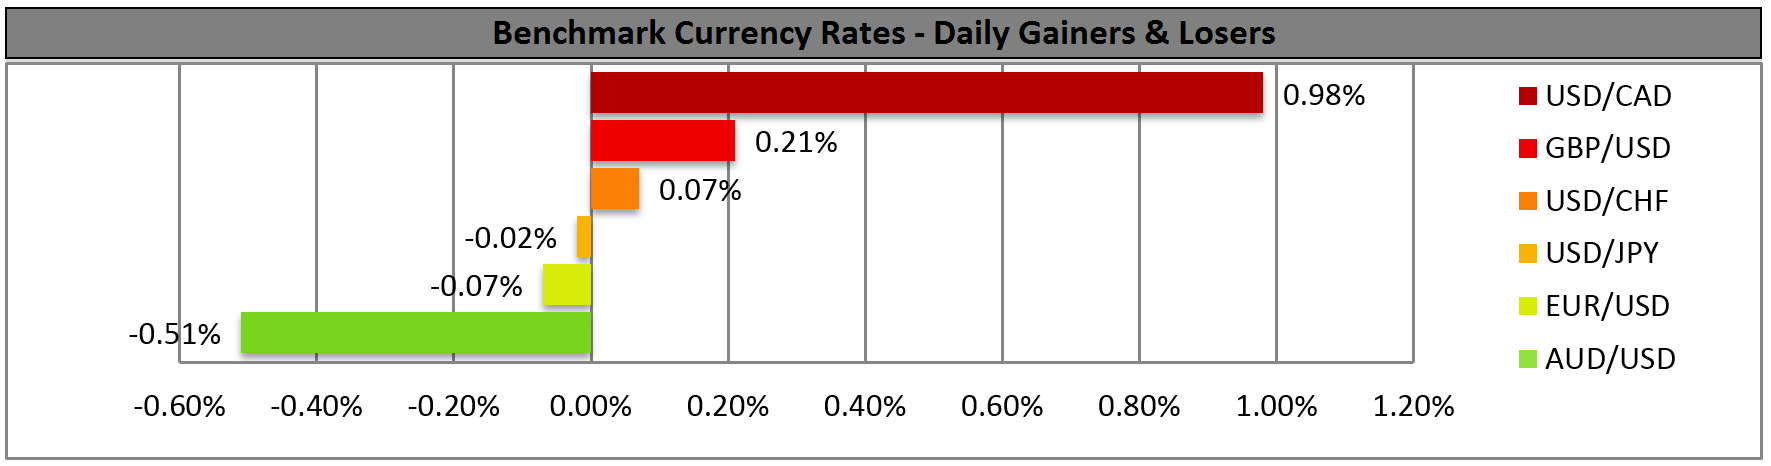
BENCHMARK CURRENCY RATES - DAILY GAINERS AND LOSERS
MARKETS SUMMARY