EUR/USD below the lows of February
EUR/USD declined significantly on Tuesday, falling below the psychological barrier of 1.3500 and breaking below the lows of February at 1.3475. I believe the move sets the stage for larger bearish extensions, opening the way towards the 1.3400 (S1) support area, marked by the low of the 21st of November. The MACD remains below its blue resistance line and below both its zero and signal lines, confirming yesterday’s negative momentum. The RSI dipped within its oversold zone, but it’s pointing sideways. I would search for a price bounce upon its exit from the extreme area. In the bigger picture, the move below the 1.3475 hurdle confirms a forthcoming lower low, while the 50-day moving average touched the 200-day one and a bearish cross in the near future will add to the negative outlook of the pair.

• Support: 1.3400 (S1), 1.3300 (S2), 1.3250 (S3)
• Resistance: 1.3475 (R1), 1.3500 (R2), 1.3580 (R3)
EUR/JPY breaks below 136.75
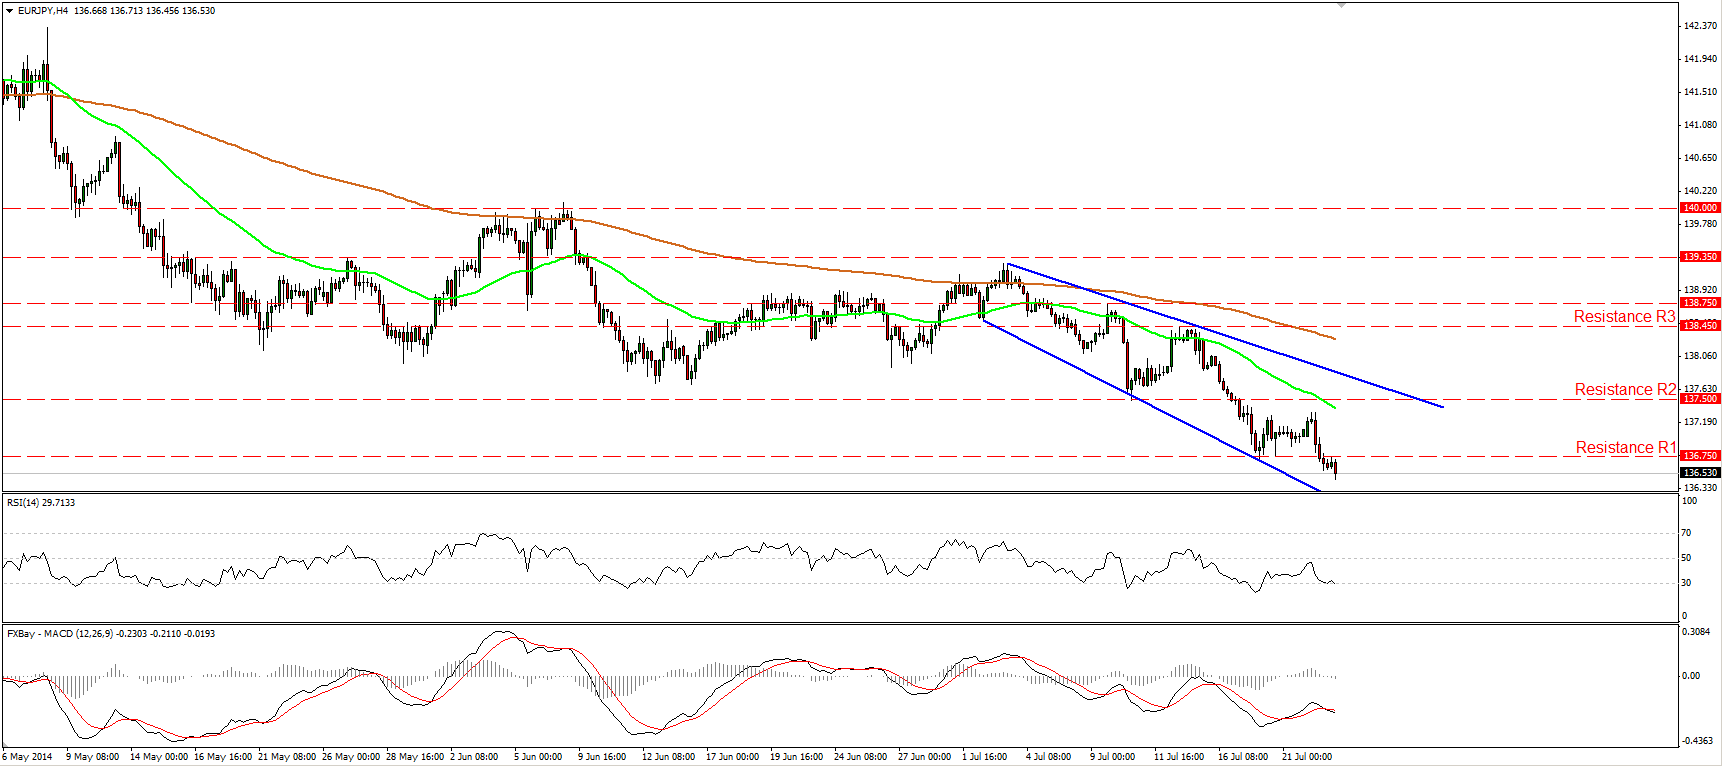
EUR/JPY moved lower and fell below the 136.75 (support turned into resistance). The move confirms a forthcoming lower low and could pave the way towards the support obstacle of 136.20 (S1). The MACD, already below zero, fell below its signal line, confirming the accelerating bearish momentum of the price action. As long as the rate is trading below the blue downtrend line and below both the moving averages, the short-term path remains to the downside. On the daily chart, the 50-day moving average is getting closer to the 200-day moving average and a bearish cross in the future will add to the negative outlook of EUR/JPY.
• Support: 136.20 (S1), 135.50 (S2), 135.00 (S3)
• Resistance: 136.75 (R1), 137.50 (R2), 138.45 (R3)
GBP/USD waits for the BoE minutes
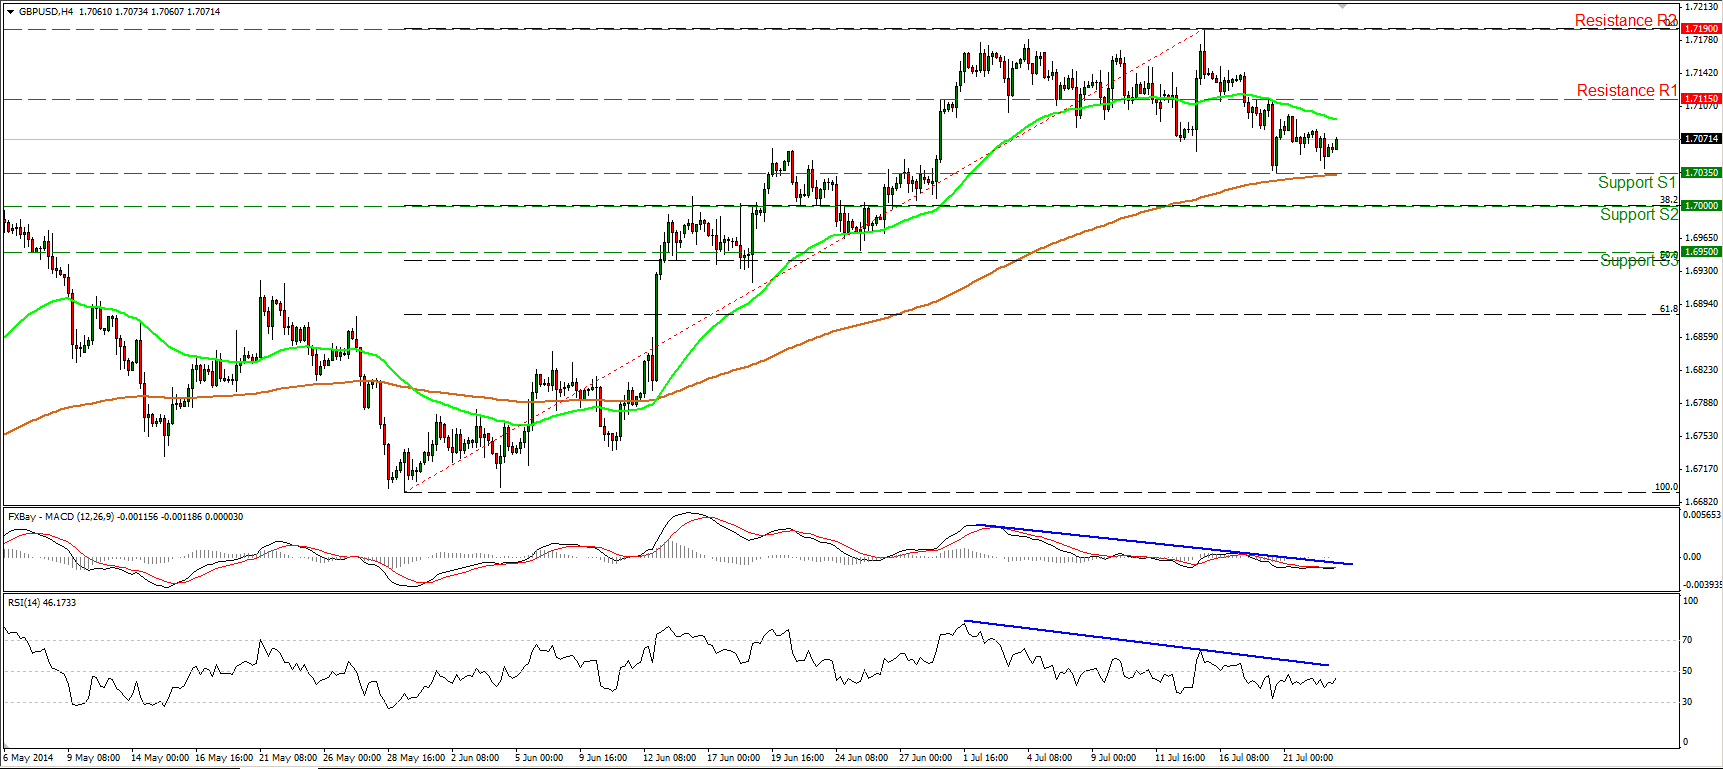
GBP/USD moved slightly lower, but found support once again near 1.7035 (S1), marginally above the 200-period moving average. The negative divergence between our momentum studies and the price action remains in effect and indicates that the pair may be topping and keeps the near-term outlook mildly to the downside. However, today the BoE releases the minutes of its latest policy meeting and much of today’s movement will depend on that. As a result, I would remain on the sidelines until I get more pieces of the puzzle to fill out the pair’s short-term picture. On the daily chart, the 80-day exponential moving average continues to provide reliable support to the lows of the price action. This keeps the long-term path to the upside and as a result, I would see any possible near-term declines as a correcting phase of the major uptrend.
• Support: 1.7035 (S1), 1.7000 (S2), 1.6950 (S3)
• Resistance: 1.7115 (R1), 1.7190 (R2), 1.7300 (R3)
Gold’s picture remains unclear
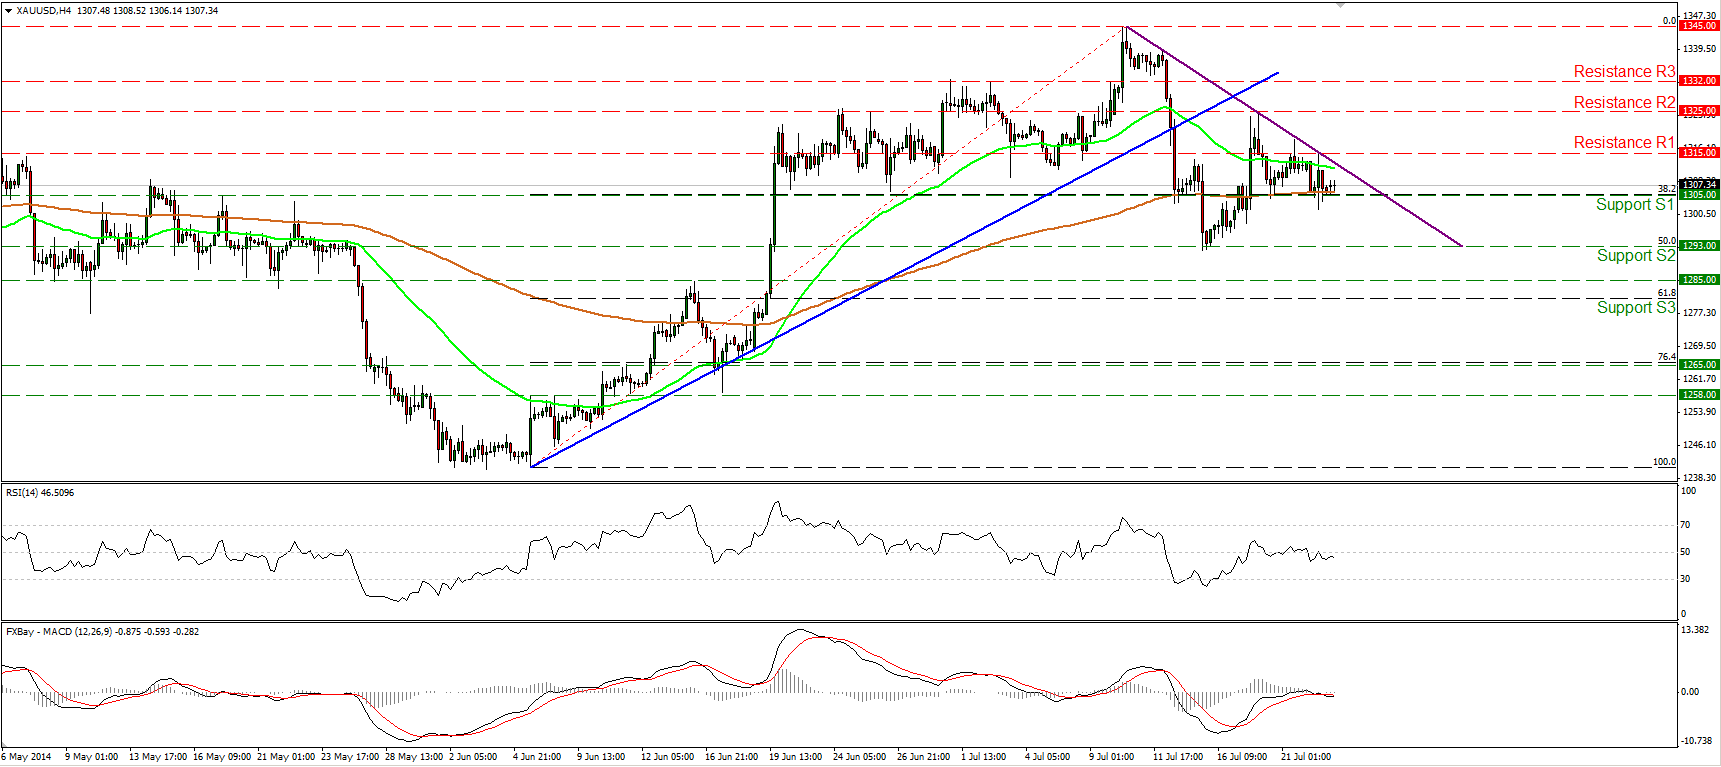
Gold declined somewhat during the early European morning Tuesday, but was halted once again by the 1305 (S1) level, which coincides with the 200-period moving average. Later in the day, the metal tried to move higher but found resistance at 1315 (R1) and the purple downside trend line. Taking into account that the price remains below the purple trend line, but well supported by the 1305 (S1) zone, I would maintain my neutral view. Both the RSI and the MACD remain near their neutral levels, while on the daily chart, both the 50- and the 200-day moving averages are pointing sideways, adding to the unclear picture of the yellow metal.
• Support: 1305 (S1), 1293 (S2), 1285 (S3)
• Resistance: 1315 (R1), 1325 (R2), 1332 (R3)
WTI fails to sustain above 105.00
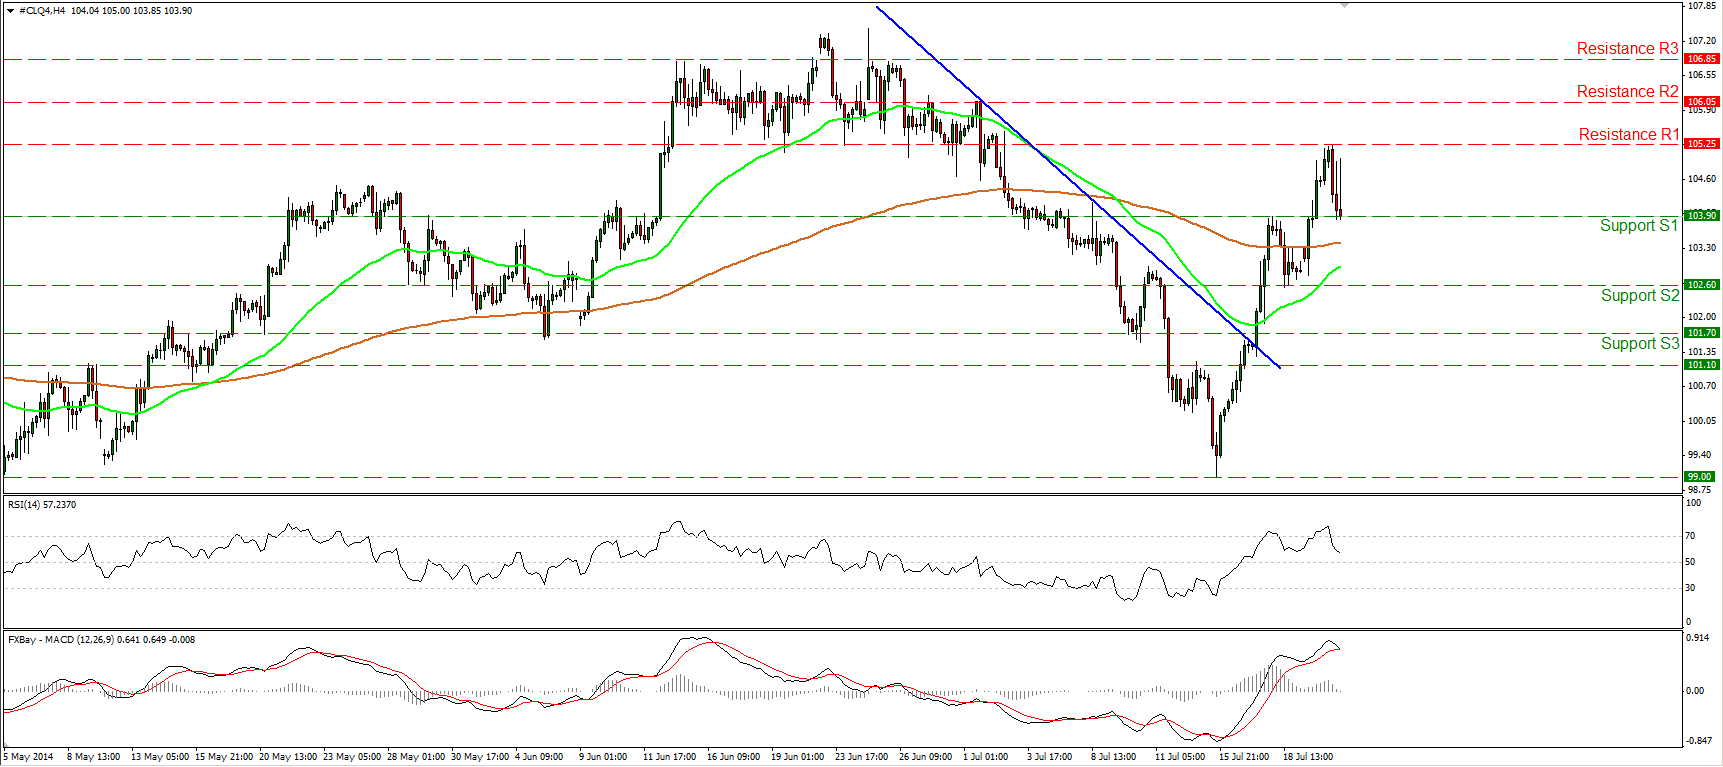
WTI tried to move above 105.00, but the attempt was unsuccessful. The price found some selling orders above that level and after finding resistance at 105.25 (R1), it fell sharply to hit the support barrier of 103.90 (S1). Although the possibility of a higher low still exist and this keeps the short-term uptrend intact, having in mind the sharp tumble, I would change my view from positive to neutral. Moreover, the RSI moved lower after exiting its overbought zone, while the MACD seems ready to move below its trigger line. Zooming on the 1-hour chart, I can see negative divergence between the price action and both the hourly momentum studies. The momentum signals are not so encouraging at the moment and this is another reason I would remain flat for now.
• Support: 103.90 (S1), 102.60 (S2), 101.70 (S3)
• Resistance: 105.25 (R1), 106.05 (R2), 106.85 (R3)
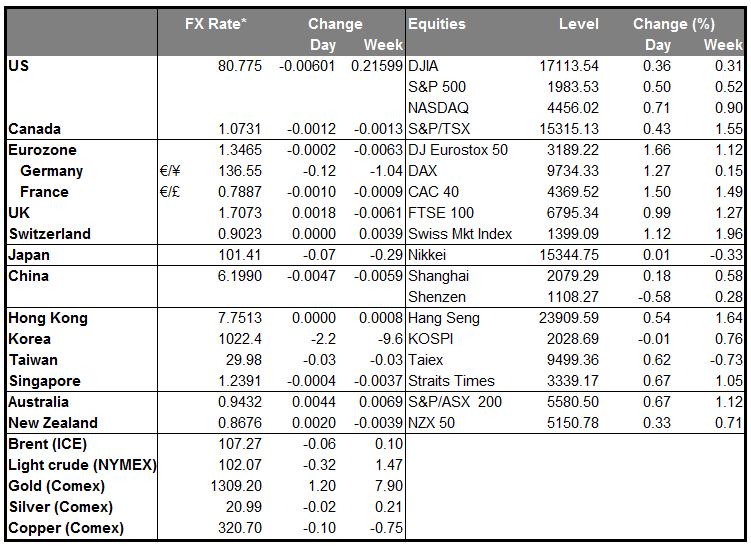
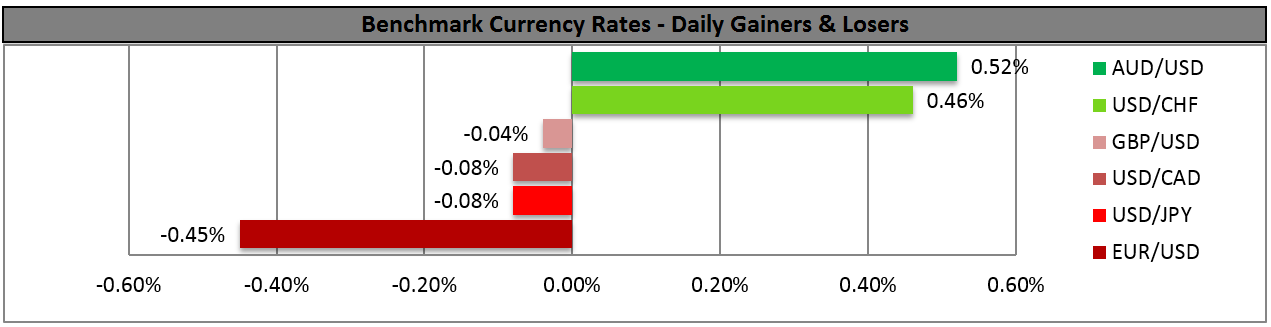
BENCHMARK CURRENCY RATES - DAILY GAINERS AND LOSERS
MARKETS SUMMARY