EUR/USD reaches a fresh 14-month low
EUR/USD moved lower on Friday, but after finding support at 1.2825 (S1), the pair rebounded somewhat. Zooming on the 1-hour chart, I can see positive divergence between both our hourly momentum studies and the price action, something that makes me believe that the rebound could continue. This is also supported by our daily momentum indicators. The 14-day RSI moved higher and exited its oversold field, while the MACD crossed above its signal line. However, the price structure remains lower highs and lower lows below both the 50- and the 200-day moving averages, thus I will stick the view that the overall picture remains negative and I would see any possible bullish waves as corrective moves and renewed selling opportunities.
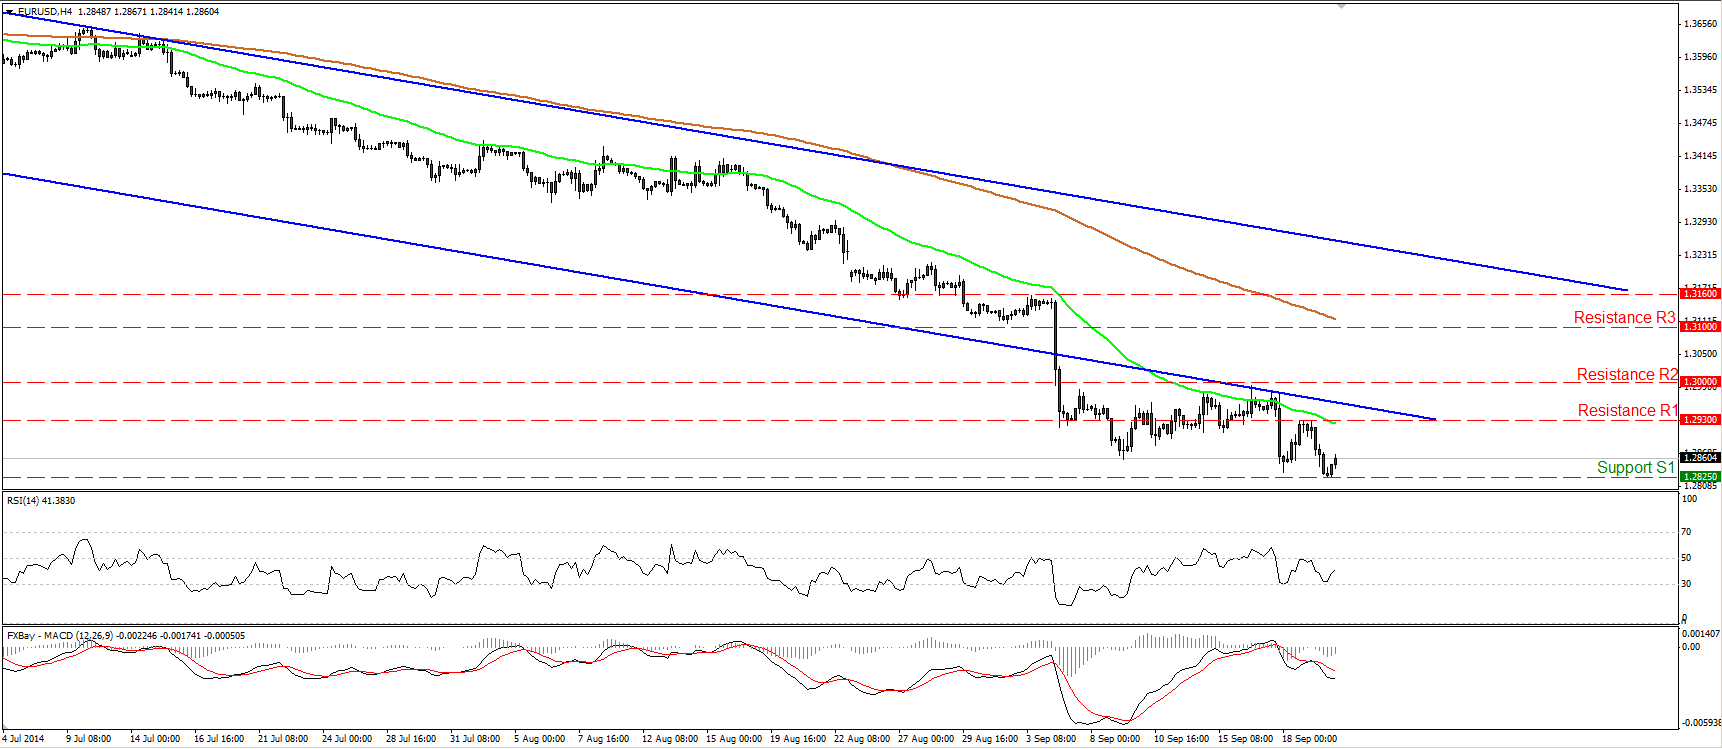
• Support: 1.2825 (S1), 1.2760 (S2), 1.2660 (S3).
• Resistance: 1.2930 (R1), 1.3000 (R2), 1.3100 (R3).
GBP/JPY falls after touching 180.70
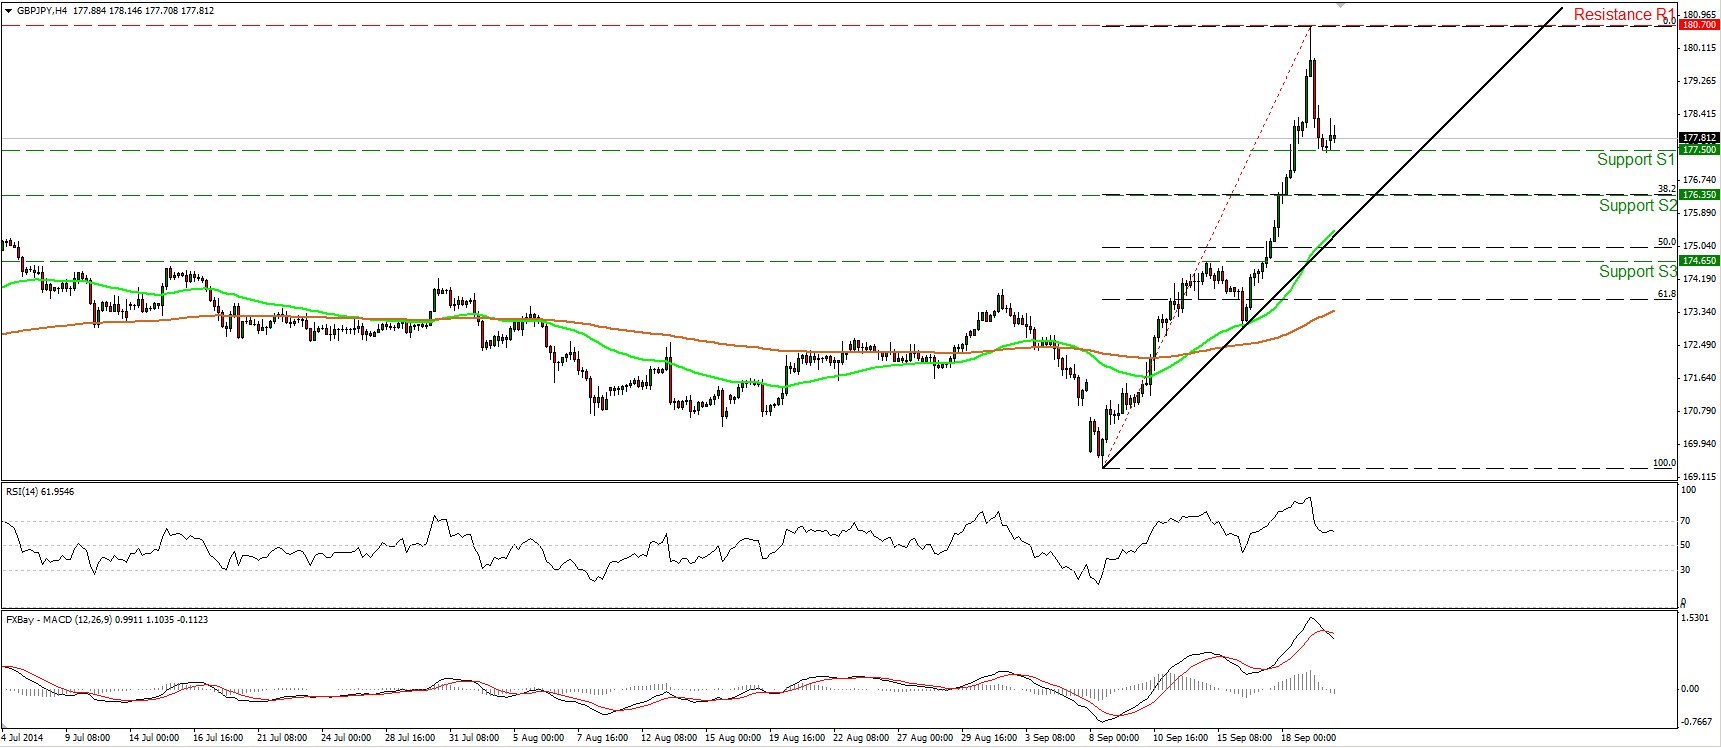
GBP/JPY fell sharply after hitting 180.70 (R1). At the time of writing, the pair is trading slightly above the support line of 177.50 (S1), but taking into account our momentum studies and the fact that I see a shooting star candle on the daily chart, I would expect the down wave to continue. The RSI moved lower after exiting its overbought territory, while the MACD has topped and moved below its trigger line. Further rate declines are likely to find support near the 176.35 (S2) line, which is the 38.2% retracement level of the 8th – 19th of September advance. However, after the upside exit of a broadening formation on the daily chart, the price structure suggests an uptrend, thus I would see any near-term pullbacks as corrective waves before buyers prevail again.
• Support: 177.50 (S1), 176.35 (S2), 174.65 (S3).
• Resistance: 180.70 (R1), 181.00 (R2), 182.00 (R3).
NZD/USD rebounds from 0.8080
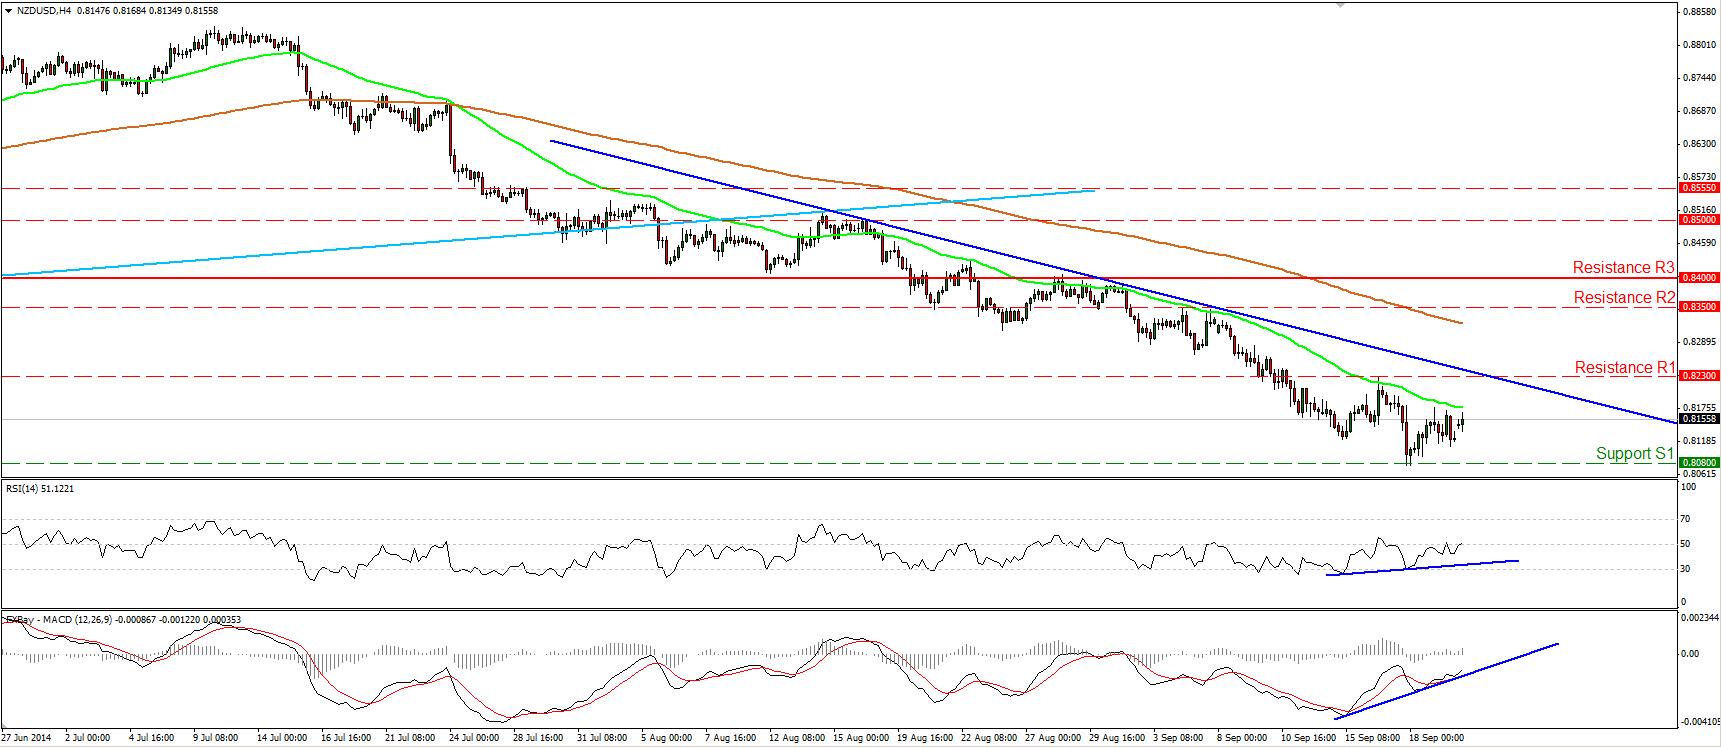
NZD/USD moved higher after finding support at 0.8080 (S1). During the early European morning Monday, the pair is trading between that line and the resistance of 0.8230 (R1). Taking a look at our momentum indicators, I see positive divergence between both of them and the price action, which suggests further upside in the near future, perhaps for a test near the 0.8230 (R1) line. Nevertheless, as long as the pair is trading below the near-term blue downtrend line and below the prior longer-term uptrend line (light blue line), drawn from back at the 30th of August 2013, the overall picture remains negative, in my view. I would expect a dip below the 0.8080 (S1) hurdle in the future to pave the way for the psychological obstacle of 0.8000 (S2).
• Support: 0.8080 (S1), 0.8000 (S2), 0.7930 (S3).
• Resistance: 0.8230 (R1), 0.8350 (R2), 0.8400 (R3).
Gold falls below 1215
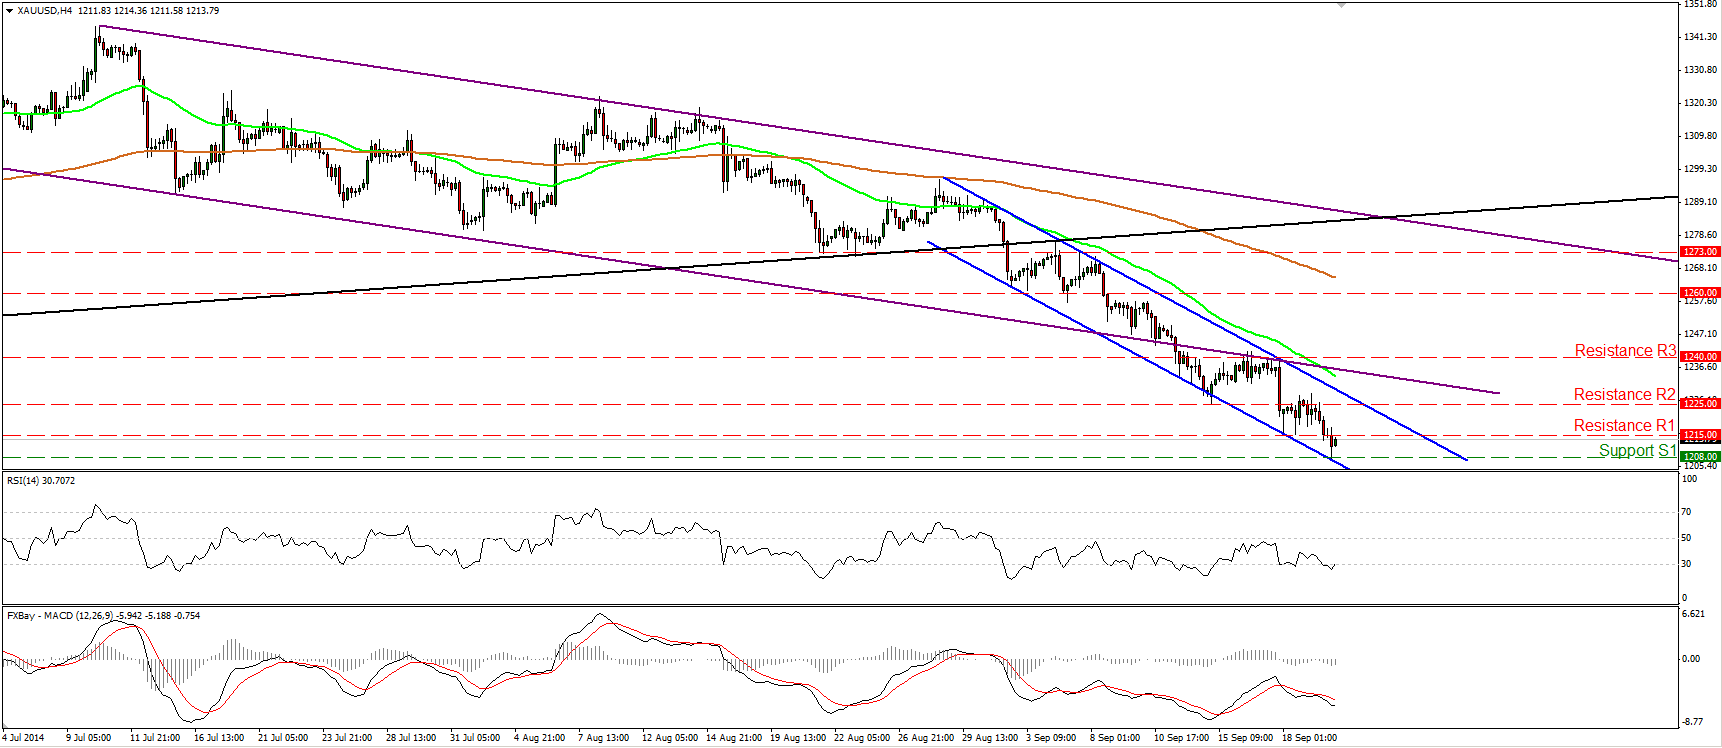
Gold declined on Friday, but it found support at 1208 (S1). Bearing in mind that the precious metal is trading within the near-term blue downside channel and below the black prior support line, drawn from back at the low of the 31st of December, I still see a downtrend and I would maintain the view that we are likely to see the metal challenging the psychological area of 1200 (S2) in the near future. Nevertheless, given our proximity to the lower line of the blue channel, and that the RSI appears willing to cross above its 30 line, I would be mindful of a possible upside corrective bounce before the bears take the reins again, perhaps for a test near the 1225 (R2) line or the upper boundary of the channel.
• Support: 1208 (S1), 1200 (S2), 1180 (S3).
• Resistance: 1215 (R1), 1225 (R2), 1240 (R3).
WTI continues lower
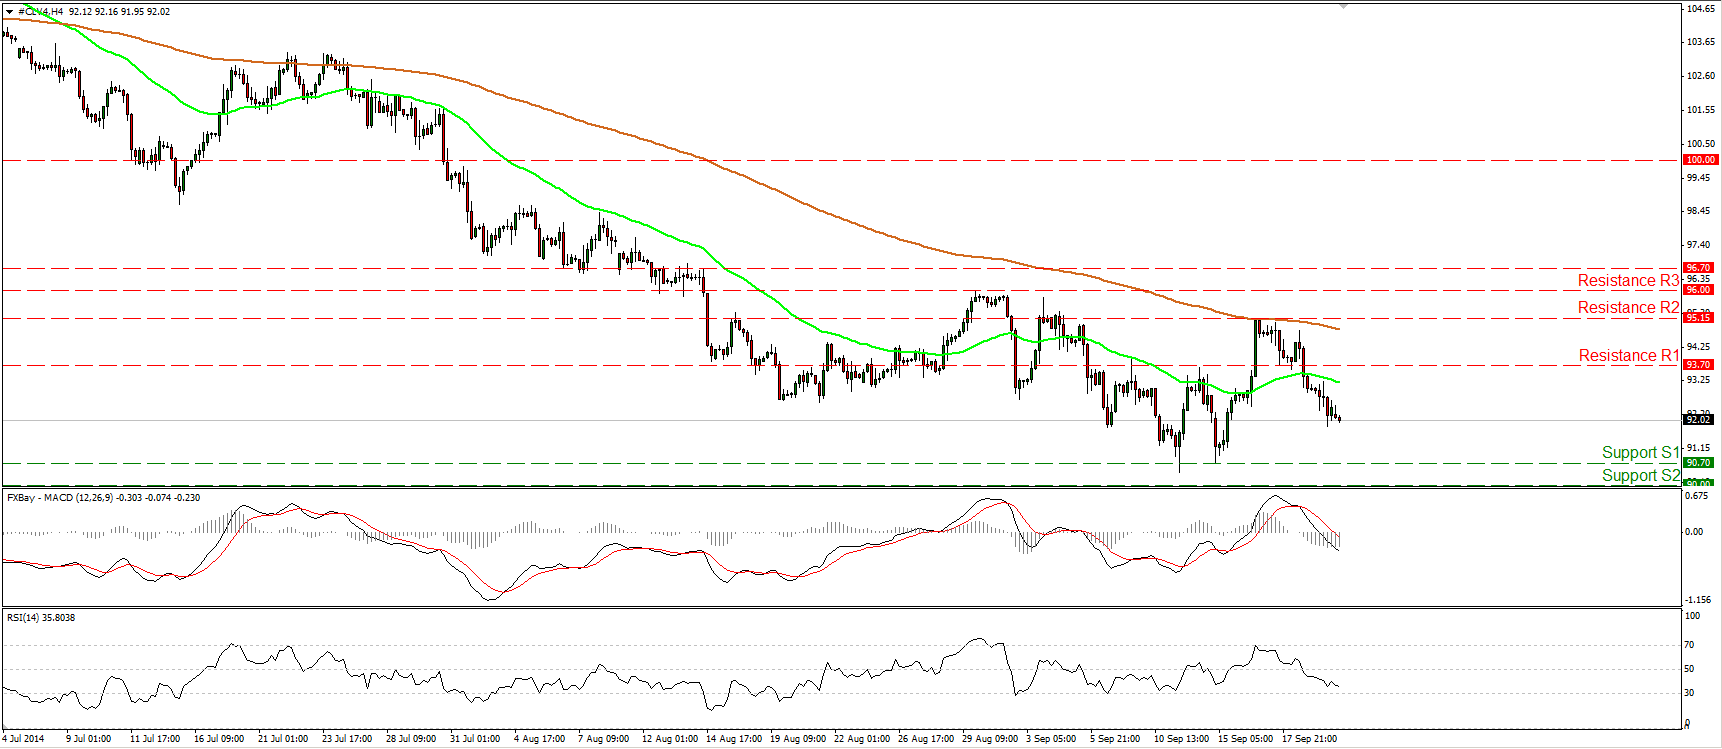
WTI continued its tumble after hitting the 200-period moving average last week. The MACD, already below its signal line, fell below its zero line, while the RSI has more room to go before signaling oversold conditions. This designates bearish momentum and amplifies the case for further near-term declines, perhaps towards the support line of 90.70 (S1). Zooming out on the daily chart, the trend remains to the downside in my view, but I still see positive divergence between both the daily oscillators and the price action. As a result, I would adopt a “wait and see” stance as far as the overall picture of oil is concerned. I would like to see a decisive dip below 90.00 (S2) before getting more confident about the downside.
• Support: 90.70 (S1), 90.00 (S2), 87.65 (S3).
• Resistance: 93.70 (R1), 95.15 (R2), 96.00 (R3) .
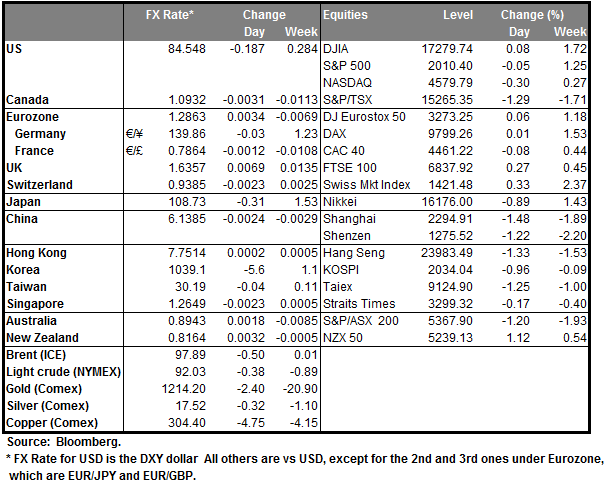
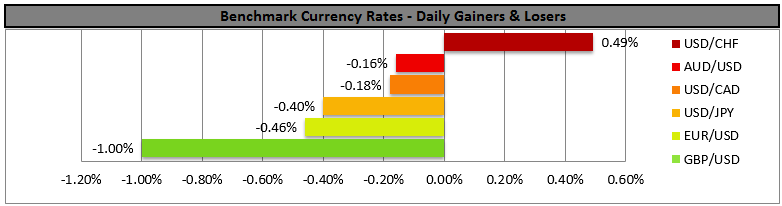
BENCHMARK CURRENCY RATES - DAILY GAINERS AND LOSERS
MARKETS SUMMARY