EUR/USD finds support at 1.3240
EUR/USD rebounded on Thursday, after Eurozone’s PMIs for August managed to remain above the 50 line, while Germany’s figures exceeded market expectations. The pair found support at 1.3240 (S1) and rebounded to trade slightly below the 1.3300 (R1) line. Our momentum signs suggest that the pair could continue to rebound, perhaps back above 1.3300 (R1). The RSI exited its oversold field and is now pointing its 50 line, while the MACD bottomed and moved above its signal line. Nevertheless, since the rate is trading within the downside blue channel, connecting the highs and the lows on the daily chart, I still consider the overall outlook to be negative and I would see yesterday’s rebound as a corrective move before sellers take the reins again. If Fed Chair Yellen sounds more optimistic today than we are used to, the rate may change course again and aim for the 1.3200 (S2) line, in my view.

• Support: 1.3240 (S1), 1.3200 (S2), 1.3100 (S3)
• Resistance: 1.3300 (R1), 1.3330 (R2), 1.3415 (R3)
USD/JPY consolidates after hitting 103.95
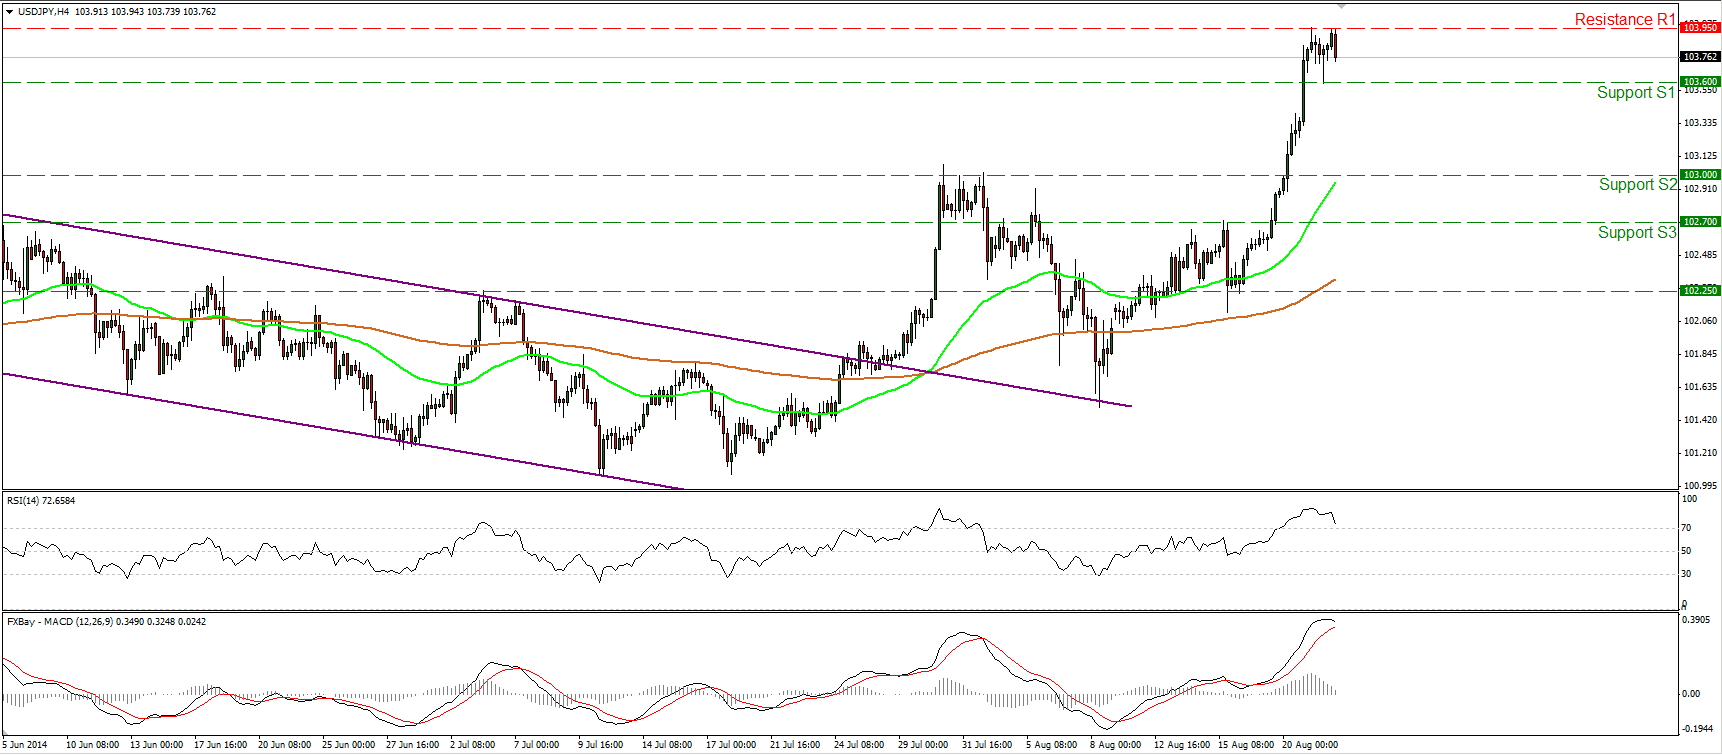
USD/JPY surged on Wednesday, violating the 103.00 (S2) zone and finding resistance five pips below our barrier of 104.00. After consolidating below the 103.95 (R1) line, the pair retreated somewhat. Bearing in mind our momentum indicators and the fact that the rally was too steep, I expect the corrective wave to continue. The RSI, within its overbought area, is pointing down and seems willing to fall below 70 soon, while the MACD shows signs of topping and probably won’t take long before it falls below its trigger. Nevertheless, I still see a positive picture and I believe that a move above the 104.15 (R2) zone is likely to pull the trigger for extensions towards the next obstacle at 104.85 (R3).
• Support: 103.60 (S1), 103.00 (S2), 102.70 (S3)
• Resistance: 103.95 (R1), 104.15 (R2), 104.85 (R3)
EUR/GBP rebounds from 0.7980

EUR/GBP rebounded from 0.7980 (S1) and the lower boundary of the purple upside channel on Wednesday, but today is still trading below its recent highs. The fact that the rate remains within the channel and is still trading above both the moving averages keeps the short-term path to the upside, but I would like to see a decisive move above 0.8030 (R1) before expecting further bullish extensions. Such a move could open the way for our next resistance bar at 0.8080 (R2), near the 38.2% retracement level of the 18th March – 23rd July longer-term downtrend. The RSI moved above its 50 line and is pointing somewhat up, while the MACD, after dipping below zero, is back positive and back above its signal line, confirming the recent bullish momentum.
• Support: 0.7980 (S1), 0.7950 (S2), 0.7920 (S3)
• Resistance: 0.8030 (R1), 0.8080 (R2), 0.8140 (R3)
Gold reaches and breaks 1280
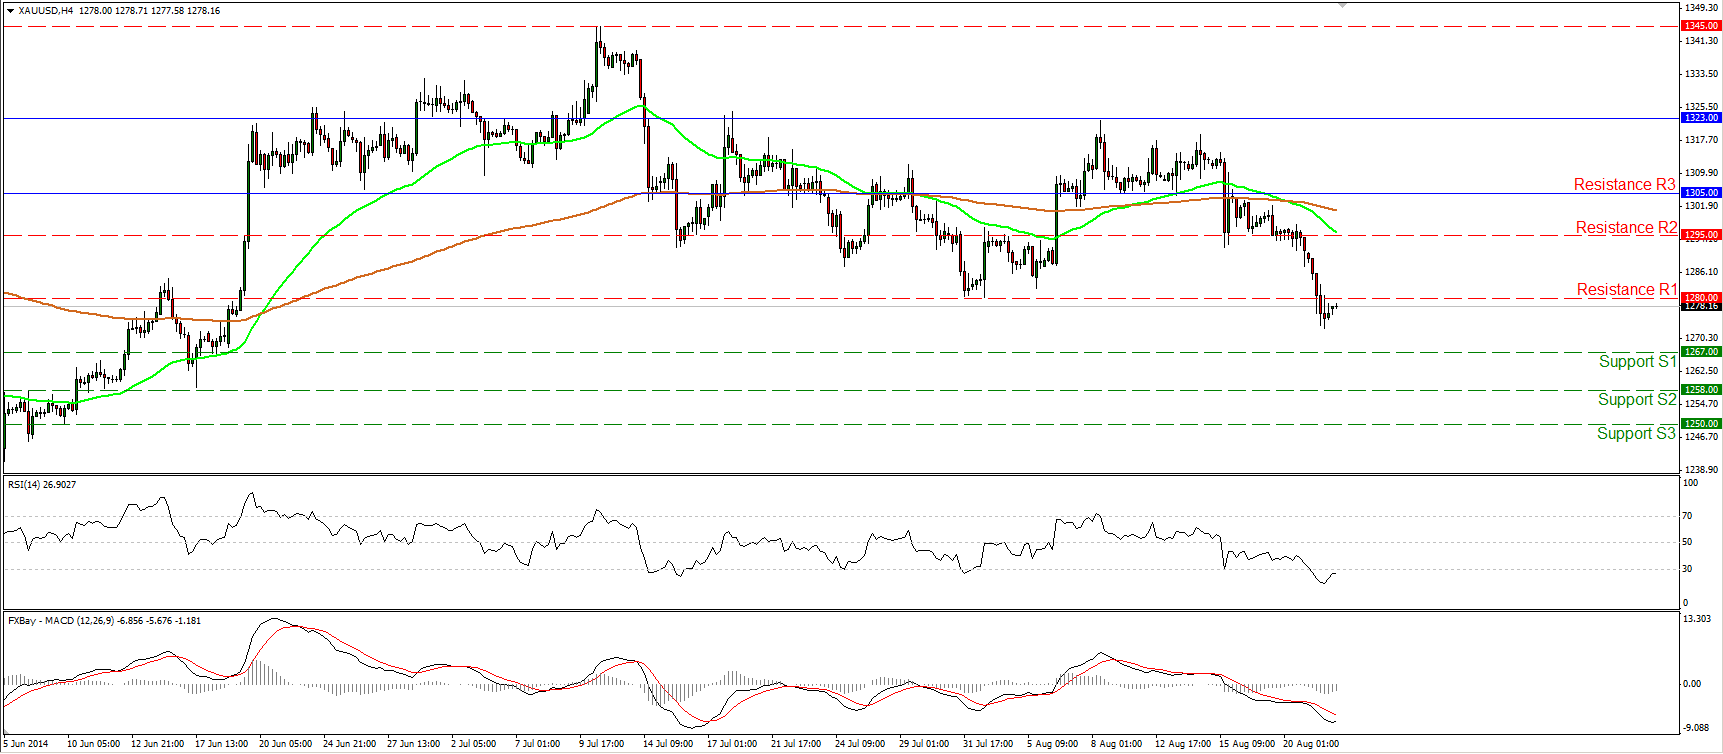
Gold continued moving down yesterday, reaching and breaking below our line of 1280 (support turned into resistance). Although we had a minor bounce after the break, I still see a negative short-term picture and I would expect the yellow metal to challenge hurdle of 1267 (S1) in the near future. The RSI lies within its oversold territory, near its 30 line, while the MACD, although below both its zero and signal line, shows signs of bottoming. Thus, I would be cautious on the continuation of the bounce before the next leg down takes place. On the daily chart, the 14-day RSI lies below 50, while the MACD left its neutral line and obtained a negative sign, confirming the last days’ bearish momentum of the price action.
• Support: 1267 (S1), 1258 (S2), 1250 (S3)
• Resistance: 1280 (R1), 1295 (R2), 1305(R3)
WTI fails to move below 92.60
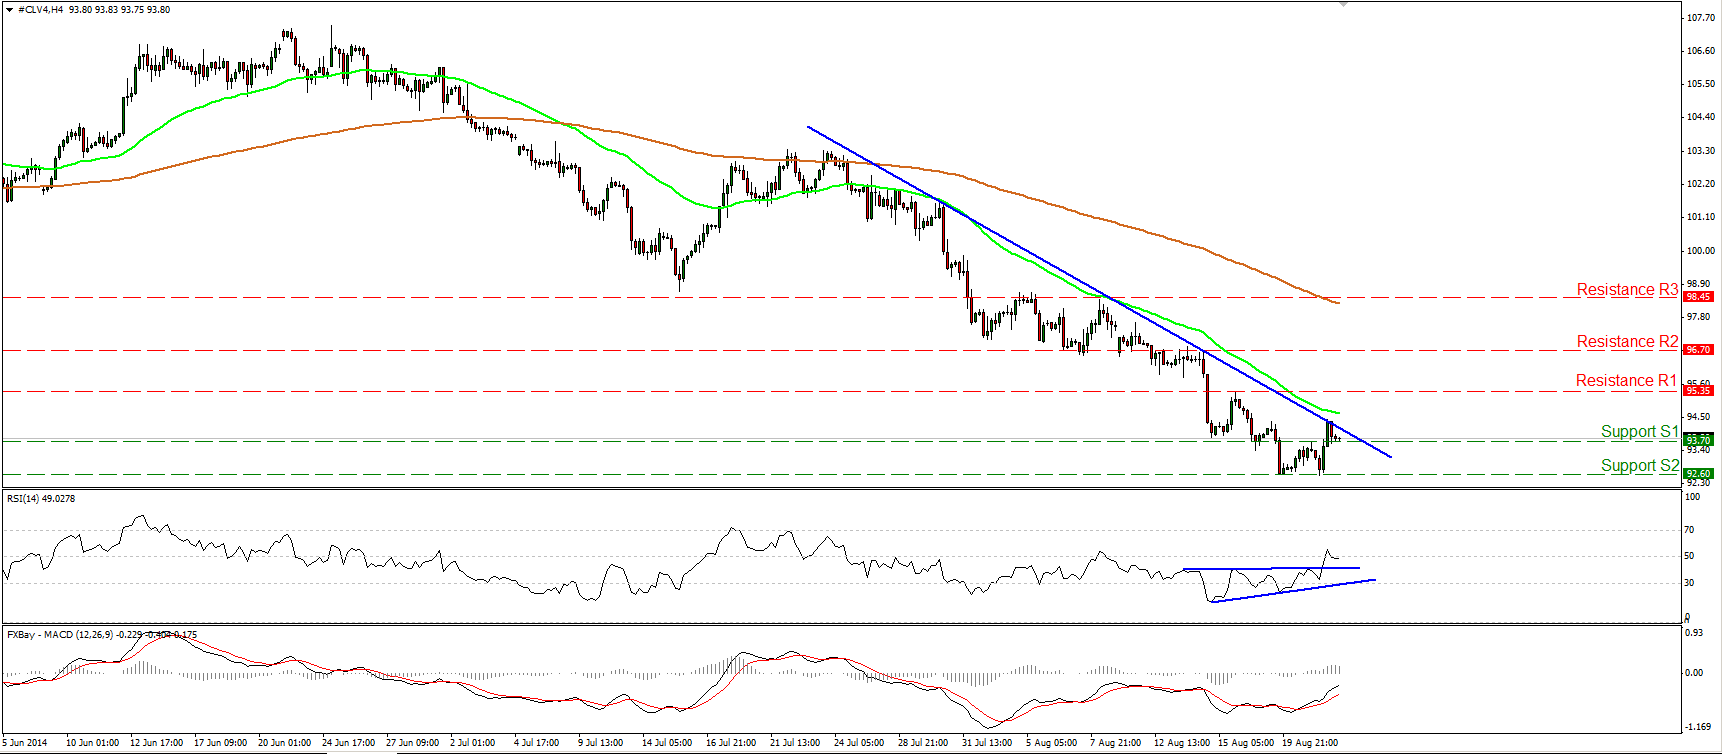
WTI found support again at 92.60 (S2) and moved higher to reach the near-term downtrend line. The fact that the price remains below the trend line and below both the moving averages keeps the short-term path to the downside. However, taking a look at our momentum indicators, I would prefer to maintain my flat view. The RSI broke above its resistance line, while the MACD lies above its trigger and is pointing up. Moreover, I still see positive divergence between the RSI and the price action. A price move above the trend-line and the resistance of 95.35 (R1) is likely to confirm the divergence and pave the way for the next resistance obstacle, at 96.70 (R2). On the other hand, we need a dip below 92.60 (S2) to have a forthcoming lower low and the continuation of the downside path.
• Support: 93.70 (S1), 92.60 (S2), 91.60 (S3)
• Resistance: 95.35 (R1), 96.70 (R2), 98.45 (R3)
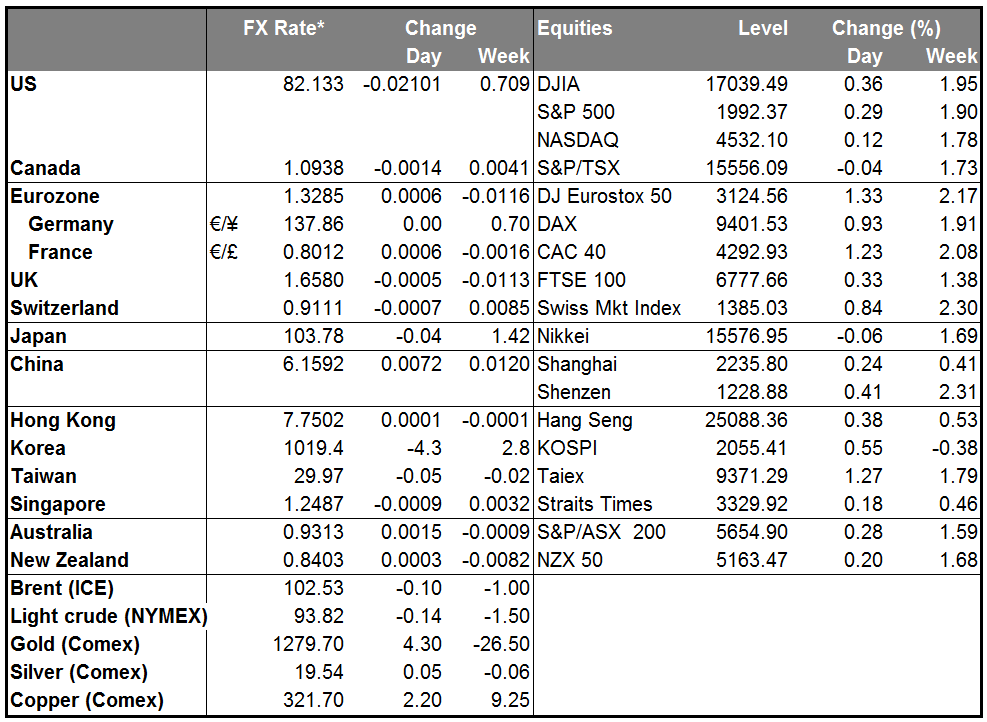
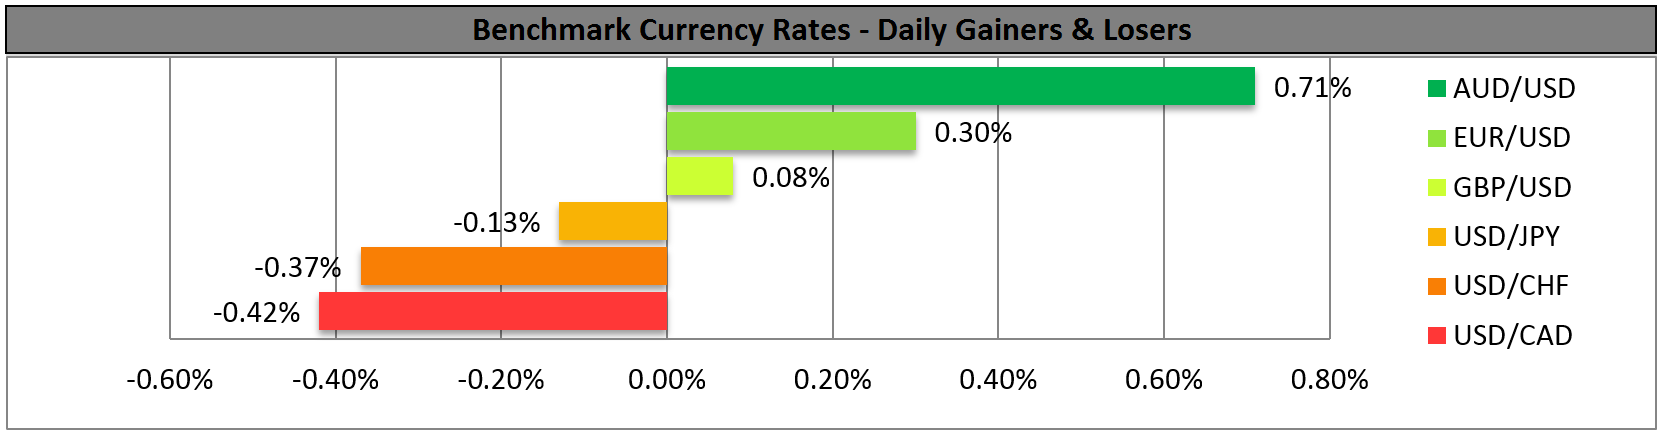
BENCHMARK CURRENCY RATES - DAILY GAINERS AND LOSERS
MARKETS SUMMARY