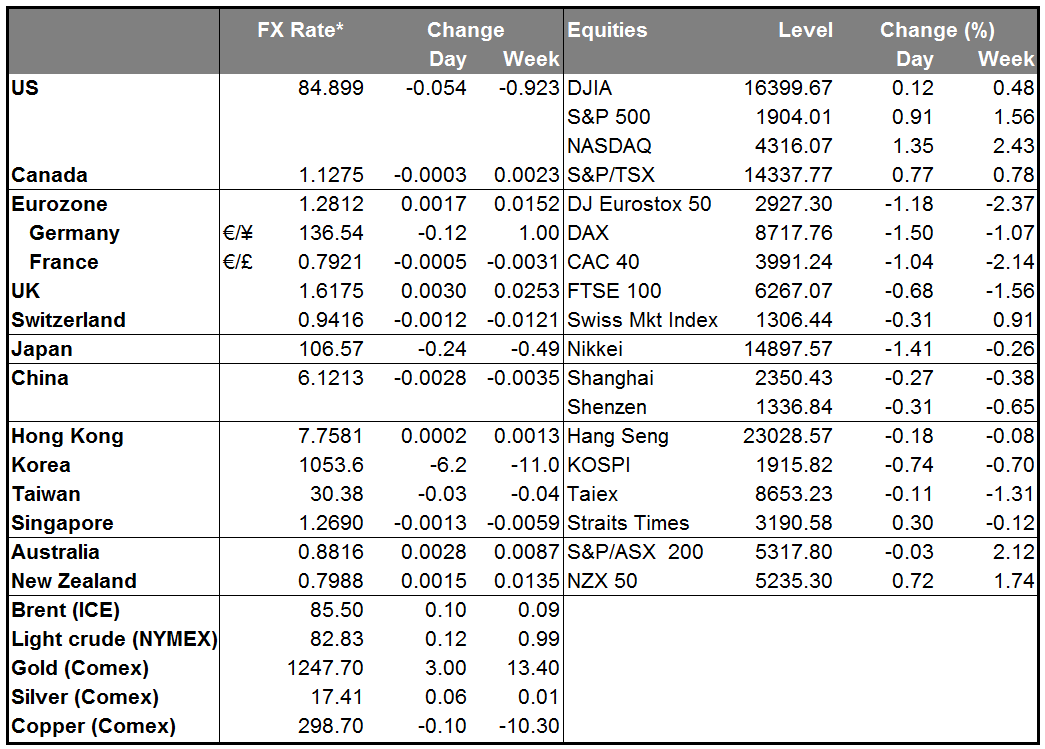
EUR/USD rebounds
EUR/USD rebounded from near the 50-period moving average on Monday. However, the pair remained capped by the 200-period moving average. Seeing that the rate remains within the upside black channel and above the prior blue downtrend line, I still see the likelihood that the recovery from 1.2500 (S3) may extend higher. Hence, I would consider the short-term bias to remain cautiously positive. But only a clear break above the 1.2900 (R1) hurdle could trigger a strong leg up, in my view, perhaps towards the psychological line of 1.3000 (R2). As for the bigger picture, on the daily chart the price structure still suggests a downtrend, thus I retain the view that the near-term advances are a corrective phase of the longer-term down path.
• Support: 1.2700 (S1), 1.2600 (S2), 1.2500 (S3)
• Resistance: 1.2900 (R1), 1.3000 (R2), 1.3100 (R3)
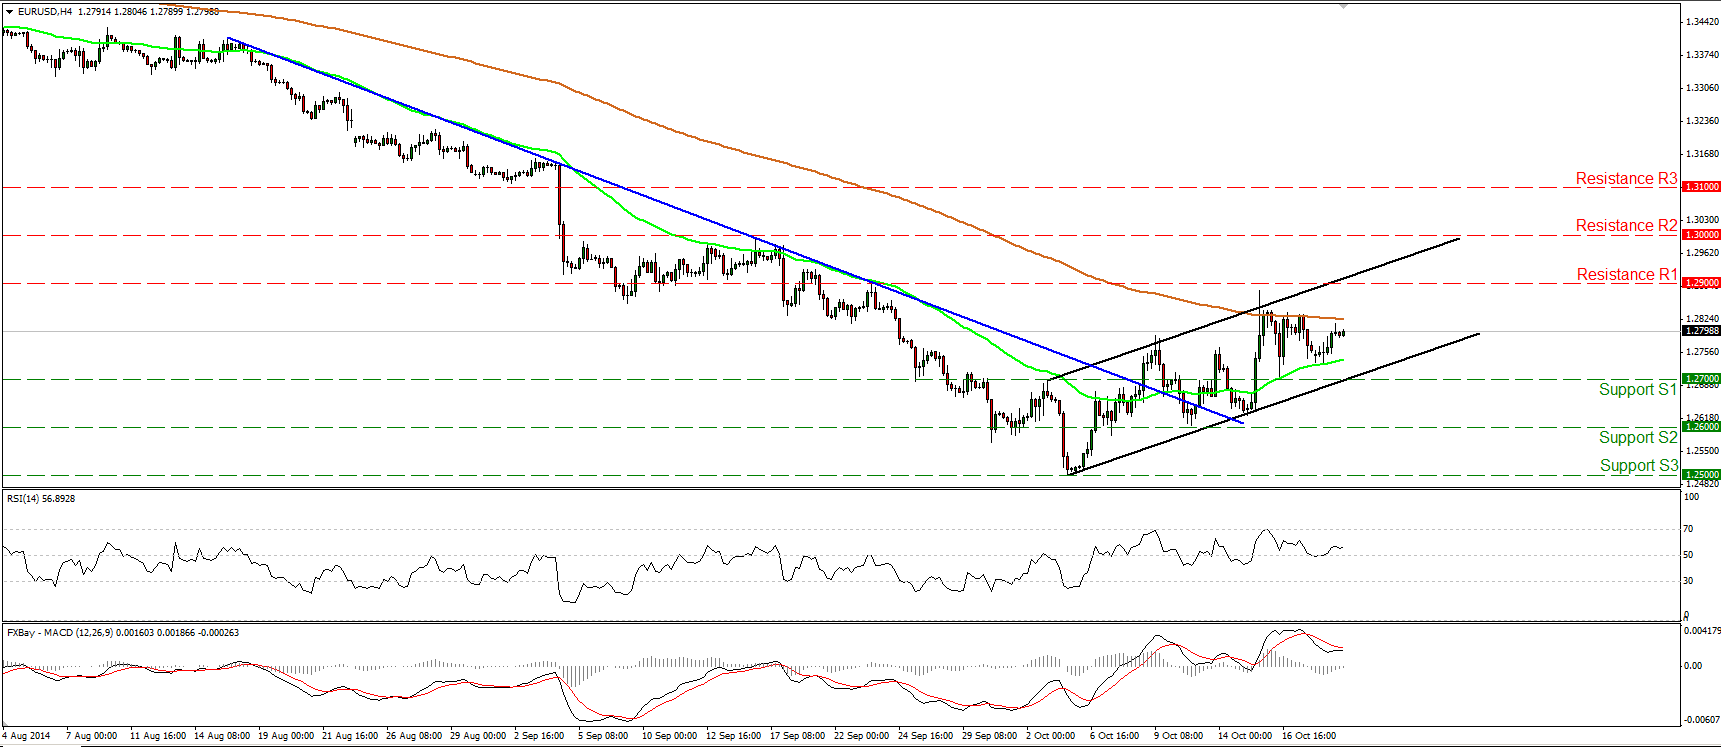
GBP/JPY hits the 38.2% retracement level
GBP/JPY moved in a consolidative mode remaining capped by the key resistance of 173.00 (R1), which lies fractionally above the 38.2% retracement level of the 19th of September – 15th of October down move. A clear dip below the 171.70 (S1) line is likely to confirm that the 15th - 20th of October up leg was just a 38.2% correction and that the bias is turned back to the downside. Such a move could probably to target the 170.15 (S2) support first. The technical oscillators both point to the inability of the bulls to move above the 173.00 (R1) hurdle. The RSI turned down after finding resistance below its 70 line, while the MACD shows signs of topping and could move below its trigger in the near future.
• Support: 171.70 (S1), 170.15 (S2), 168.00 (S3)
• Resistance: 173.00 (R1), 175.00 (R2), 176.60 (R3)
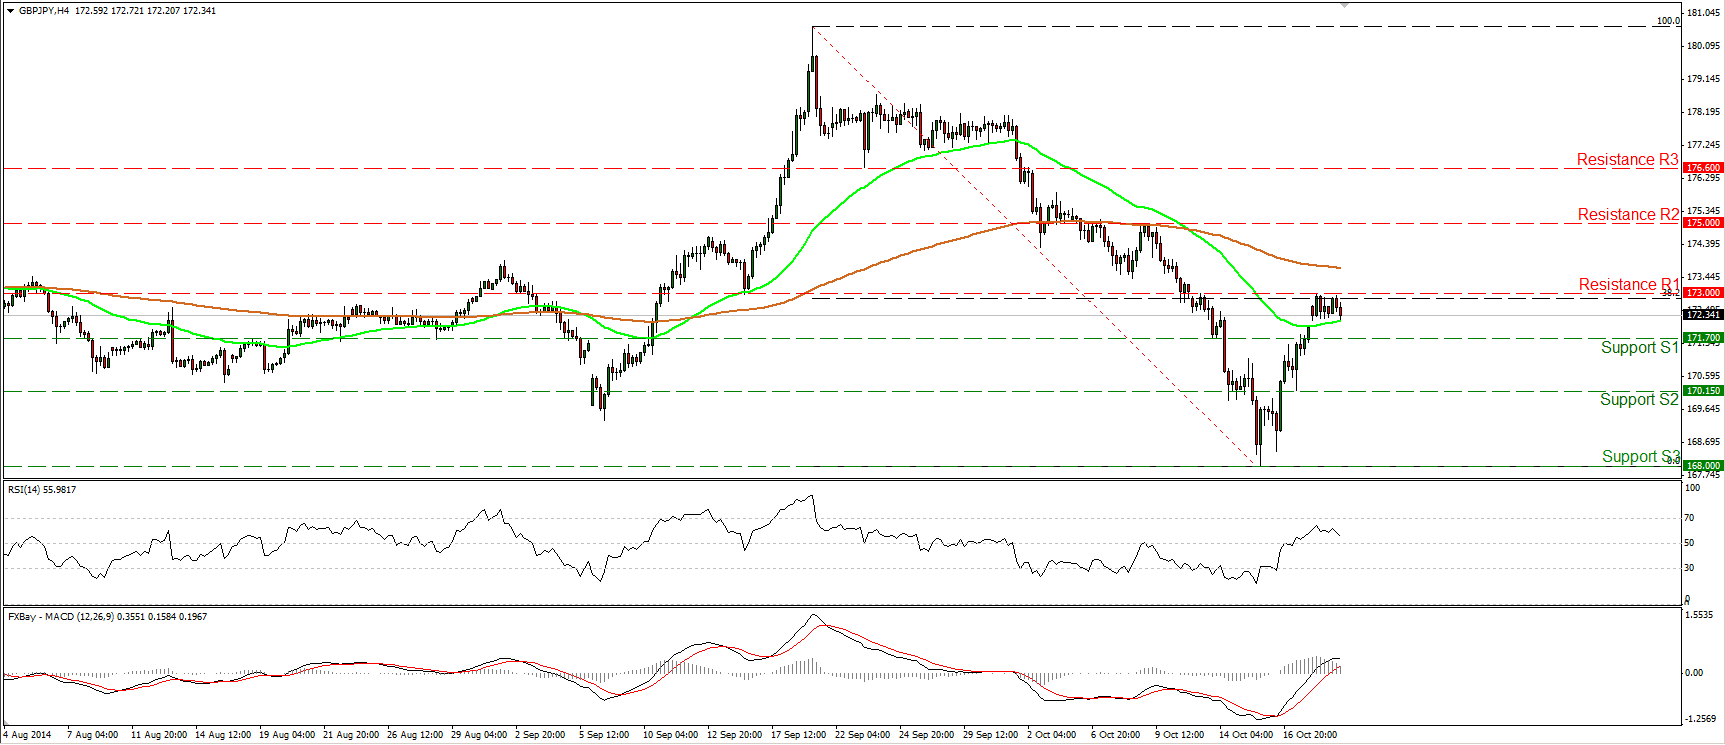
AUD/USD remains within a range
AUD/USD moved higher during the Asian morning Tuesday after China’s Q3 GDP came out better than the market consensus. Nevertheless, the rate remains within a sideways range between the 0.8640 (S2) support obstacle and the resistance of 0.8900 (R2). Our momentum studies support investors’ indecisiveness and the difficulty of choosing a direction. The MACD remains near its zero line, while the RSI lies near its 50 level. On the daily chart, although the rate remains below both the 50- and the 200-day moving averages, the 14-day RSI moved higher and is getting closer to its 50 line, while the MACD lies above its trigger and is pointing up. These momentum signs give me extra reasons to stay flat and wait for the pair to exit the sideways path.
• Support: 0.8700 (S1), 0.8640 (S2), 0.8565 (S3)
• Resistance: 0.8830 (R1), 0.89000 (R2), 0.9000 (R3)
Gold rebounds from near 1235
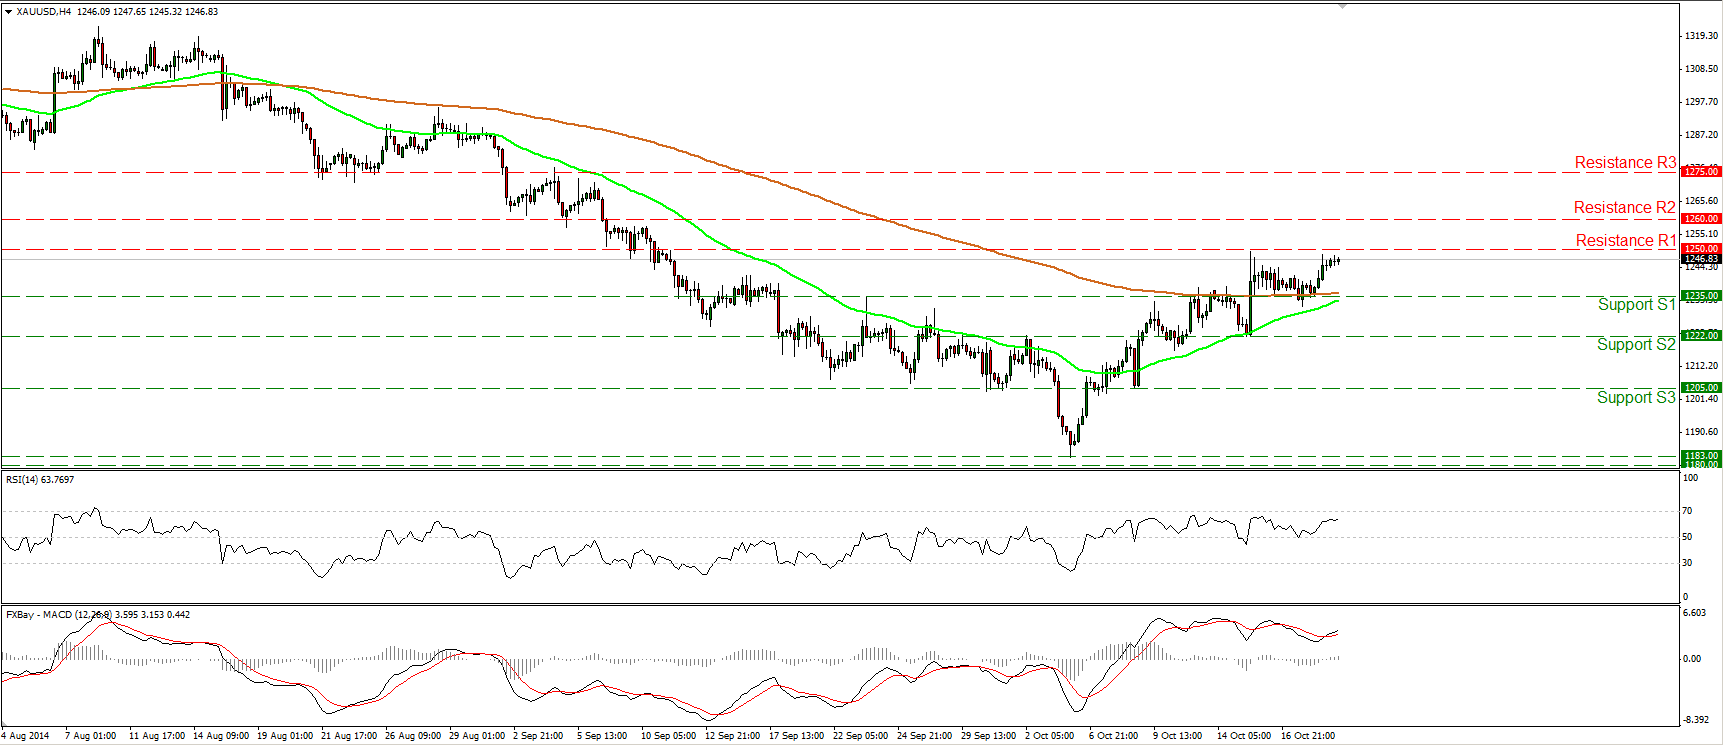
Gold rebounded from near the 1235 (S1) line yesterday, which coincides with the 200-period moving average. During the early European morning the precious metal is trading slightly below the resistance barrier of 1250 (R1), where a clear break could see scope for extensions towards the next obstacle of 1260 (R2). Taking a look at our short-term momentum studies, I see that the RSI rebounded from its 50 line and moved higher, while the MACD, already positive moved above its signal line. This indicates bullish momentum and amplifies the case for further bullish extensions in the close future. Our daily oscillators corroborate the positive near-term picture. The 14-day RSI remains above 50 and is moving higher, while the daily MACD, already above its trigger, turned positive.
• Support: 1235 (S1), 1222 (S2), 1205 (S3)
• Resistance: 1250 (R1), 1260 (R2), 1275 (R3)
WTI stays within its recent range
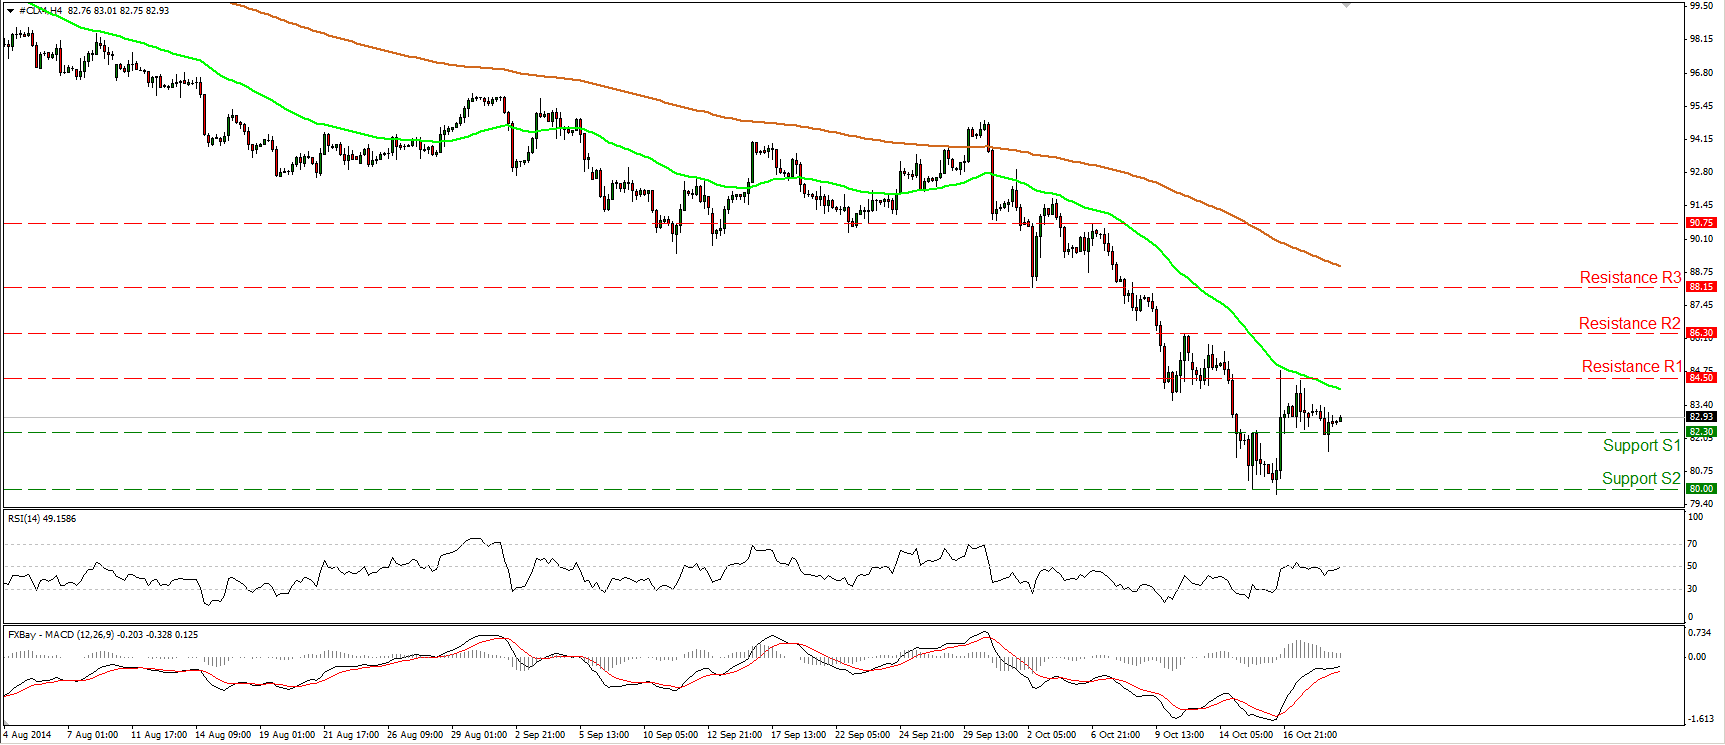
WTI moved slightly lower, but after waking some buyers below the 82.30 (S1) line, it rebounded somewhat. I see the possibility for a higher low near that area, but the price remains within the range between the 82.30 (S1) barrier and the resistance of 84.50 (R1). A move above the latter hurdle is likely to confirm a forthcoming higher high on the 4-hour chart and flip the short-term picture positive. Such a move could probably see scope for extensions towards the next resistance at 86.30 (R2). However the price structure on the daily chart still suggests a downtrend, thus I would treat any future advances as a corrective phase, at least for now.
• Support: 82.30 (S1), 80.00 (S2), 77.50 (S3)
• Resistance: 84.50 (R1), 86.30 (R2), 88.15 (R3)
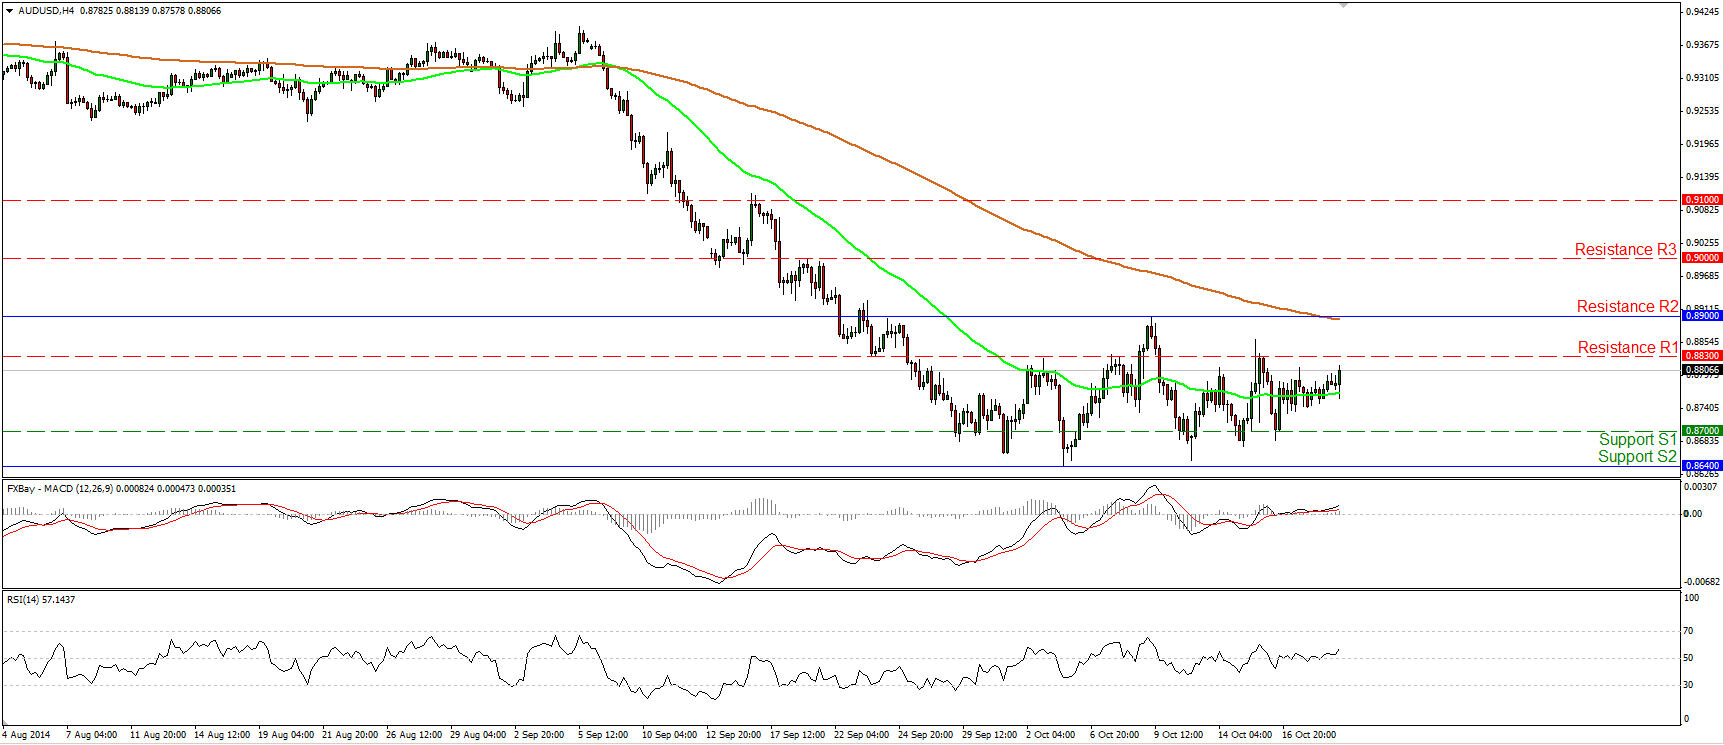
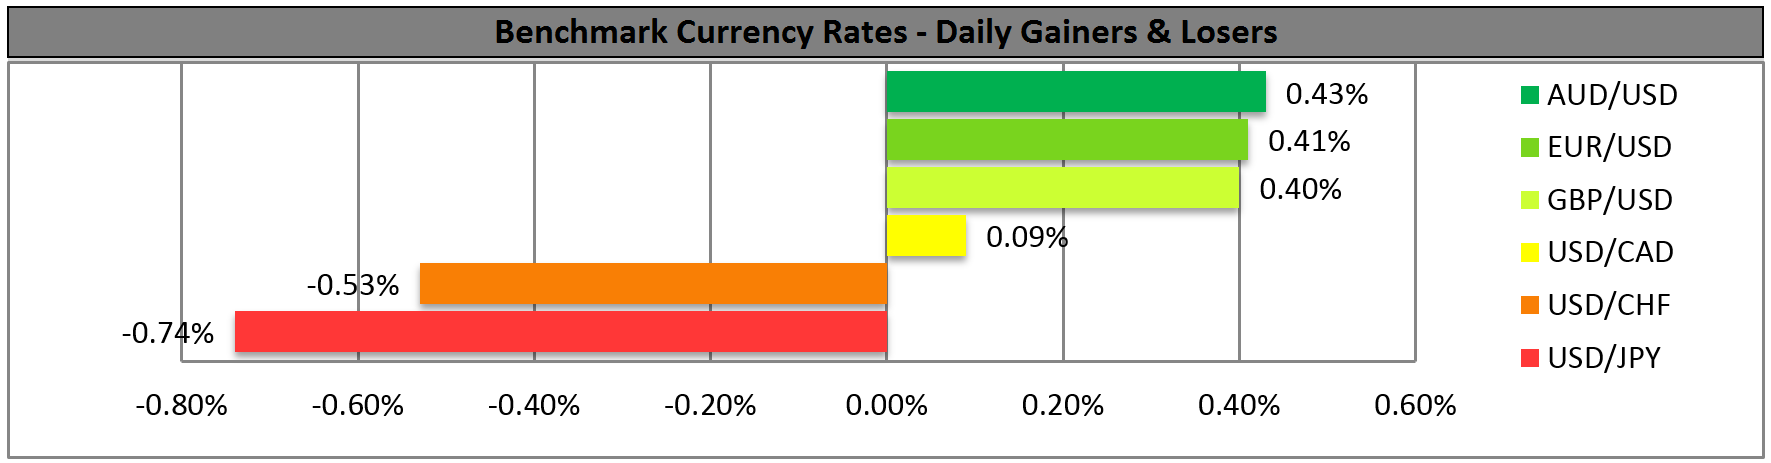
BENCHMARK CURRENCY RATES - DAILY GAINERS AND LOSERS
MARKETS SUMMARY