
EUR/USD hits 1.3500 and rebounds
EUR/USD declined somewhat on Friday to hit the 1.3500 (S1) barrier. The rate found some buy orders below that psychological barrier and rebounded slightly to trade near 1.3530. Bearing in mind that we can identify positive divergence between the RSI and the price action, and that the MACD moved above its signal line and is now pointing up, I would expect the rebound to continue, maybe to challenge the 1.3580 (R2) as a resistance this time. On the daily chart, I see a possible hammer candle, amplifying the case for the continuation of the upside corrective wave. Nevertheless, I would keep a neutral stance as far as the overall trend of the pair is concerned. The rate is trading below the blue downtrend line, but we need to see if the sellers are strong enough to overcome the 1.3500-1.3475 zone before expecting larger bearish extensions in the future.
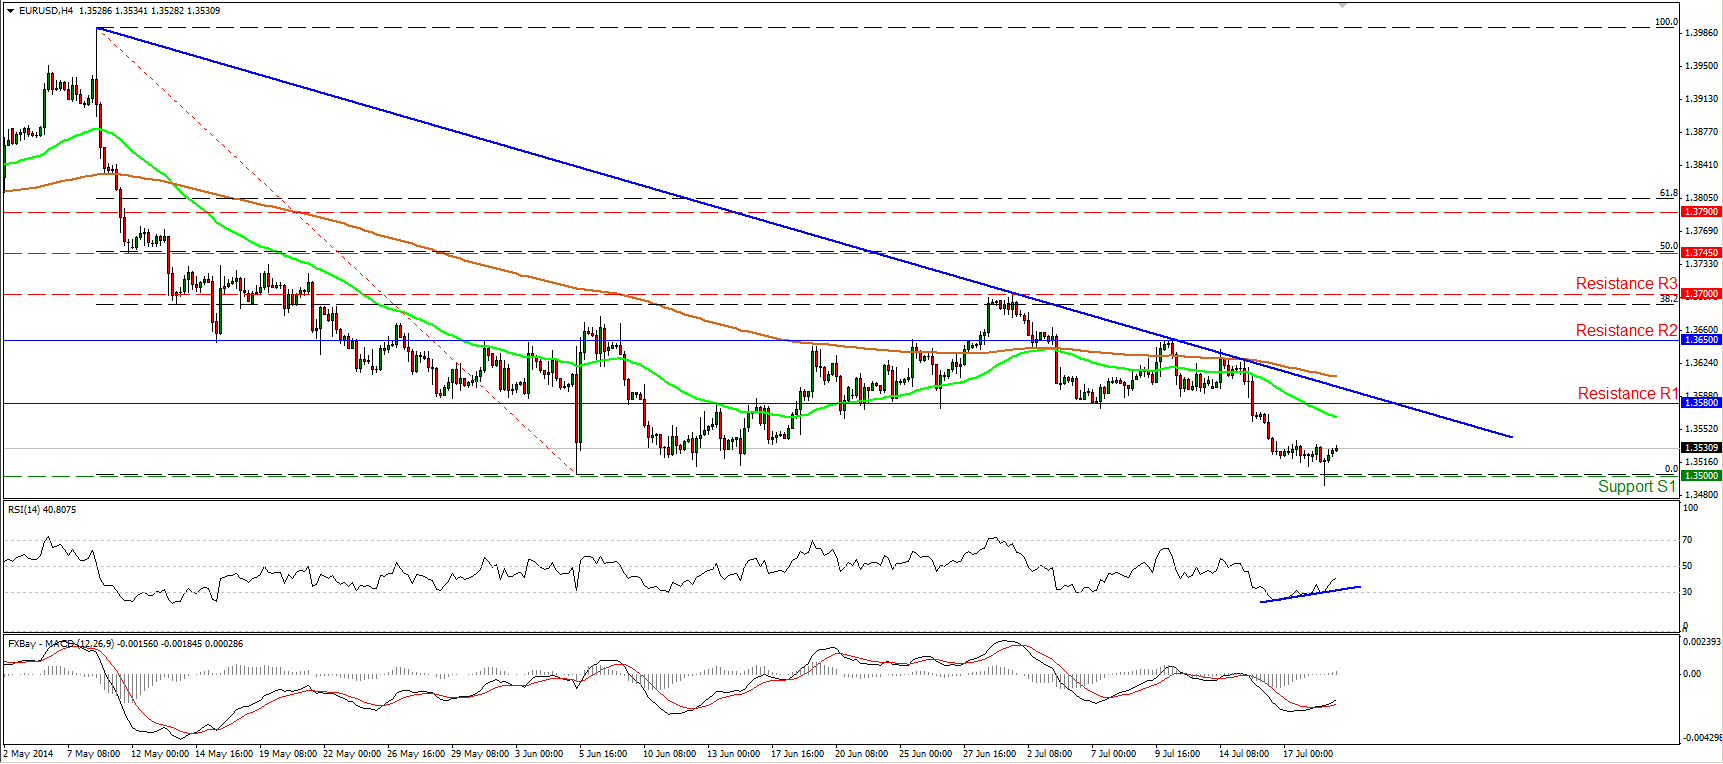
• Support: 1.3500 (S1), 1.3475 (S2), 1.3400 (S3).
• Resistance: 1.3580 (R1), 1.3650 (R2), 1.3700 (R3).
EUR/JPY hits the 136.75 support
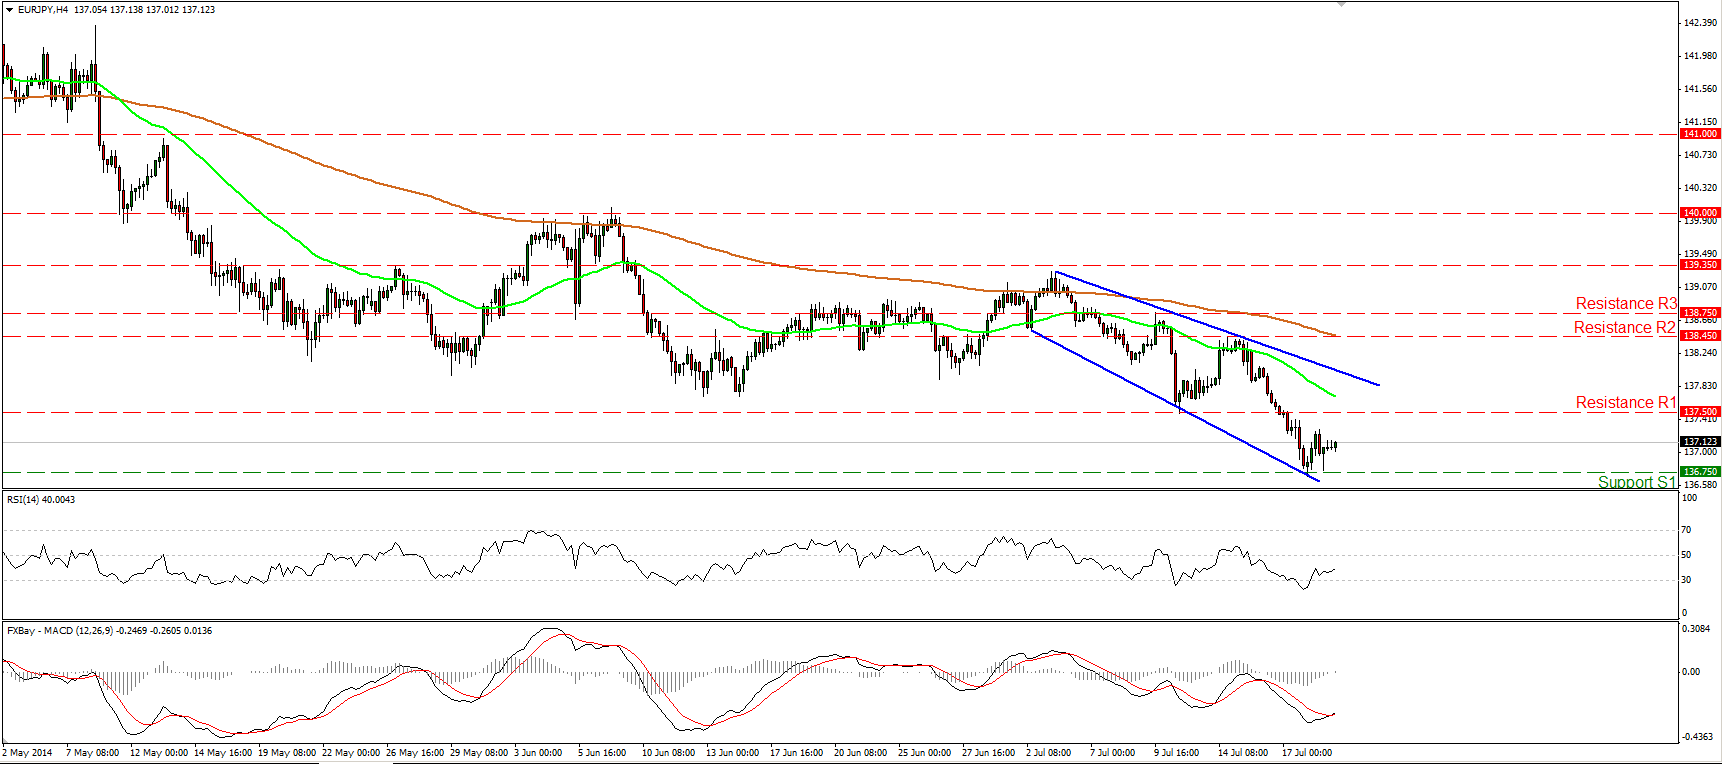
EUR/JPY declined significantly, breaking below the 137.50 zone (support turned into resistance) and met our next barrier at 136.75 (S1). This move confirms a lower low and keeps the short-term picture negative. Considering that the RSI moved somewhat higher after exiting overbought conditions and that the MACD, although in its negative territory crossed above its trigger line, I would expect the forthcoming wave to be to the upside. However, as long as the rate is trading below the blue downtrend line and below both the moving averages, the short-term trend remains to the downside and I would see any possible advances as retracements for now.
• Support: 136.75 (S1), 136.20 (S2), 135.00 (S3).
• Resistance: 137.50 (R1), 138.45 (R2), 138.75 (R3).
Is GBP/USD ready to retrace?

GBP/USD moved lower on Friday, but after finding support at 1.7035 (S1) it recovered most of the lost ground. Despite the fact that the pair has remained trendless since 1 July, the negative divergence between our momentum studies and the price action indicate that GBP/USD may be topping and this keeps the near-term outlook mildly to the downside. However, in the bigger picture, the 80-day exponential moving average provides reliable support to the lows of the price action, keeping the long-term path to the upside. Thus I would consider any possible near term declines as a correcting phase of the major uptrend.
• Support: 1.7035 (S1), 1.7000 (S2), 1.6950 (S3).
• Resistance: 1.7115 (R1), 1.7190 (R2), 1.7300 (R3).
Gold finds support at 1305
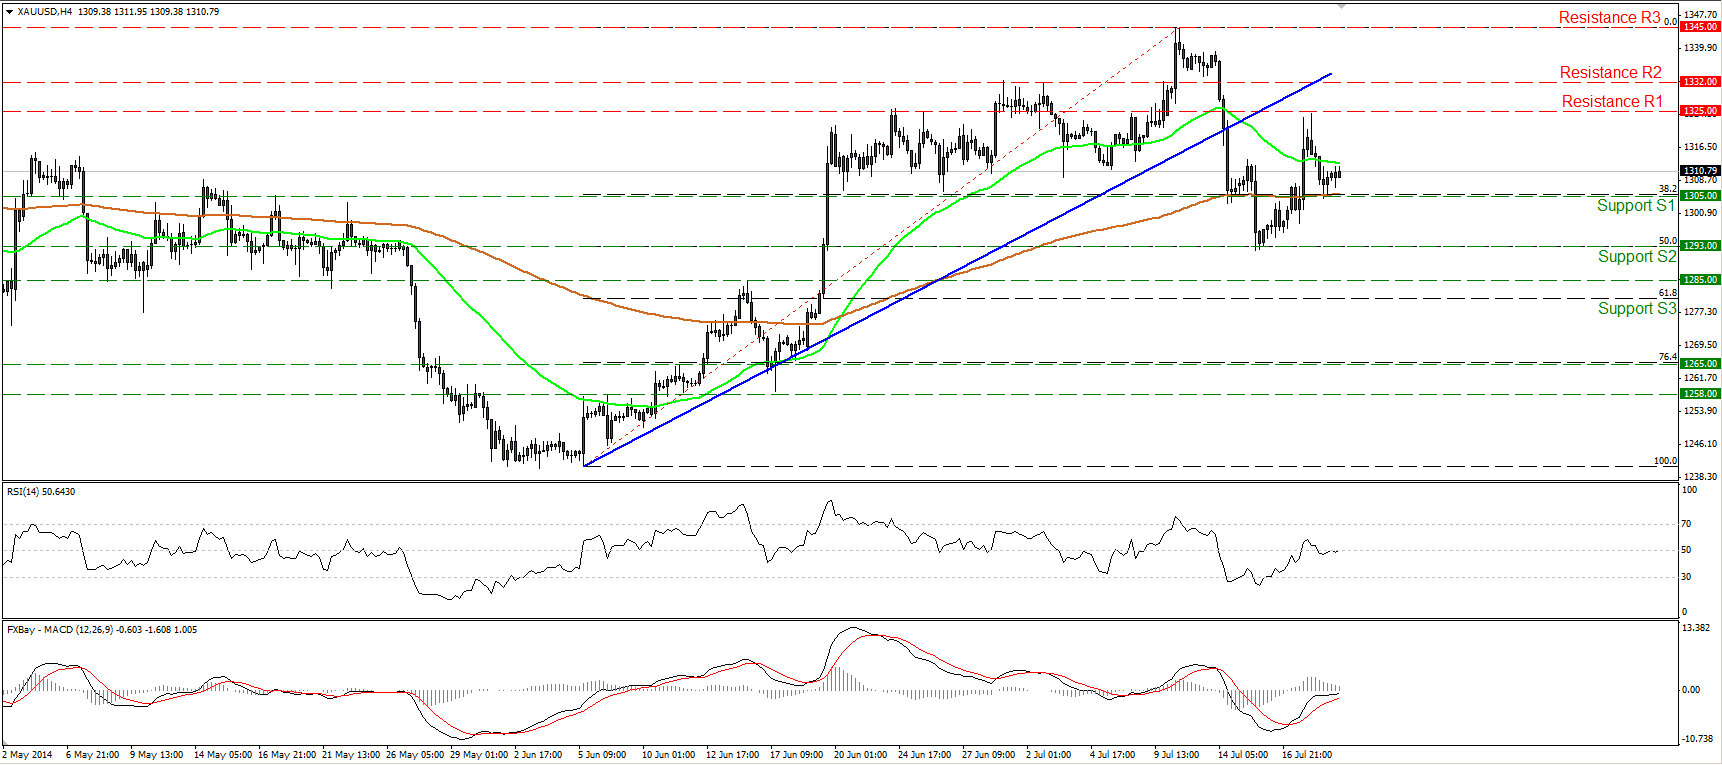
Gold tumbled on Friday but the decline was halted by the support of 1305 (S1), which coincides with the 200-period moving average. A rebound from that zone is likely to target once again the resistance of 1325 (R1). Nevertheless, our momentum studies give neutral signals. The RSI remains lies near its 50 line, while the MACD remains slightly below its zero line but is pointing sideways. Moreover, on the daily chart both the 50- and the 200-day moving averages are pointing sideways, adding to the unclear picture of the precious metal.
• Support: 1305 (S1), 1293 (S2), 1285 (S3).
• Resistance: 1325 (R1), 1332 (R2), 1345 (R3).
WTI pulls back
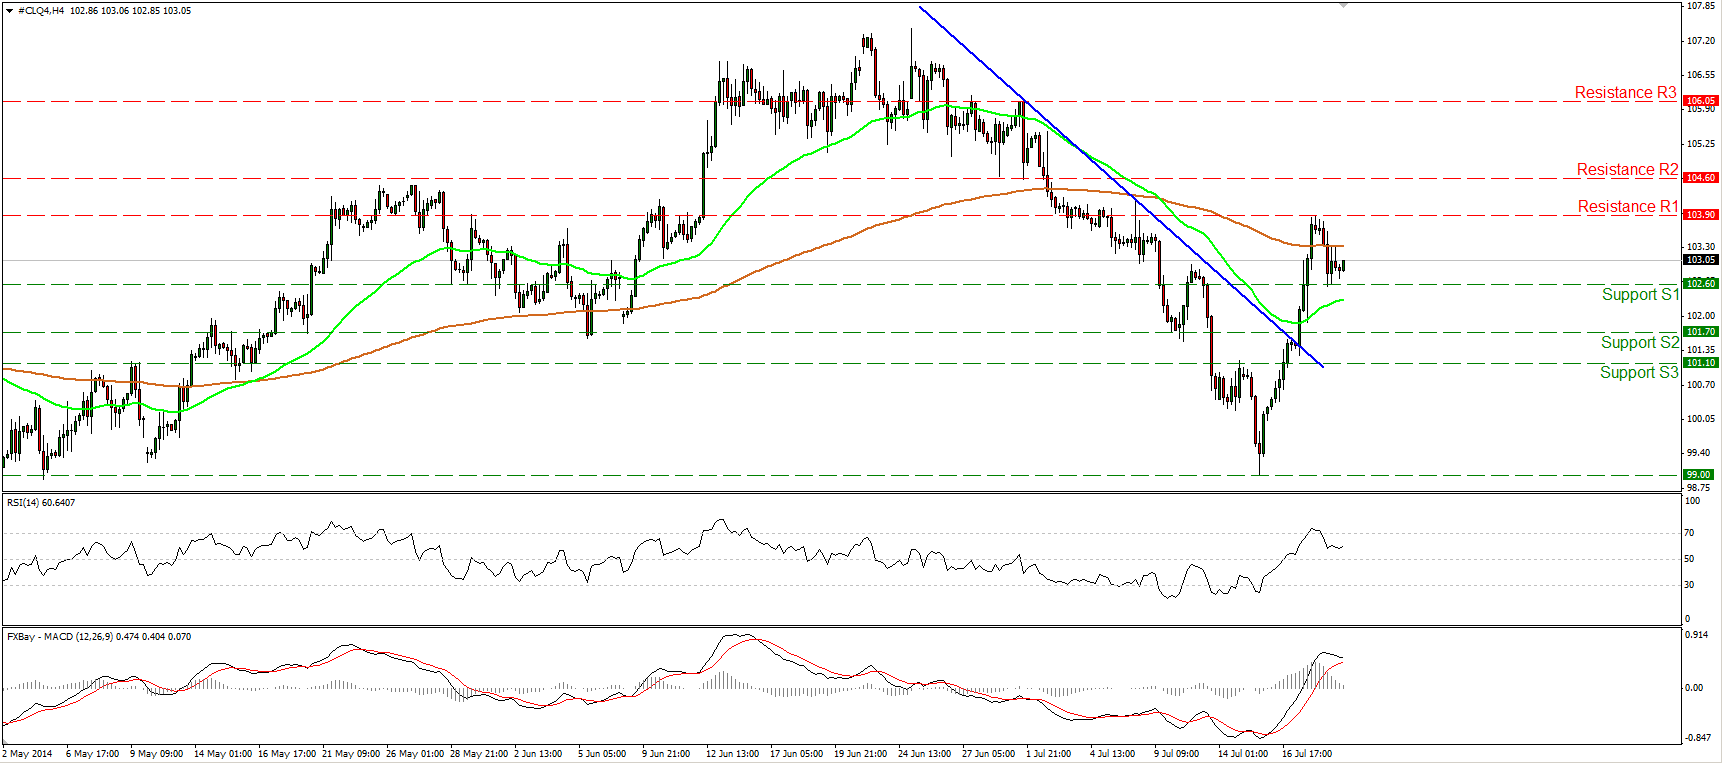
WTI pulled back after finding resistance at 103.90 (R1) and the decline met support at 102.60 (S1). The possibility for a higher low still exists and as a result I would consider Friday’s decline as a corrective wave of the prevailing strong rally. A rebound near the 102.60 zone could target again the 103.90 (R1) barrier, where an upside violation would confirm a forthcoming higher high and is likely to challenge the next resistance at 104.60 (R2). Zooming on the 1-hour chart, the 14-hour RSI seems ready to move above 50, while the hourly MACD shows signs of bottoming and a cross above its zero and signal lines is possible. This magnifies the case for a rebound and a higher low in the near future.
• Support: 102.60 (S1), 101.70 (S2), 101.10 (S3).
• Resistance: 103.90 (R1), 104.60 (R2), 106.05 (R3).
BENCHMARK CURRENCY RATES - DAILY GAINERS AND LOSERS
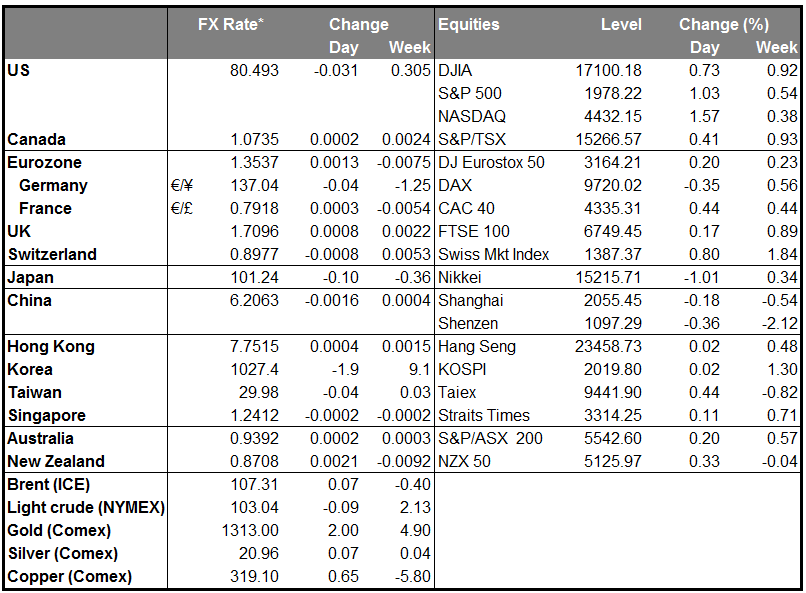
MARKETS SUMMARY