EUR/USD pulls back again
EUR/USD moved lower on Friday after finding resistance near the 200-period moving average. However, the fall was halted above the 1.2700 (S1) line, near the 50-period moving average. As long as the rate remains within the upside black channel and above the prior downtrend line, I still see the possibility that the recovery from 1.2500 (S3) may extend higher. Hence, I would consider the short-term bias to remain cautiously positive. But only a clear break above the 1.2900 hurdle could trigger a strong leg up, in my view, perhaps towards the psychological line of 1.3000 (R2). As for the bigger picture, on the daily chart the price structure still suggests a downtrend, thus I retain the view that the near-term advances are a corrective phase of the longer-term down path.
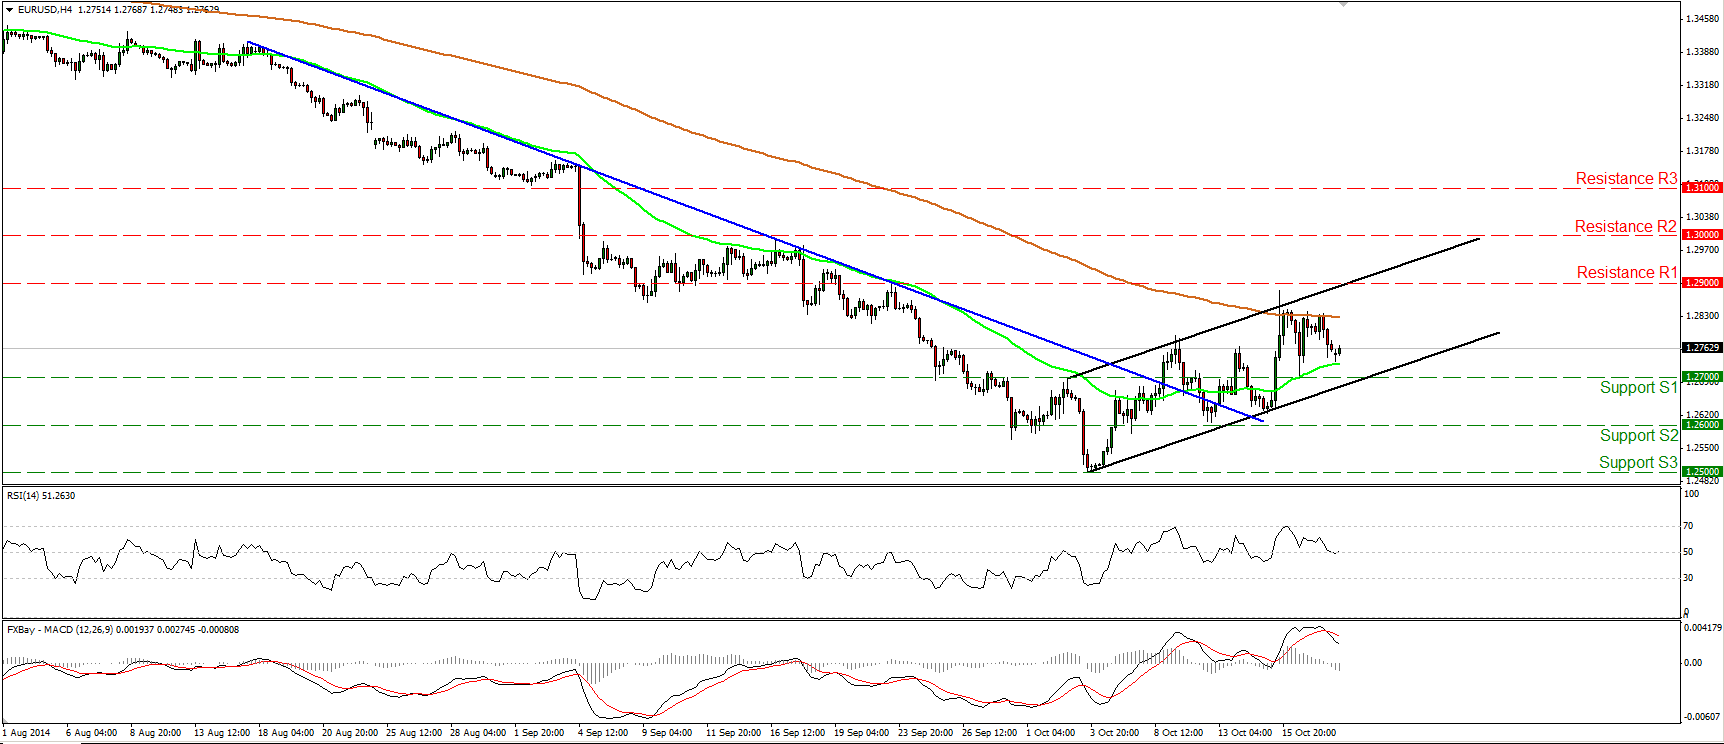
• Support: 1.2700 (S1), 1.2600 (S2), 1.2500 (S3).
• Resistance: 1.2900 (R1), 1.3000 (R2), 1.3100 (R3).
EUR/JPY breaks above 136.70
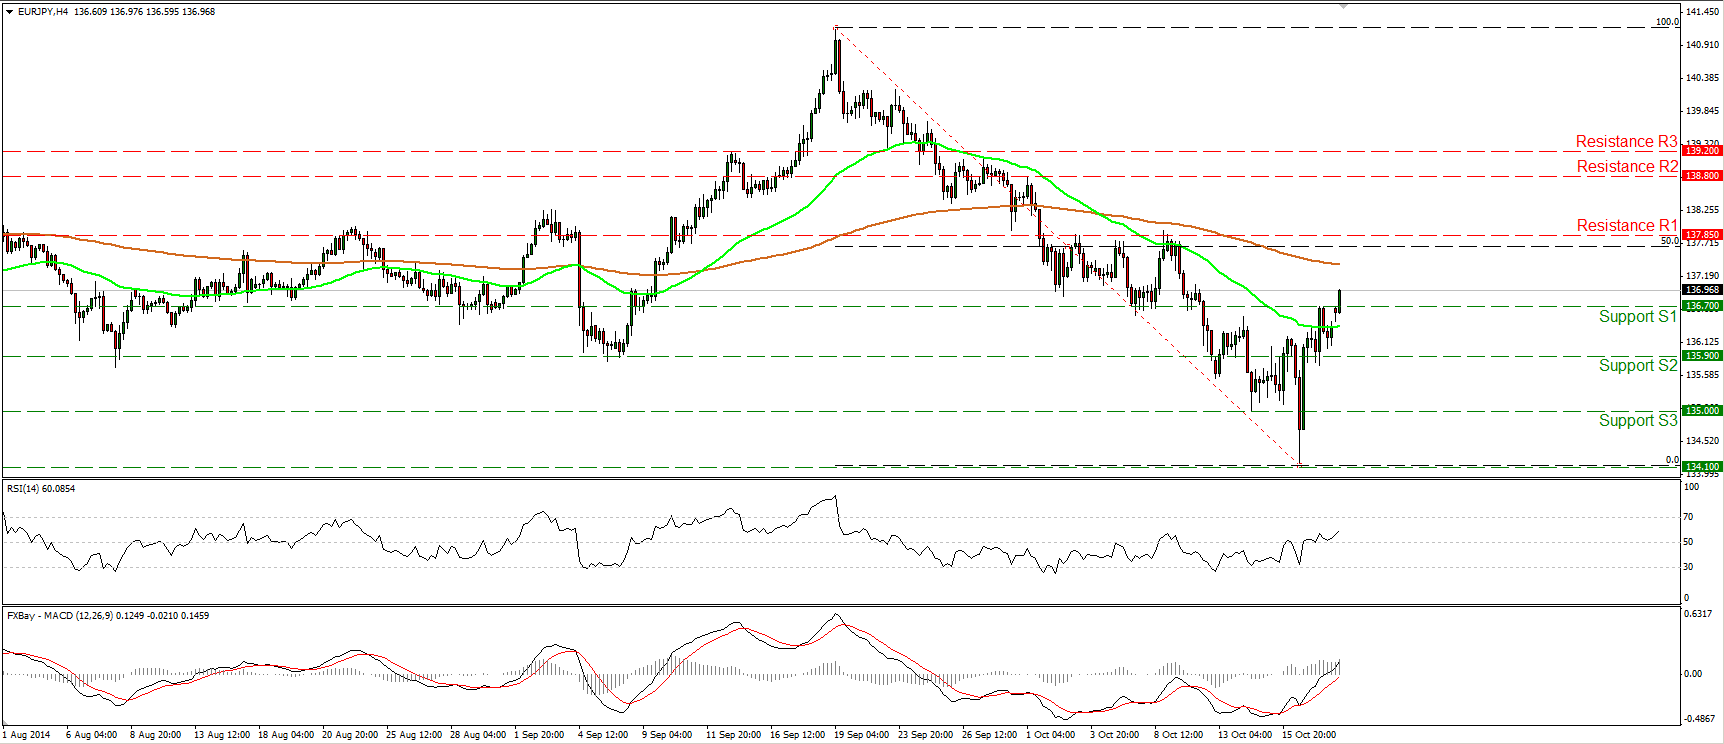
EUR/JPY moved higher on Friday and today, during the Asian morning, the bulls managed to violate the resistance (turned into support) hurdle of 136.70 (S1). I would expect such a move to set the stage for extensions towards the next obstacle at 137.85 (R1), which lies near the 50% retracement level of the 19th September – 16th October decline. Our short-term momentum studies support the notion. The RSI rebounded from near its 50 line and is now pointing up, while the MACD lies above both its zero and signal lines. On the daily chart, the 14-day RSI moved higher and is getting closer to its 50 line, while the daily MACD has bottomed and appears willing to move above its trigger line in the close future, amplifying the case for further upside. However, the rate remains below the 200-day moving average, which currently coincides with the 50% retracement level of the aforementioned down wave, thus I would consider the recent advance or any extensions of it as a corrective move for the moment.
• Support: 136.70 (S1), 135.90 (S2), 135.00 (S3).
• Resistance: 137.85 (R1), 138.80 (R2), 139.20 (R3).
GBP/USD remains below the resistance of 1.6130
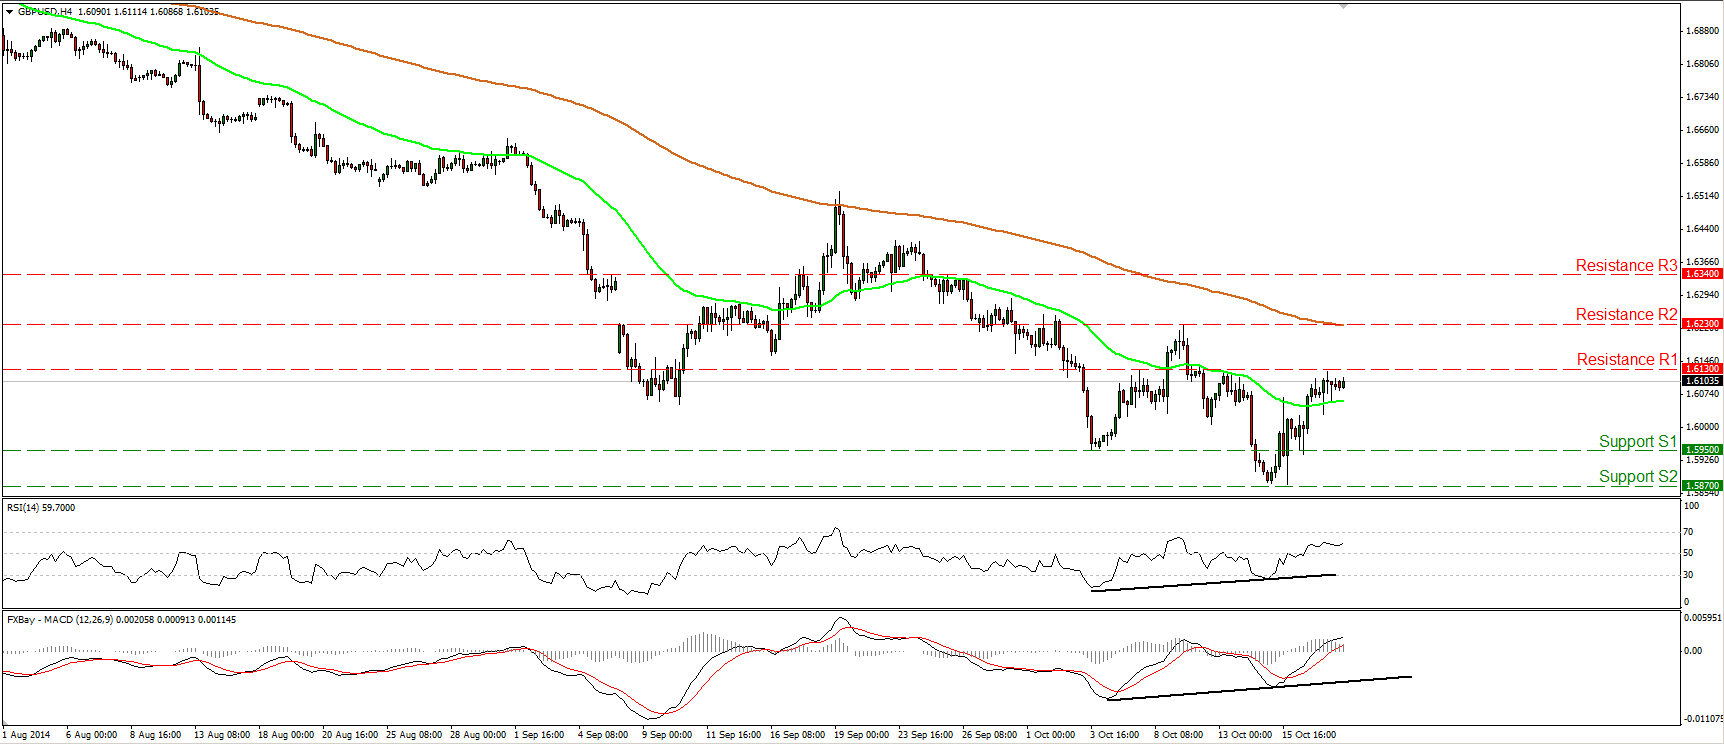
GBP/USD moved fractionally higher on Friday, remaining slightly below the resistance hurdle of 1.6130 (R1). A clear and decisive move above that line could pave the way towards the next obstacle at 1.6230 (R2), which now coincides with the 200-period moving average. The RSI remains above its 50 line and the MACD remains above both its zero and trigger lines, indicating positive momentum. Moreover, on the daily chart, the price appears willing to escape from a falling wedge formation [a move above 1.6130 (R1) is likely to confirm the break out], and I also see positive divergence between the daily momentum indicators and the price action. However, I still believe that as long as Cable remains below the 80-day exponential moving average, the trend remains to the downside. Hence, I would treat any future bullish waves as a retracement.
• Support: 1.5950 (S1), 1.5870 (S2), 1.5720 (S3).
• Resistance: 1.6130 (R1), 1.6230 (R2), 1.6340 (R3).
WTI stays virtually unchanged
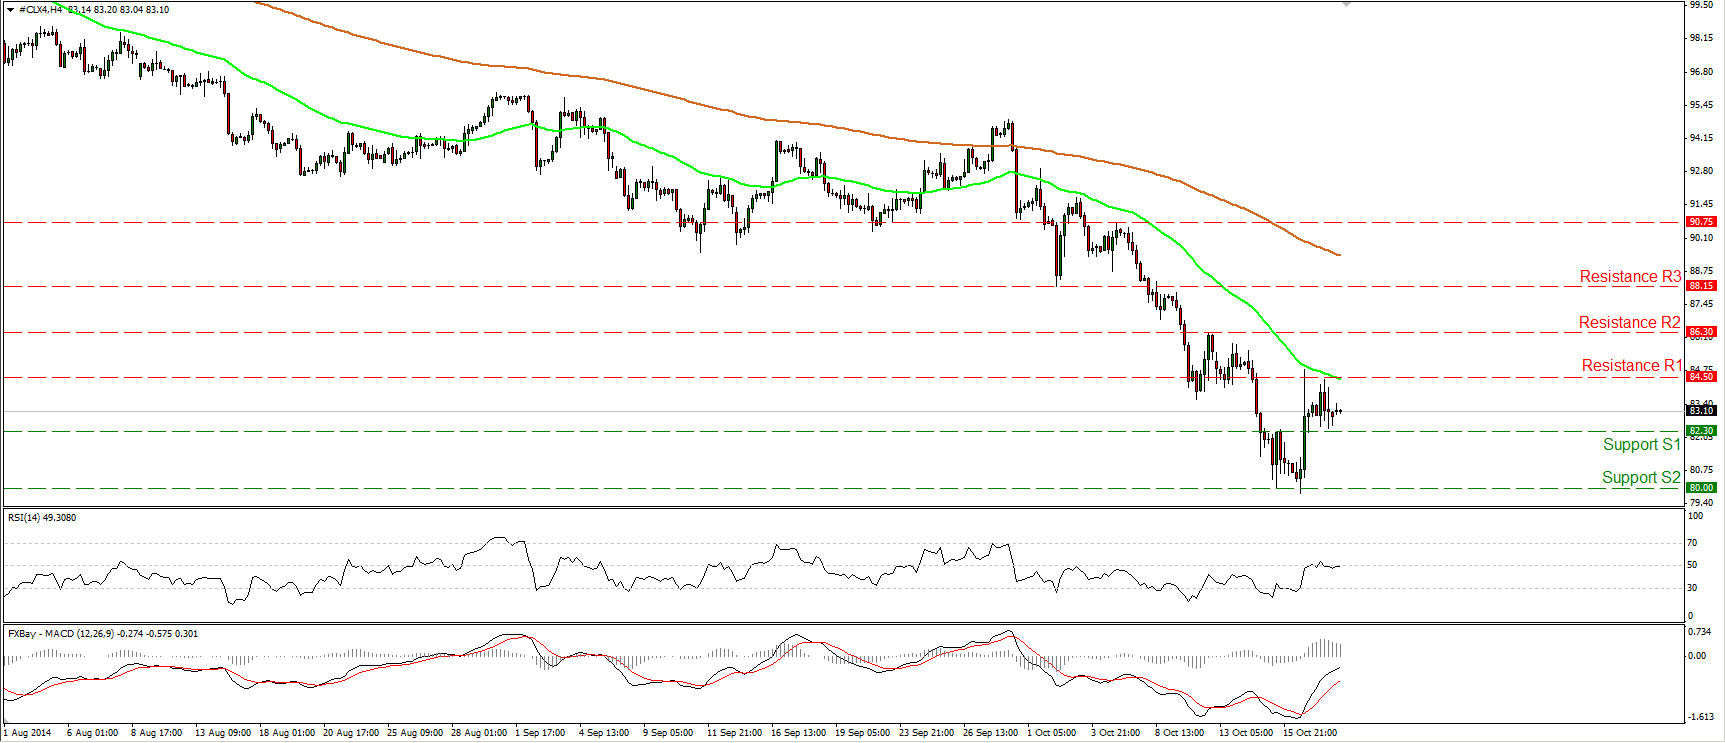
WTI moved in a consolidative mode, staying between the support line of 82.30 (S1) and the resistance of 84.50 (R1). The price structure remains lower highs and lower lows below both the 50- and the 200-period moving averages, keeping the downtrend intact. However, given the strong rebound from the 80.00 (S2) zone on Thursday, I would prefer to adopt a “wait and see” approach for now. On the daily chart, the 14-day RSI exited its oversold field, while the daily MACD seems to be bottoming. These momentum signs give me extra reasons to remain neutral. I would prefer to see a strong move below the psychological hurdle of 80.00 (S2) before getting more confident on the downside. On the upside, a break above 84.50 (R1) could turn the near-term bias to the upside and could target the next resistance at 86.30 (R2).
• Support: 82.30 (S1), 80.00 (S2), 77.50 (S3).
• Resistance: 84.50 (R1), 86.30 (R2), 88.15 (R3) .
Gold moves sideways

Gold moved quietly on Friday, remaining slightly above the 1235 (S1) line and the 200-period moving average. I still expect the bulls to pull the trigger and target the resistance obstacle of 1260 (R2). On the daily chart, the 14-day RSI remains above its 50 line while the daily MACD, already above its trigger line, is getting closer to its zero line and could get a positive sign in the near future. This supports the scenario for further advances in the near future. Nonetheless, coming back to the 4-hour chart, although the RSI found support at its 50 line, the MACD remains below its trigger and is pointing down. Thus I would remain mindful of a possible pullback before buying pressure prevails.
• Support: 1235 (S1), 1222 (S2), 1205 (S3).
• Resistance: 1250 (R1), 1260 (R2), 1275 (R3).
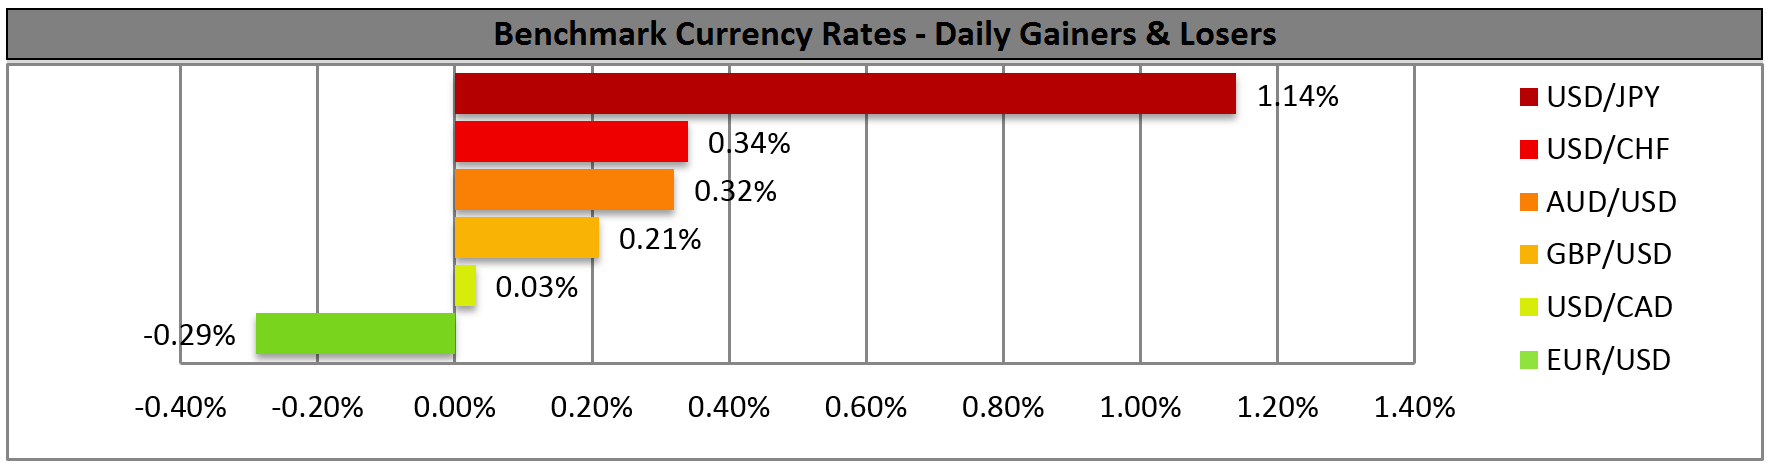
BENCHMARK CURRENCY RATES - DAILY GAINERS AND LOSERS
MARKETS SUMMARY