GBP/USD hours before the vote
GBP/USD fell after the FOMC decision, but remained within the purple minor-term upside channel. The current picture still suggest that the pair is in a retracing mode. The rate is still printing higher highs and higher lows within the aforementioned channel, but remains below the blue downtrend line drawn from the high of the 15th of July. Whether the technical downtrend continues will depend on the results of the referendum. Technically, to have a lower low on the daily chart we have to see a dip below the support line of 1.6070 (S2) (I would prefer a dip below the psychological line of 1.6000 (S3)). A “yes” vote could be the trigger for such a move, and could see as an initial objective the support line of 1.5860, the low of the 12th of November 2013, of the resistance-turned-into-support line of 1.5725, determined by the highs of June and August 2013, which also coincides with the 61.8% retracement level of the July 2013 – July 2014 advance. However, having in mind that a “yes” vote will have a lot of negative implications for the UK, I doubt that these bars could hold. (We may have some pauses there, or corrections to provide renewed selling opportunities). In the longer-run, Cable could reach the major support zone of 1.4815, defined by the lows of March and July 2013. The last time we saw the pair below that area was back in 2010. Now, let’s take the scenario of the “no” vote. The market is already discounting a “no” (the market has already retraced some of the current downtrend), thus I don’t expect a “no” vote to affect the pair as much as a “yes” would. The “no” could cause the rate to rally, perhaps towards the psychological zone of 1.6500 (R3). If the bulls are in a mood to overcome that barrier, I would expect them to target the resistance of 1.6645.
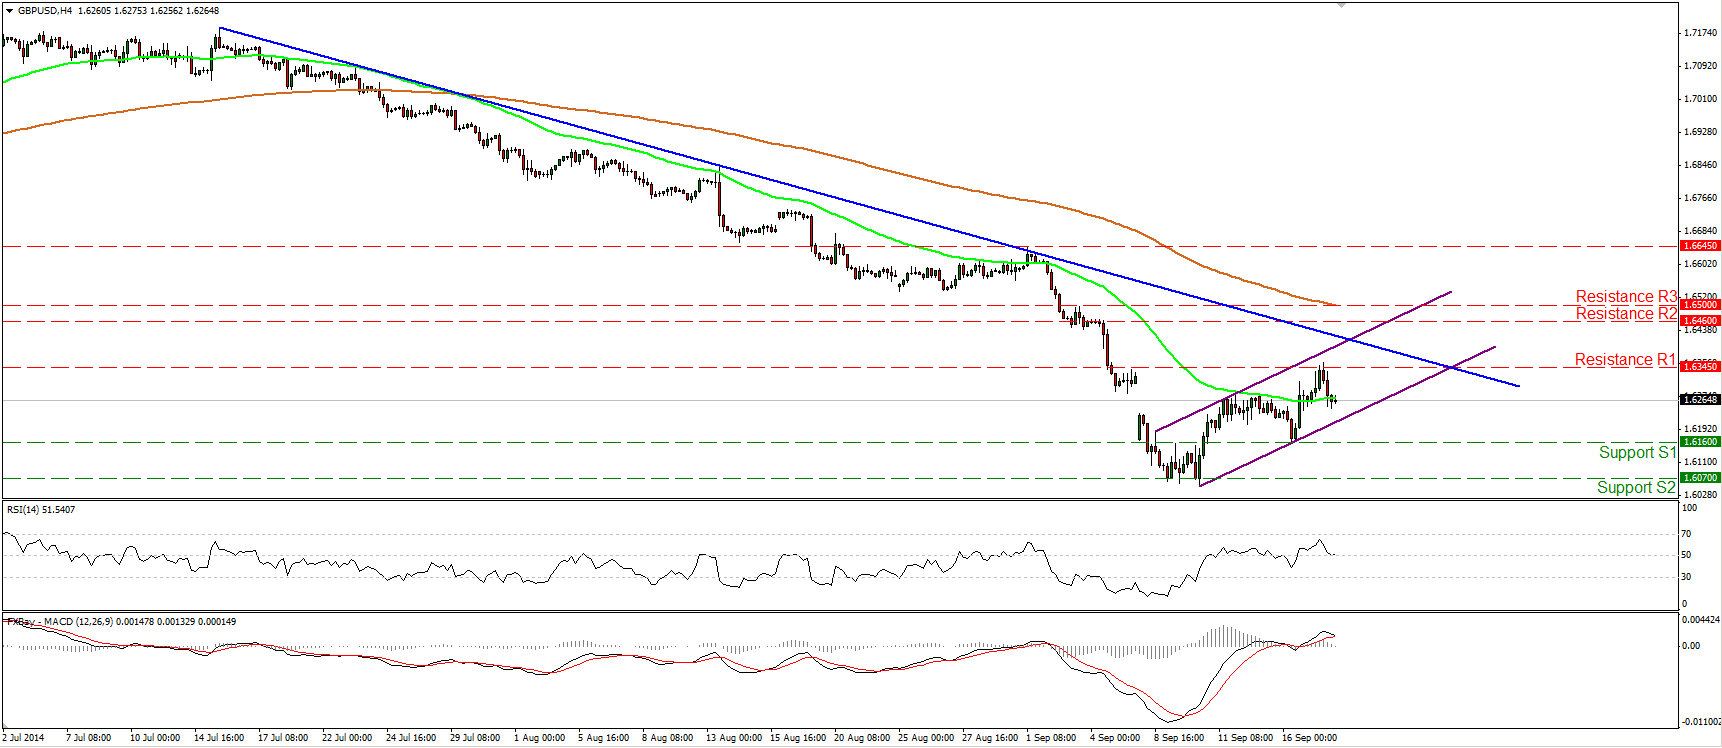
• Support: 1.6160 (S1), 1.6070 (S2), 1.6000 (S3)
• Resistance: 1.6315 (R1), 1.6460 (R2), 1.6500 (R3)
• (These are the near-term levels, based on the 4-hour chart)
EUR/USD collapses after the FOMC decision

EUR/USD fell sharply yesterday despite the Fed keeping its language regarding the rate hike unchanged. The pair plunged to find some buy orders slightly below our support line of 1.2860 (S1), before rebounding somewhat. On the daily chart, as long as I see the pair printing lower highs and lower lows below both the 50- and the 200-day moving averages, I see a negative overall picture. I still believe that a clear close below the 1.2860 (S1) zone in the near future is likely to set the stage for extensions towards the key support zone of 1.2760 (S2), defined by the lows of March and July 2013.
• Support: 1.2860 (S1), 1.2760 (S2), 1.2660 (S3)
• Resistance: 1.3000 (R1), 1.3100 (R2), 1.3160 (R3)
GBP/JPY shoots above 176.00
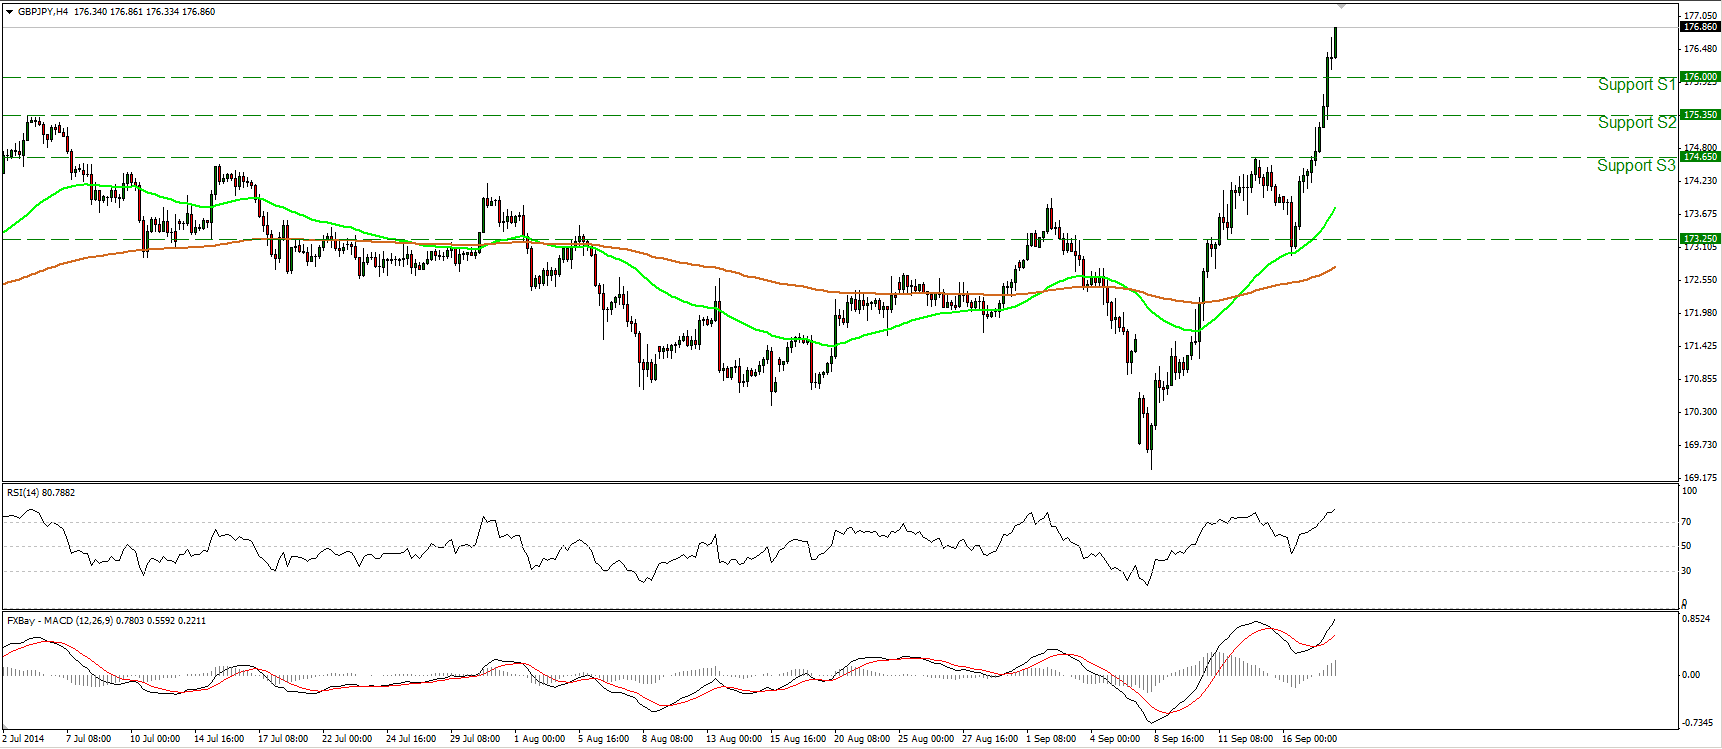
GBP/JPY rebounded from slightly below the 173.25, before shooting up and violating three resistance lines in a row. The pair is now heading towards the 177.00 (R1) barrier, where a clear upside break is likely to open the way towards the next resistance line of 178.00 (R2). Our momentum studies also support the notion. The MACD, already positive, crossed above its trigger line, while the RSI entered its overbought territory but is pointing up. This designates accelerating bullish momentum in my view and amplifies the case for the continuation of the rally. In the bigger picture, the technical outlook remains to the upside, since the pair continued climbing after the exit of a broadening formation on the daily chart. The risk to my analysis is a “yes” vote on the Scottish independence referendum.
• Support: 176.00 (S1), 175.35 (S2), 171.60 (S3)
• Resistance: 177.00 (R1), 178.00 (R2), 179.00 (R3)
EUR/GBP find support at the 0.7900 area
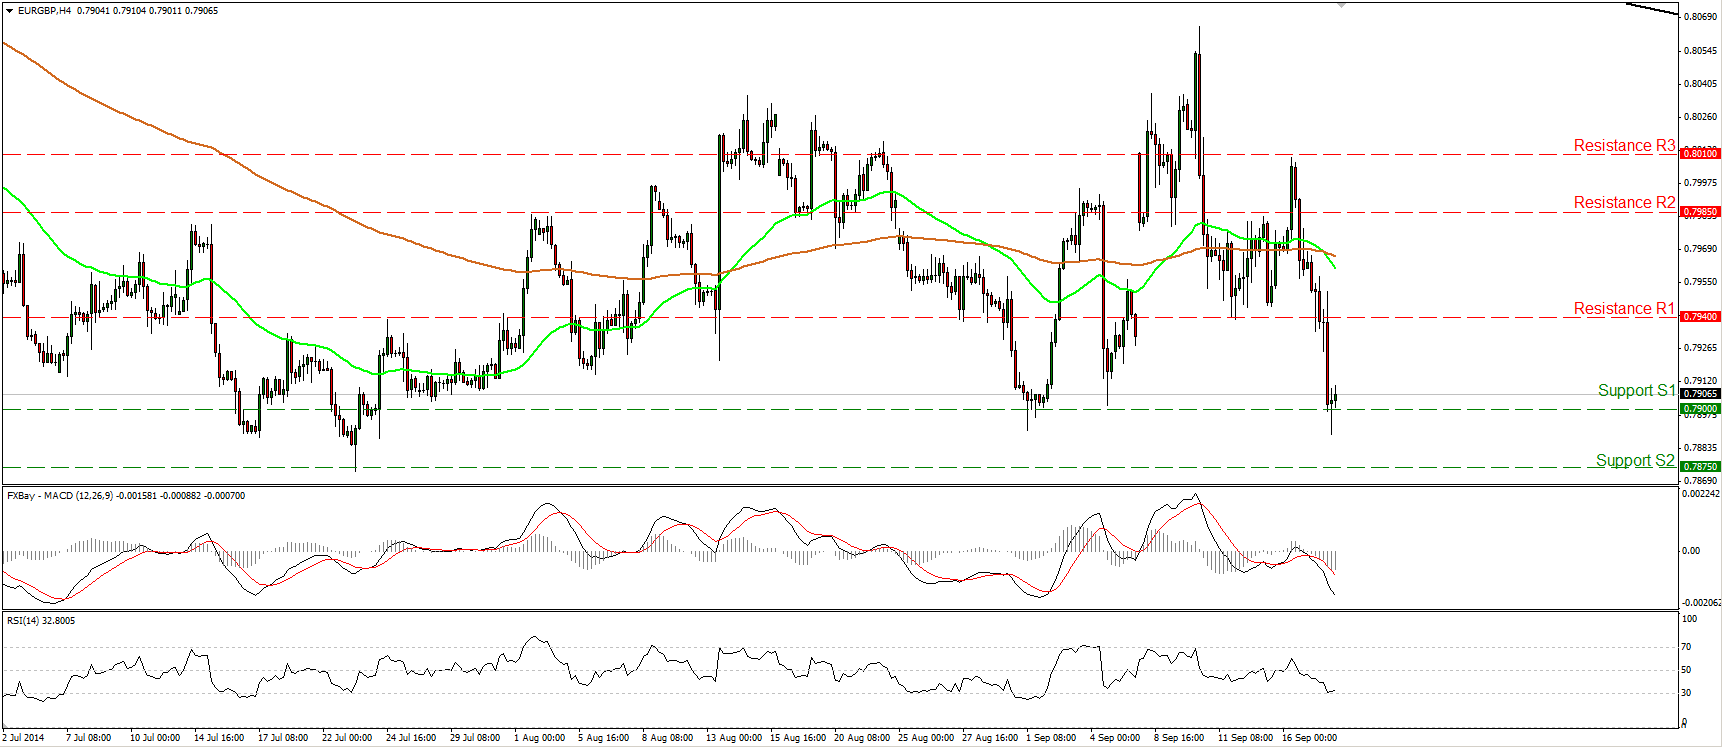
EUR/GBP collapsed yesterday, falling below the 0.7940 (support turned into resistance) barrier and completing a failure swing formation. However, the decline was halted near our support line of 0.7900 (S1) before rebounding somewhat. A clear and decisive dip below that line is likely to target the key line of 0.7875 (S2), the low of the 23rd of July. Taking a look on our momentum studies, I would be watchful of a possible upside corrective move before sellers take the reins again. The MACD lies below both its zero and signal lines indicating bearish momentum, but the RSI found support at its 30 line and is now pointing up. On the daily chart, the rate remains below the downtrend line drawn from back the 1st of August 2013, thus I consider the longer-term downside path to remain intact. Nevertheless I would prefer to see a dip below 0.7875 (S2), before getting more confident on that long-term trend. Once again, the event that could print a totally different technical picture is a “yes” vote at today’s referendum.
• Support: 0.7900 (S1), 0.7875 (S2), 0.7815 (S3)
• Resistance: 0.7940 (R1), 0.7985 (R2), 0.8010 (R3)
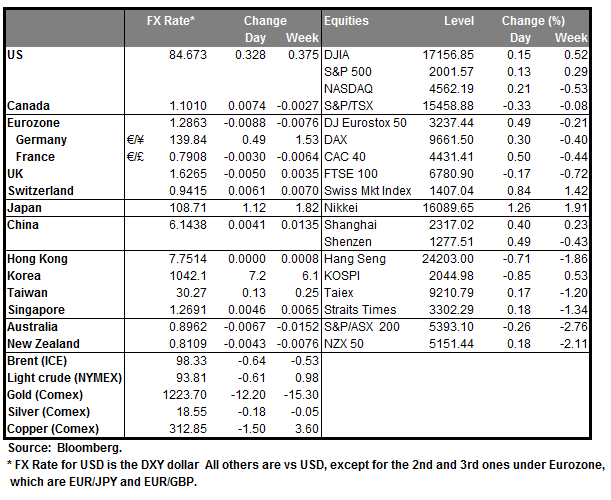
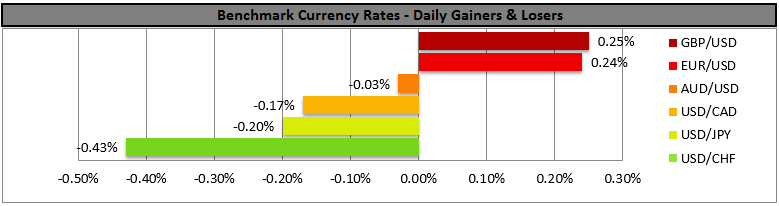
BENCHMARK CURRENCY RATES - DAILY GAINERS AND LOSERS
MARKETS SUMMARY