EUR/USD falls but rebounds from 1.2700
EUR/USD declined yesterday but found some buy orders near the 1.2700 (S1) line and the 50-period moving average, and rebounded. As long as the rate remains within the upside black channel and above the blue prior downtrend line, I would consider the short-term bias to remains cautiously positive. But only a clear break above the 1.2900 hurdle is the move that could trigger a strong leg up in my view, perhaps towards the psychological line of 1.3000 (R2). The RSI moved lower after hitting its 70 line, while the MACD shows signs of topping and could move below its trigger line any time soon. As a result I would be cautious of another pullback towards the 1.2700 (S1) line and the lower bound of the channel. As for the broader trend, on the daily chart the price structure still suggests a downtrend, thus I still see the near-term advances as a corrective phase of the longer-term down path.

• Support: 1.2700 (S1), 1.2600 (S2), 1.2500 (S3)
• Resistance: 1.2900 (R1), 1.3000 (R2), 1.3100 (R3)
Could USD/JPY fall below 105.00?
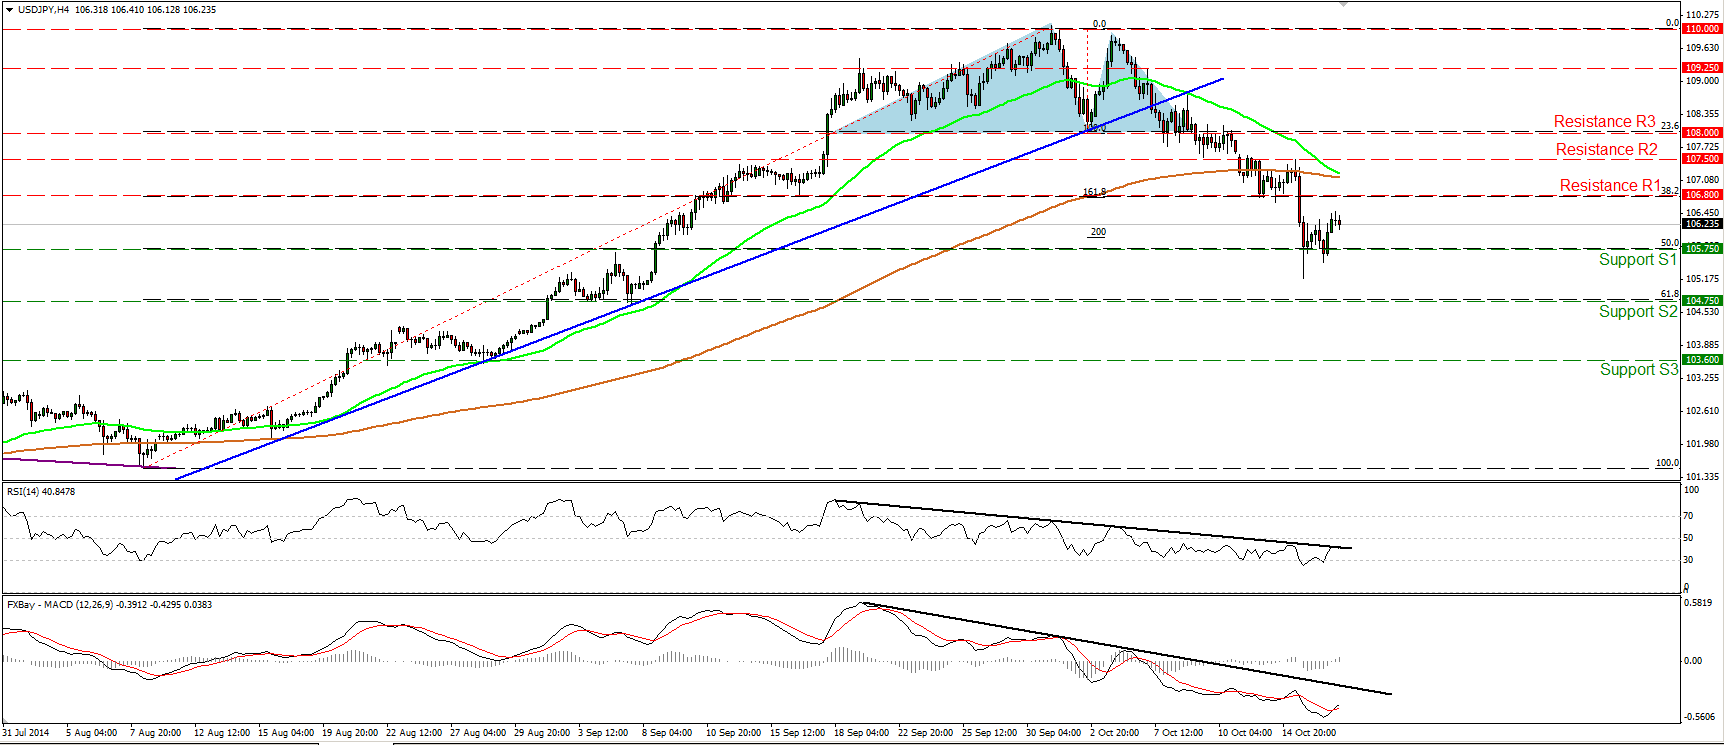
USD/JPY rebounded somewhat yesterday after finding buyers below the 50% retracement level of the 8th August – 1st October up move. However, I still believe that the near-term bias remains to the downside and I would expect another dip below 105.75 (S1) to pave the way for the next support at 104.75 (S2), which lies near the 61.8% retracement level of the aforementioned advance. Both our near-term oscillators remain below their downside black resistance lines, supporting the negative picture. Moreover, the 50-period moving average is too close to the 200-one and could cross below it in the close future, adding another bearish sign to the near-term picture of USD/JPY.
• Support: 105.75 (S1), 104.75 (S2), 103.60 (S3)
• Resistance: 106.80 (R1), 107.50 (R2), 108.00 (R3)
GBP/USD slightly below the resistance of 1.6130
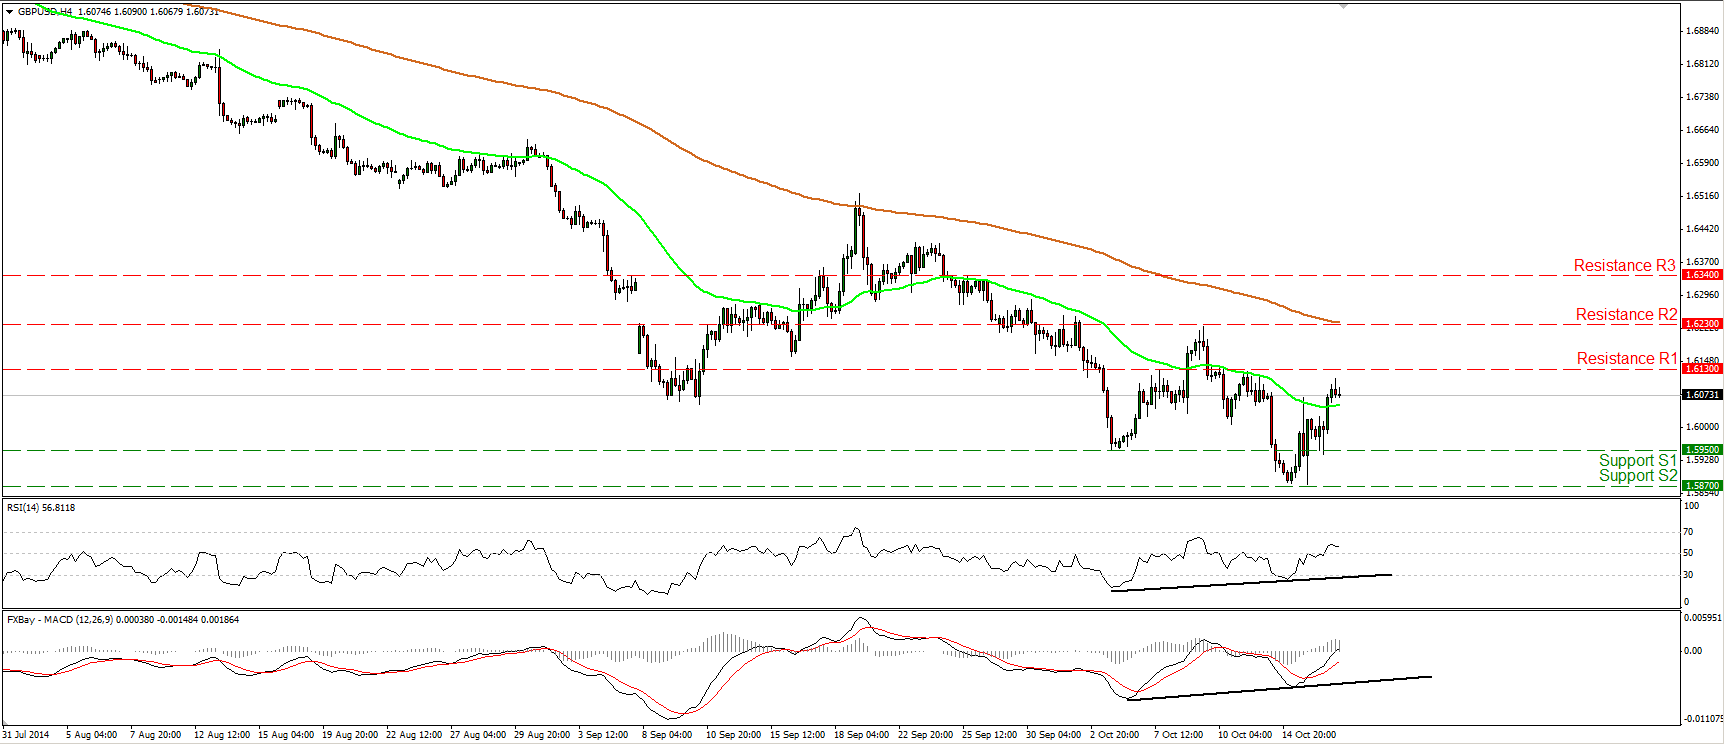
GBP/USD moved higher on Thursday after finding support near the 1.5950 (S1) area. Today, during the early European morning, the pair is trading slightly below the resistance hurdle of 1.6130 (R1). A clear and decisive move above that line could pave the way towards the next obstacle at 1.6230 (R2), which now coincides with the 200-period moving average. Our near-term momentum studies show that the RSI remains above its 50 line and that the MACD, already above its trigger, turned positive. This confirms yesterday’s positive momentum. As far as the longer-term trend is concerned, I still think that as long as Cable remains below the 80-day exponential moving average, the picture is negative overall. Nevertheless, I also see positive divergence between the daily momentum indicators and the price action, something that indicates decelerating bearish momentum. I would wait for more actionable negative signs before getting again confident about the overall downtrend.
• Support: 1.5950 (S1), 1.5870 (S2), 1.5720 (S3)
• Resistance: 1.6130 (R1), 1.6230 (R2), 1.6340 (R3)
WTI shoots up after triggering buy orders below 80.00
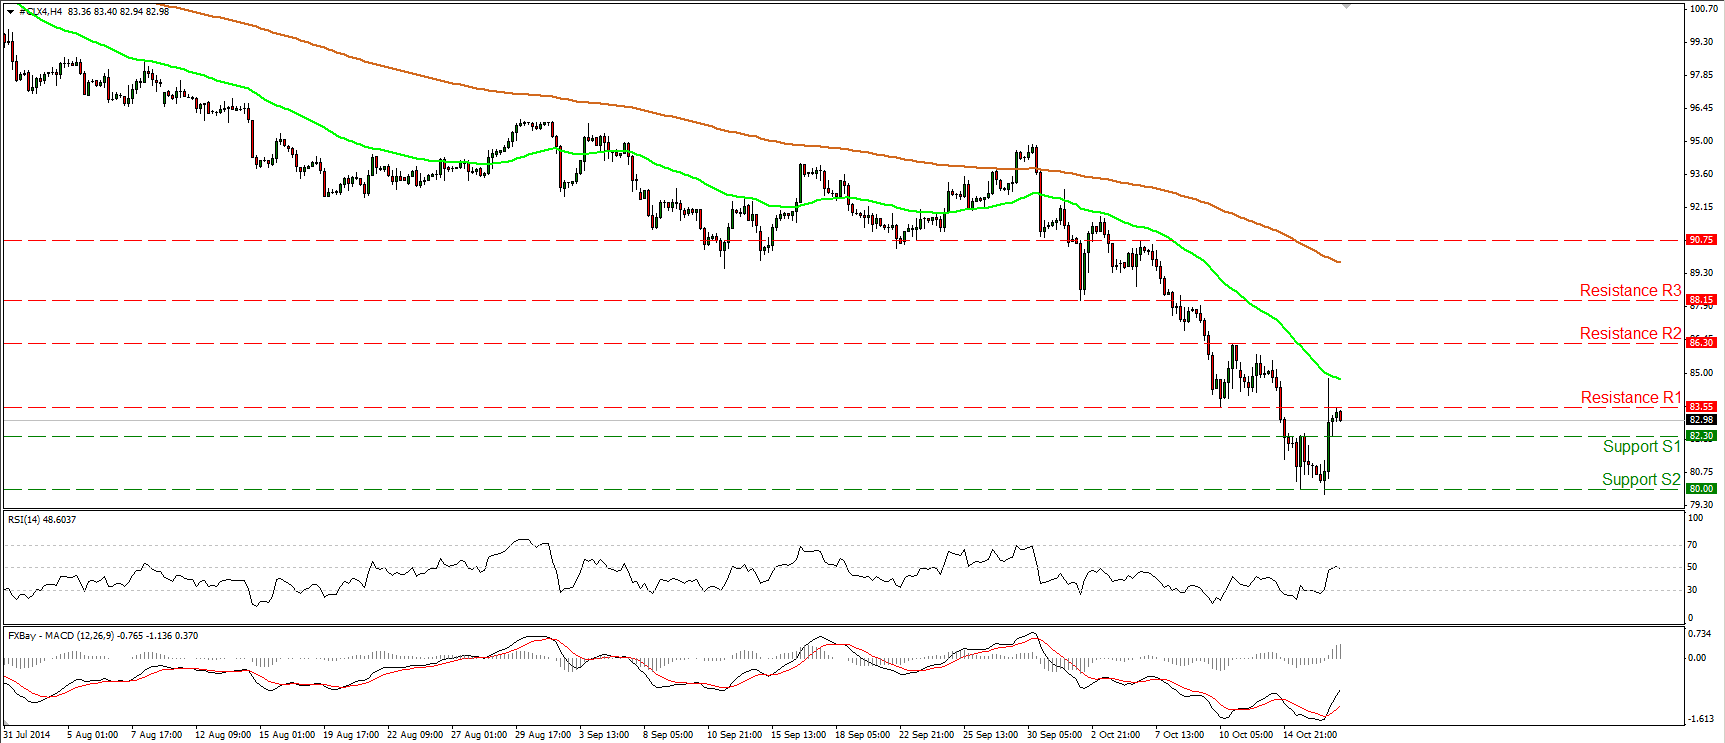
WTI shot up yesterday after waking up some bulls fractionally below the psychological line of 80.00 (S2). The price structure remains lower highs and lower lows below both the 50- and the 200-period moving averages, keeping the downtrend intact. However, given the strong rebound from the 80.00 (S2) zone, I would prefer to adopt a wait and see approach for now. On the daily chart, the 14-day RSI exited its oversold field, while the daily MACD seems to be bottoming. These momentum signs give me extra reasons to remain neutral. I would prefer to see a strong move below the psychological hurdle of 80.00 (S2) before getting more confident on the downside. Such a move could trigger extensions towards our next support barrier at 77.50 (S3), determined by the lows of June 2012.
• Support: 82.30 (S1), 80.00 (S2), 77.50 (S3)
• Resistance: 83.55 (R1), 86.30 (R2), 88.15 (R3)
Gold pulls back near the 200-period EMA
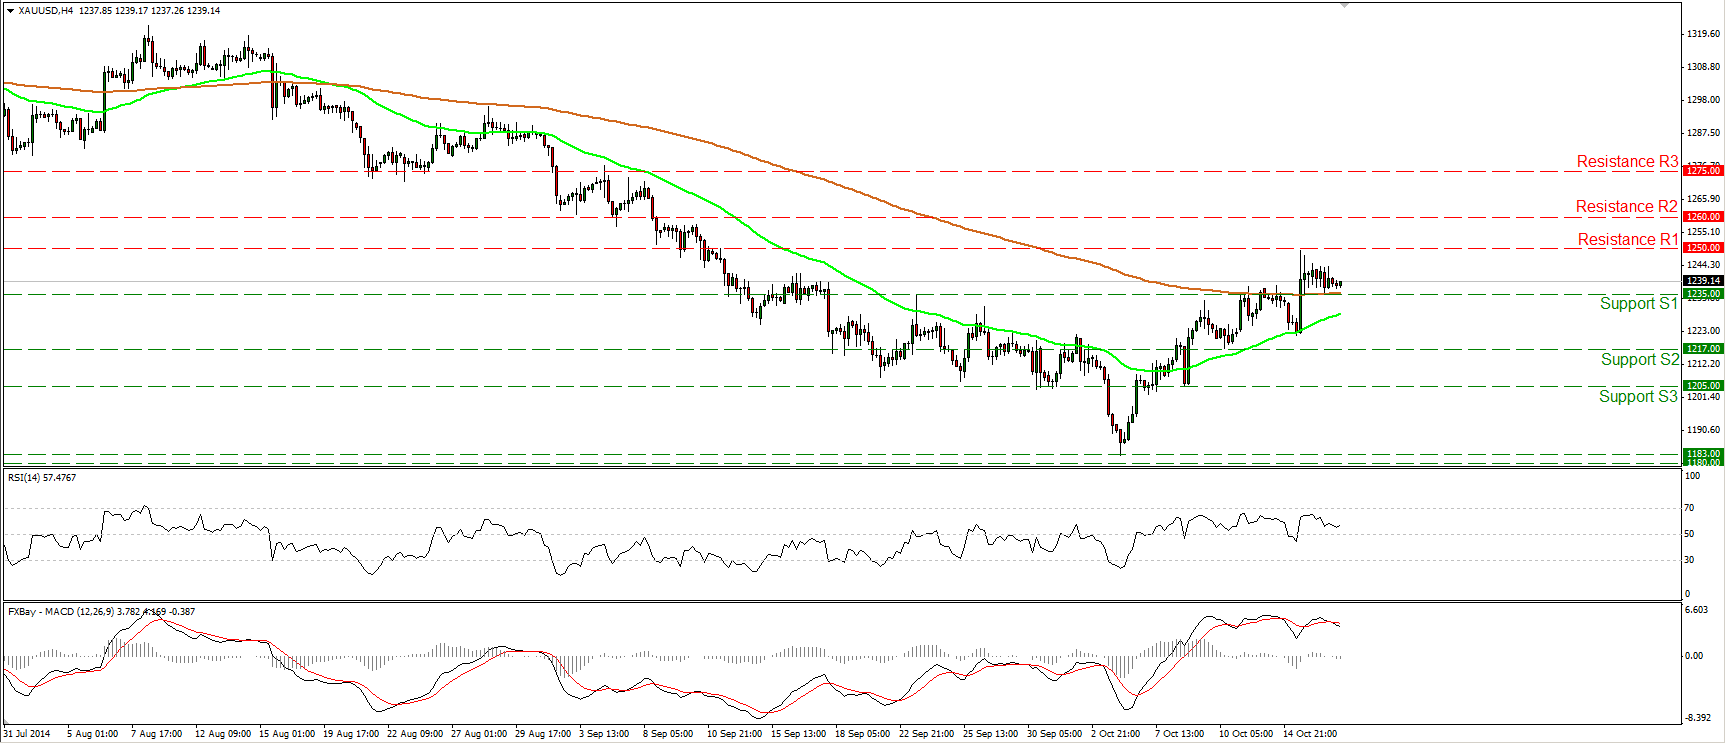
Gold moved marginally lower on Thursday and near the European opening is slightly above the 1235 (S1) line and the 200-period moving average. I still expect the bulls to pull the trigger and target the resistance obstacle of 1260 (R2). On the daily chart, the 14-day RSI remains above its 50 line while the daily MACD, already above its trigger line, is getting closer to its zero line and could get a positive sign in the near future. This supports the scenario for further advances in the near future. Nonetheless, coming back to the 4-hour chart, the RSI moved lower after finding resistance below its 70 line and the MACD topped and crossed below its trigger, thus we may experience further pullback before the buying pressure prevails again.
• Support: 1235 (S1), 1217 (S2), 1205 (S3)
• Resistance: 1250 (R1), 1260 (R2), 1275 (R3)
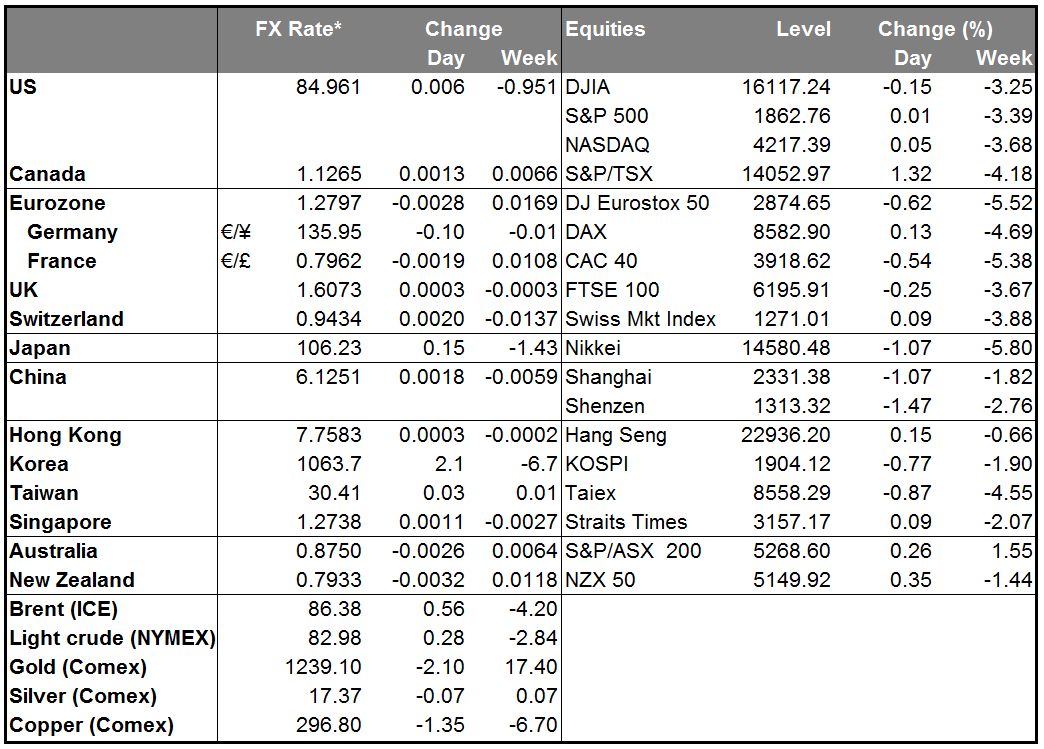
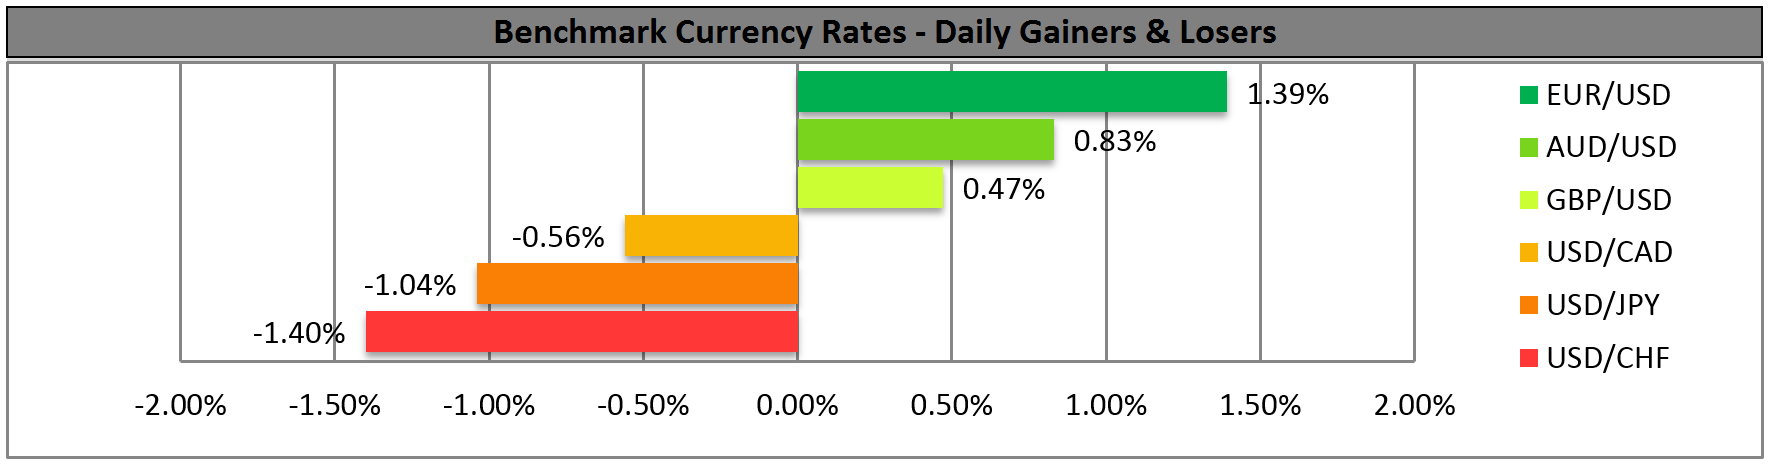
BENCHMARK CURRENCY RATES - DAILY GAINERS AND LOSERS
MARKETS SUMMARY