EUR/USD finds resistance marginally below 1.3000
EUR/USD moved higher yesterday, after China decided to inject 500bn Yuan to the country’s five biggest banks, triggering an appetite for risk across the globe, and after the WSJ reported that the Fed will most likely maintain the “considerable time” language in its statement. The pair’s advance was halted by the lower boundary of the blue downside channel, connecting the highs and the lows on the daily chart, a few pips below the psychological line of 1.3000 (R1). I will hold the view that the overall picture remains negative and I would expect a dip below the support of 1.2860 (S1) in the near future to open the way for the key support zone of 1.2760 (S2). However, most of today’s movement will be driven by the FOMC statement, the updated forecasts and the press conference held by Chair Yellen after the rate decision.

• Support: 1.2860 (S1), 1.2760 (S2), 1.2660 (S3).
• Resistance: 1.3000 (R1), 1.3100 (R2), 1.3160 (R3).
GBP/USD fills the gap
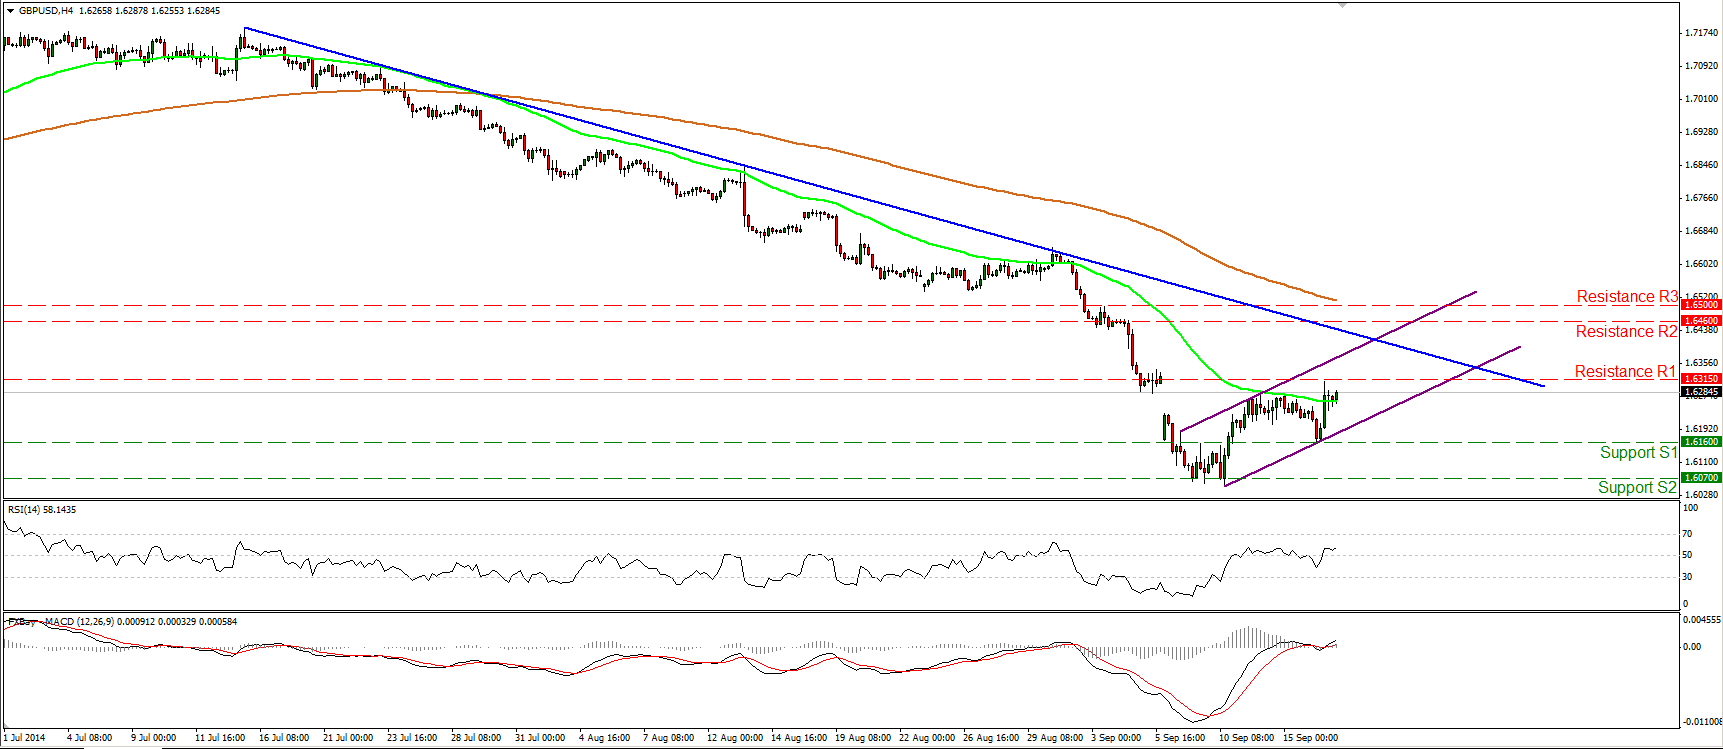
GBP/USD moved higher yesterday, filling the gap we saw last week. The technical picture suggest that the pair remains in a retracing mode. The rate started printing higher highs and higher lows within the purple minor-term channel, but still remains below the blue downtrend line drawn from the high of the 15th of July. Only a move above the psychological line of 1.6500 (R3) would confirm the upside break of the downtrend line and perhaps flip the short-term picture positive. However, one day ahead of the Scottish independence referendum, I would prefer to stay on the sidelines as the outcome could change the whole outlook of the pair. I would like to take a view on the picture the results will paint afterwards.
• Support: 1.6160 (S1), 1.6070 (S2), 1.6000 (S3).
• Resistance: 1.6315 (R1), 1.6460 (R2), 1.6500 (R3).
EUR/JPY rebounds from near 138.45
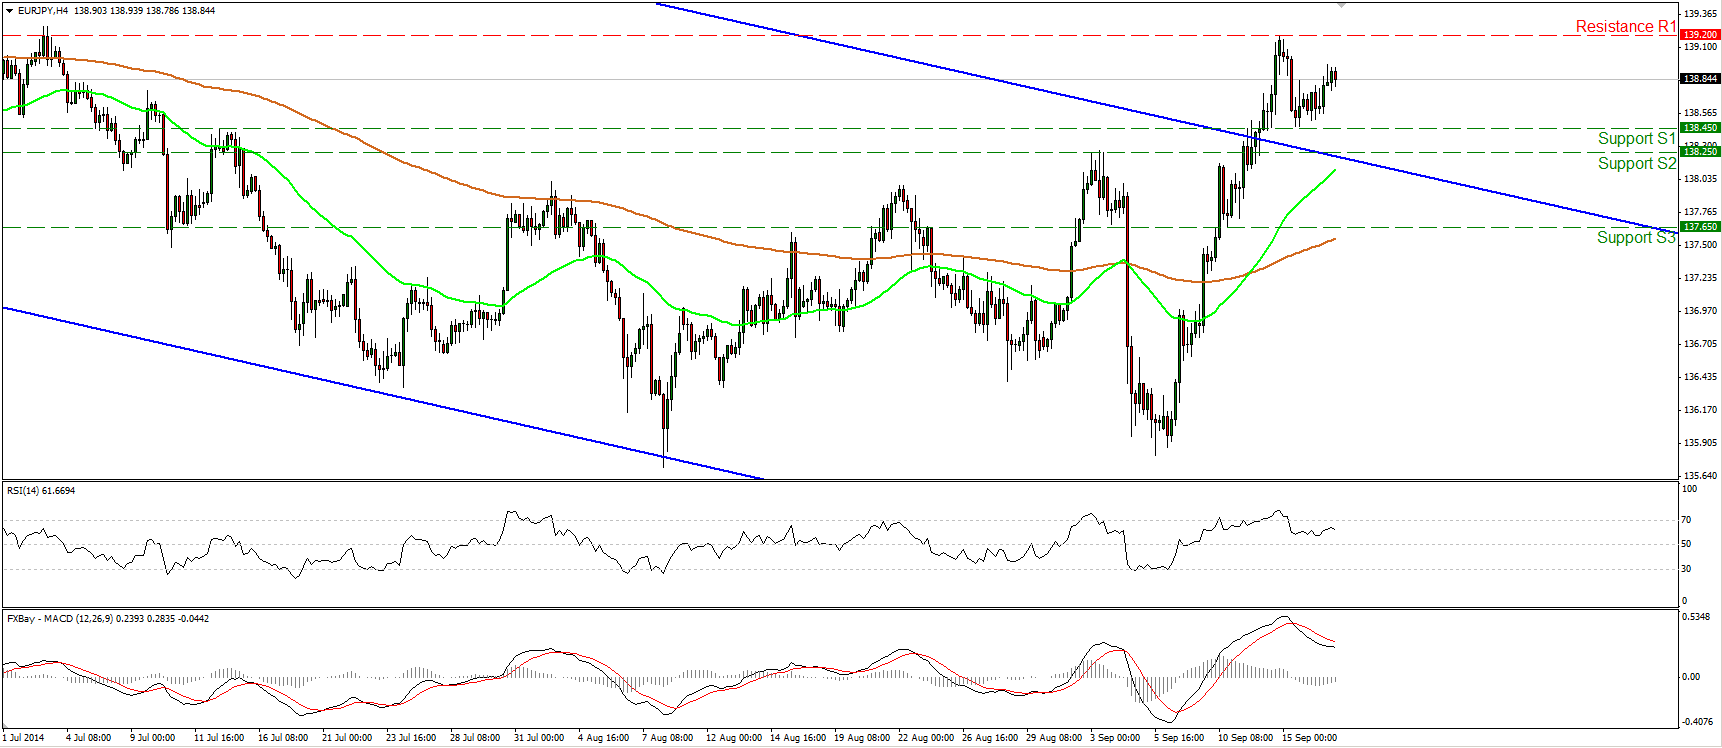
EUR/JPY moved above the upper line of the downside channel (containing the price action since April) last week. After pulling back on Monday, the pair found support near 138.45 (S1) and rebounded somewhat. Since the rate is now trading above the upper bound of the aforementioned channel I would see a cautiously positive picture. The reason I am a bit mindful regarding further upside is that our momentum studies have not confirmed the price action yet. The RSI, although above 50, is pointing down, while the MACD stays below its trigger and is pointing down. A break above 139.20 (R1) is the move that would confirm a forthcoming higher high and perhaps set the stage for extensions towards the psychological line of 140.00 (R2).
• Support: 138.45 (S1), 138.25 (S2), 137.65 (S3).
• Resistance: 139.20 (R1), 140.00 (R2), 141.00 (R3).
Gold trading virtually unchanged
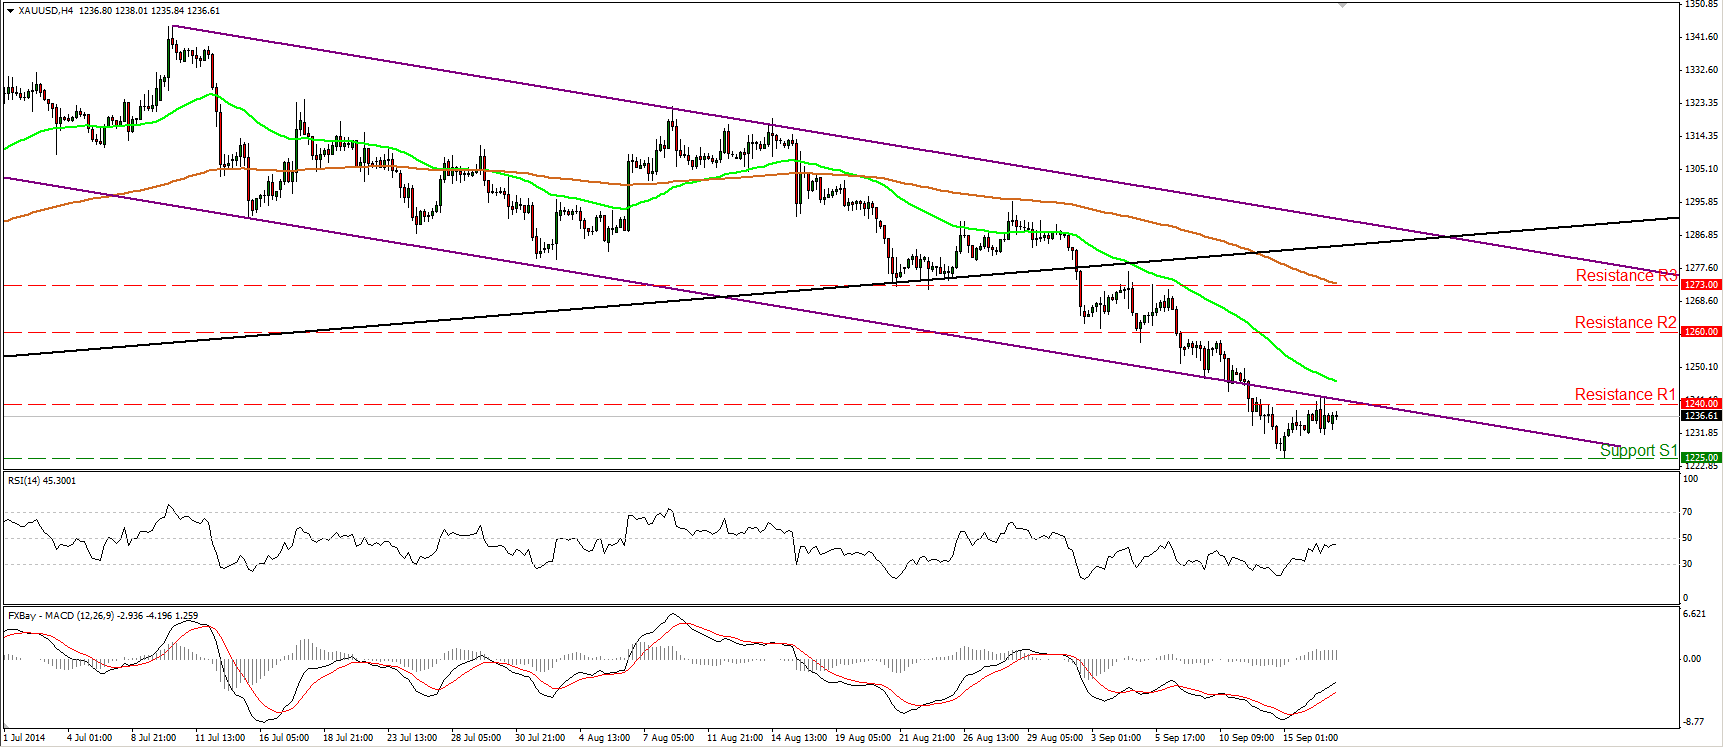
Gold moved somewhat higher on Tuesday, but it found resistance at the lower line of the purple downside channel, connecting the highs and the lows on the daily chart, marginally above the 1240 (R1) barrier, before declining to trade virtually stable. I will keep my stance that the overall trend remains to the downside. The price structure remains lower peaks and lower troughs below the prior black support line, drawn from back at the low of the 31st of December. However, I would adopt a “wait and see” approach ahead of the FOMC decision. Another reason I would like to take the sidelines for now is that our momentum studies are still pointing up. I still believe that it is better to wait for a dip below the 1220 (S2) line before getting more confident about the downtrend.
• Support: 1225 (S1), 1220 (S2), 1200 (S3).
• Resistance: 1240 (R1), 1250 (R2), 1260 (R3).
WTI rallies on OPEC target
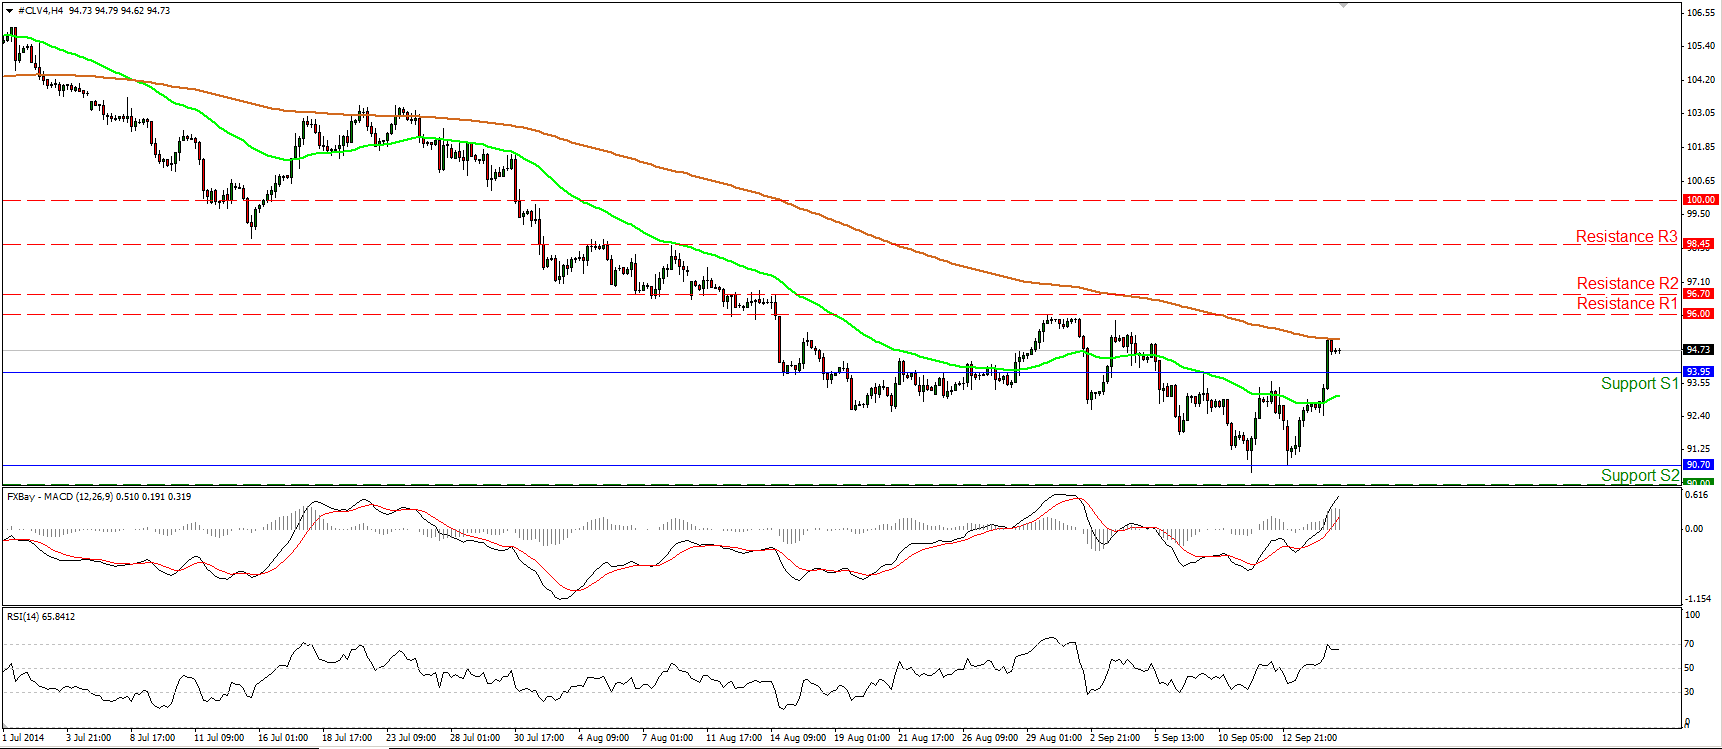
WTI rallied, breaking above 93.95, the upper boundary of the range it’s been trading since the 5th of September, amid reports that OPEC may cut crude-output targets next year. I would expect the move above 93.95 to have further bullish extensions and target our resistance hurdle of 96.00 (R1) in the near future. The continuation of the bullish wave is also supported by our daily momentum studies. First of all, I see positive divergence between the price action and both the daily oscillators. Moreover, the daily MACD lies above its signal line and is pointing up, while the 14-day RSI just crossed above its 50 line.
• Support: 93.35 (S1), 90.70 (S2), 90.00 (S3).
• Resistance: 96.00 (R1), 96.70 (R2), 98.45 (R3) .
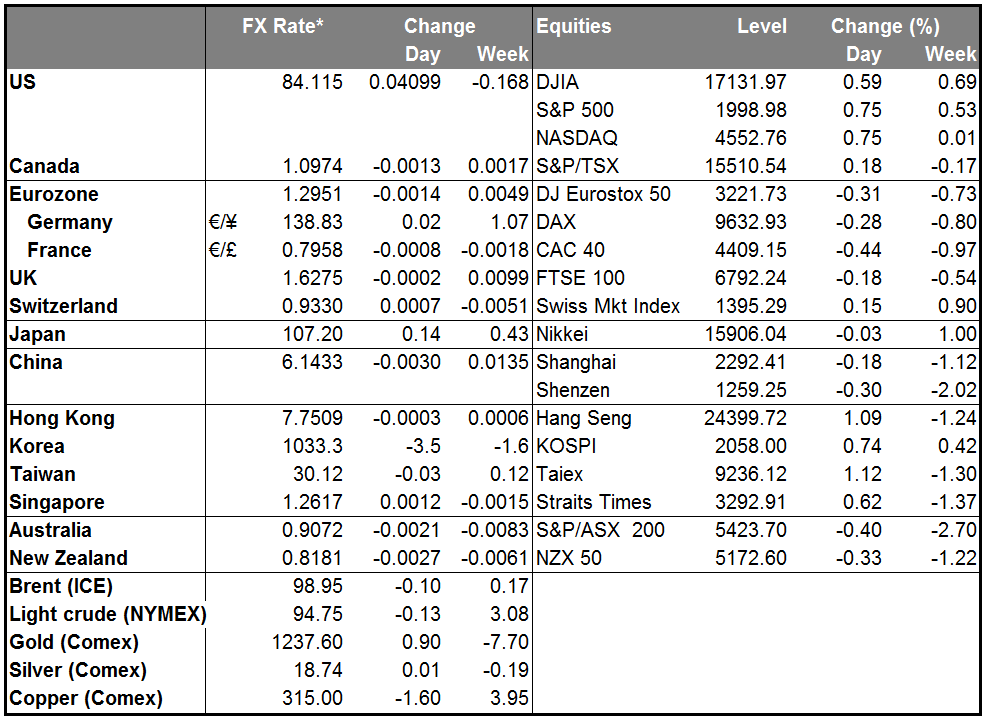
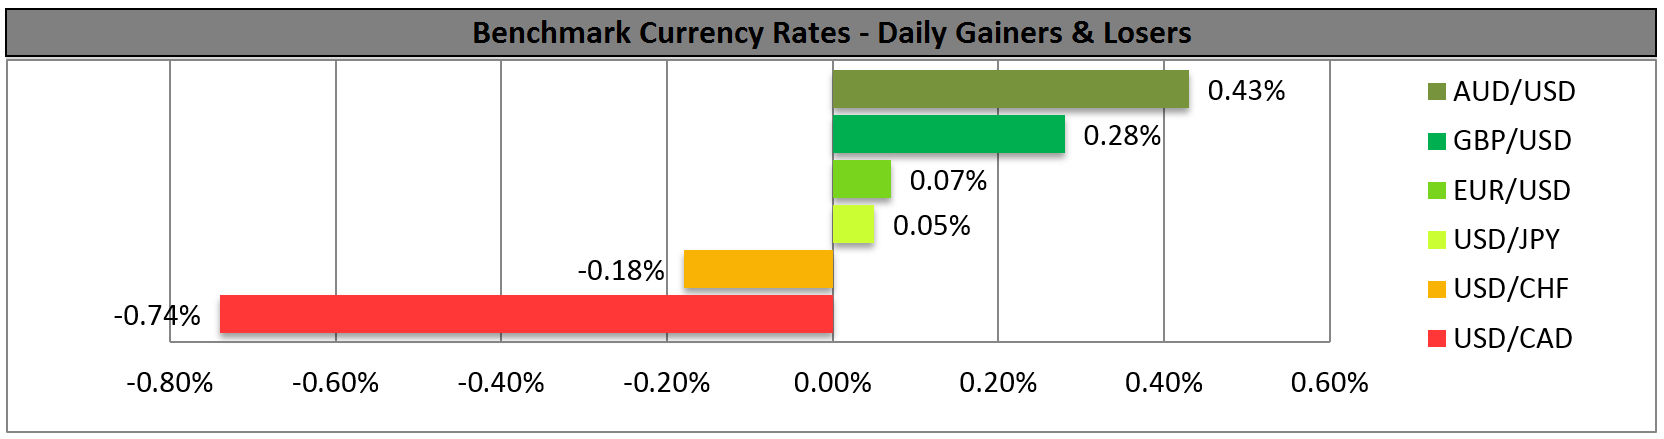
BENCHMARK CURRENCY RATES - DAILY GAINERS AND LOSERS
MARKETS SUMMARY