
EUR/USD continues lower
EUR/USD extended its decline on Wednesday, after falling below the 1.3580 (R1) barrier, the lower boundary of the recent sideways path it’s been trading recently. The short-term bias remains to the downside in my view and I still expect the rate to challenge the psychological zone of 1.3500 (S1). The MACD remains below both its zero and trigger lines, designating the negative momentum of the price action, but the RSI is pointing up and seems ready to exit its oversold zone. Taking this into account, I cannot rule out some consolidation or a small bounce before selling pressure comes back into the game. On the daily chart, the 50-day moving average is getting closer to the 200-day moving average and a bearish cross in the near future would be an additional negative sign. My opinion is that we should wait to see if the bears are strong enough to overcome the 1.3500-1.3475 zone before expecting larger bearish extensions in the future.

• Support: 1.3500 (S1), 1.3475 (S2), 1.3400 (S3)
• Resistance: 1.3580 (R1), 1.3650 (R2), 1.3700 (R3)
USD/JPY finds resistance at the 200-period MA
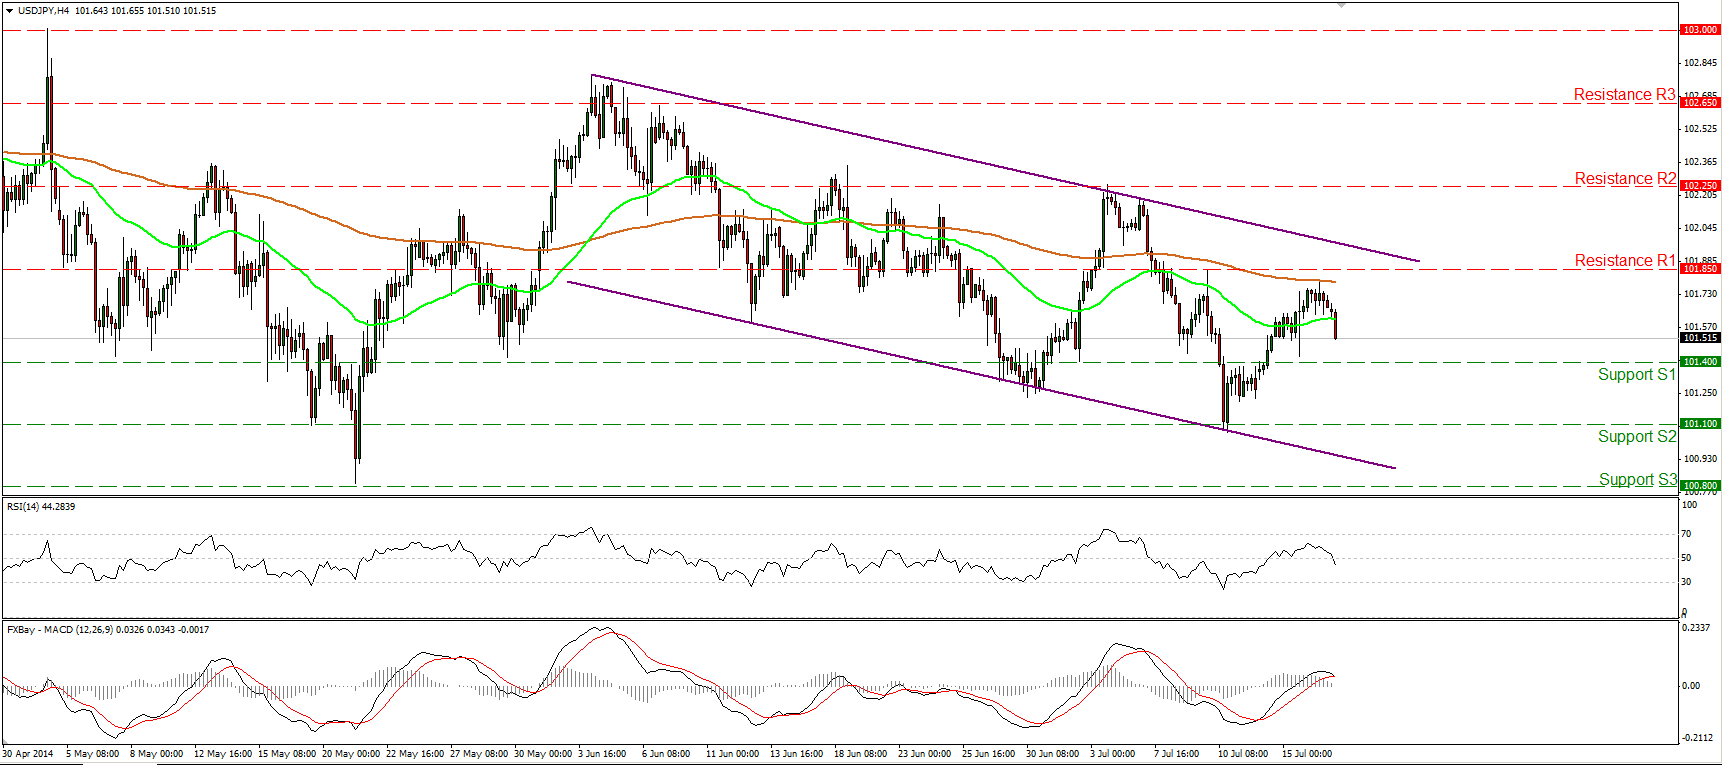
USD/JPY moved lower yesterday after finding resistance at the 200-period moving average, slightly below our resistance level of 101.85 (R1). At the time of writing, the rate is heading towards the support zone of 101.40 (S1), where a decisive dip would signal that the upside corrective wave is completed and could drive the battle towards the lows of 101.10 (S2) or near the lower boundary of the purple downside channel. The RSI fell back below its 50 level, while the MACD shows signs of topping and seems ready to move below its signal line. This amplifies the case for the continuation of the decline. The pair is trading within the purple downside channel and as a result, the overall short-term path remains to the downside.
• Support: 101.40 (S1), 101.10 (S2), 100.80 (S3)
• Resistance: 101.85 (R1), 102.25 (R2), 102.65 (R3)
EUR/GBP below 0.7900
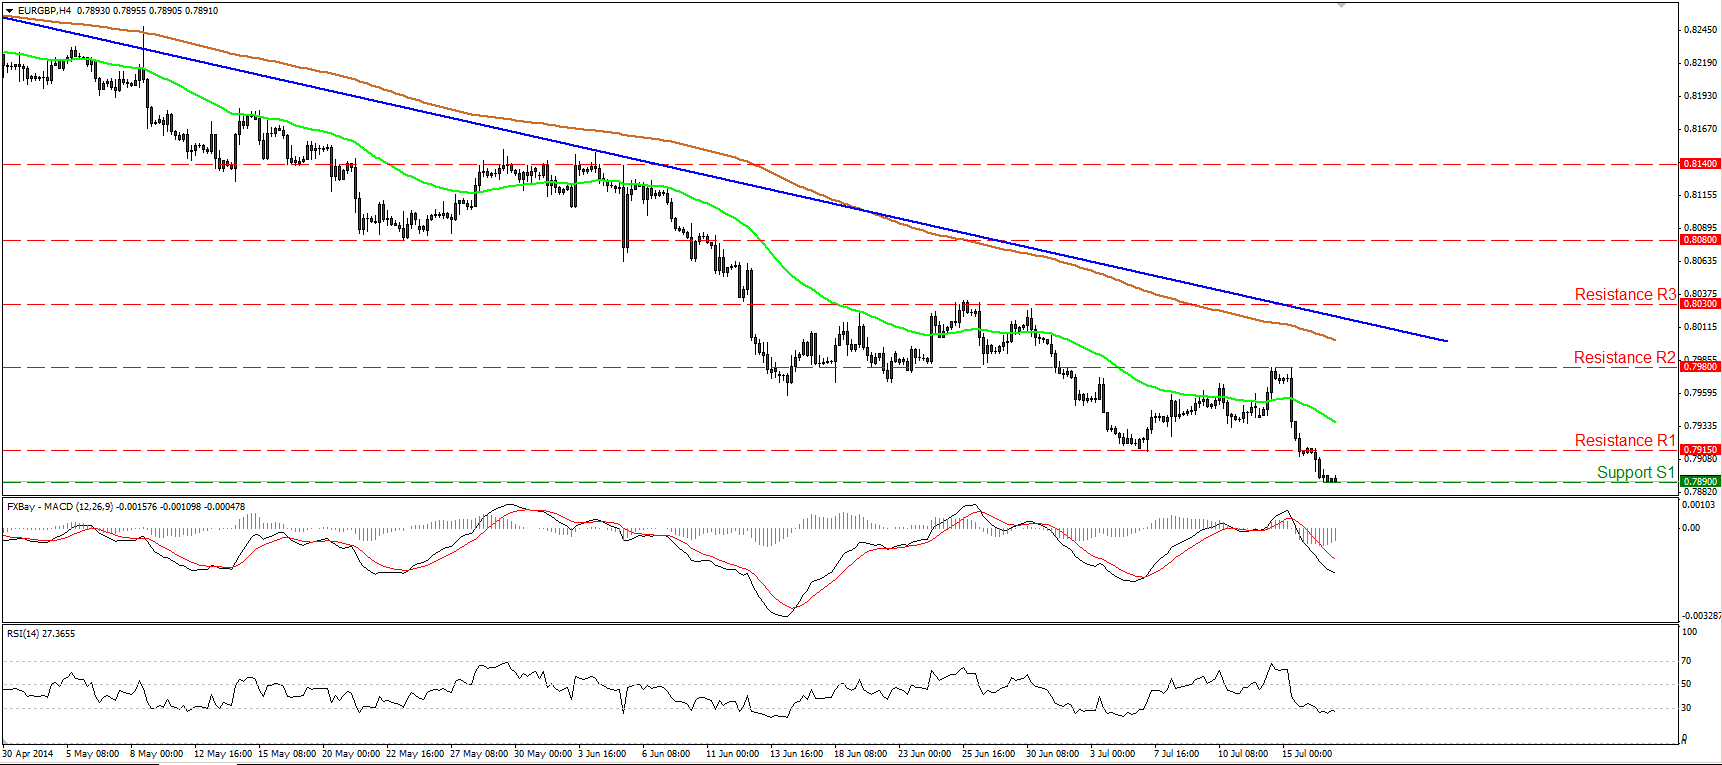
EUR/GBP plunged after finding resistance at 0.7980 (R2). The rate fell below the previous low of 0.7915 (support turned into resistance) but it was stopped at 0.7890 (S1). A clear violation of that barrier could trigger further bearish extensions perhaps towards the next support at 0.7830 (S2). Zooming on the 1-hour chart, I can see positive divergence between our hourly momentum studies and the price action, thus an upside corrective wave is likely before the continuation of the decline. Nevertheless, as long as the pair is trading below both the moving averages and below the blue downtrend line drawn from back the 11th of April, I consider the overall outlook to be to the downside.
• Support: 0.7890 (S1), 0.7830 (S2), 0.7760 (S3)
• Resistance: 0.7915 (R1), 0.7980 (R2), 0.8030 (R3)
Gold rebounds from 1293

Gold rebounded from the support of 1293 (S1), the 50% retracement level of the 5th June – 10th of July advance, and during the early European morning, seems ready to challenge the 200-period moving average and strong zone of 1305-10 as a resistance this time. Although the overall short-term outlook remains to the downside, I would remain flat today, since a move above 1310 (R2) could be a first sign that the recent plunge was just a 50% retracement level of the 5th June – 10th of July up move and could target the hurdle of 1325 (R3). On the downside, only a move below 1293 (S1) would confirm a forthcoming lower low.
• Support: 1293 (S1), 1285 (S2), 1265 (S3)
• Resistance: 1305 (R1), 1310 (R2), 1325 (R3)
WTI testing the downtrend line
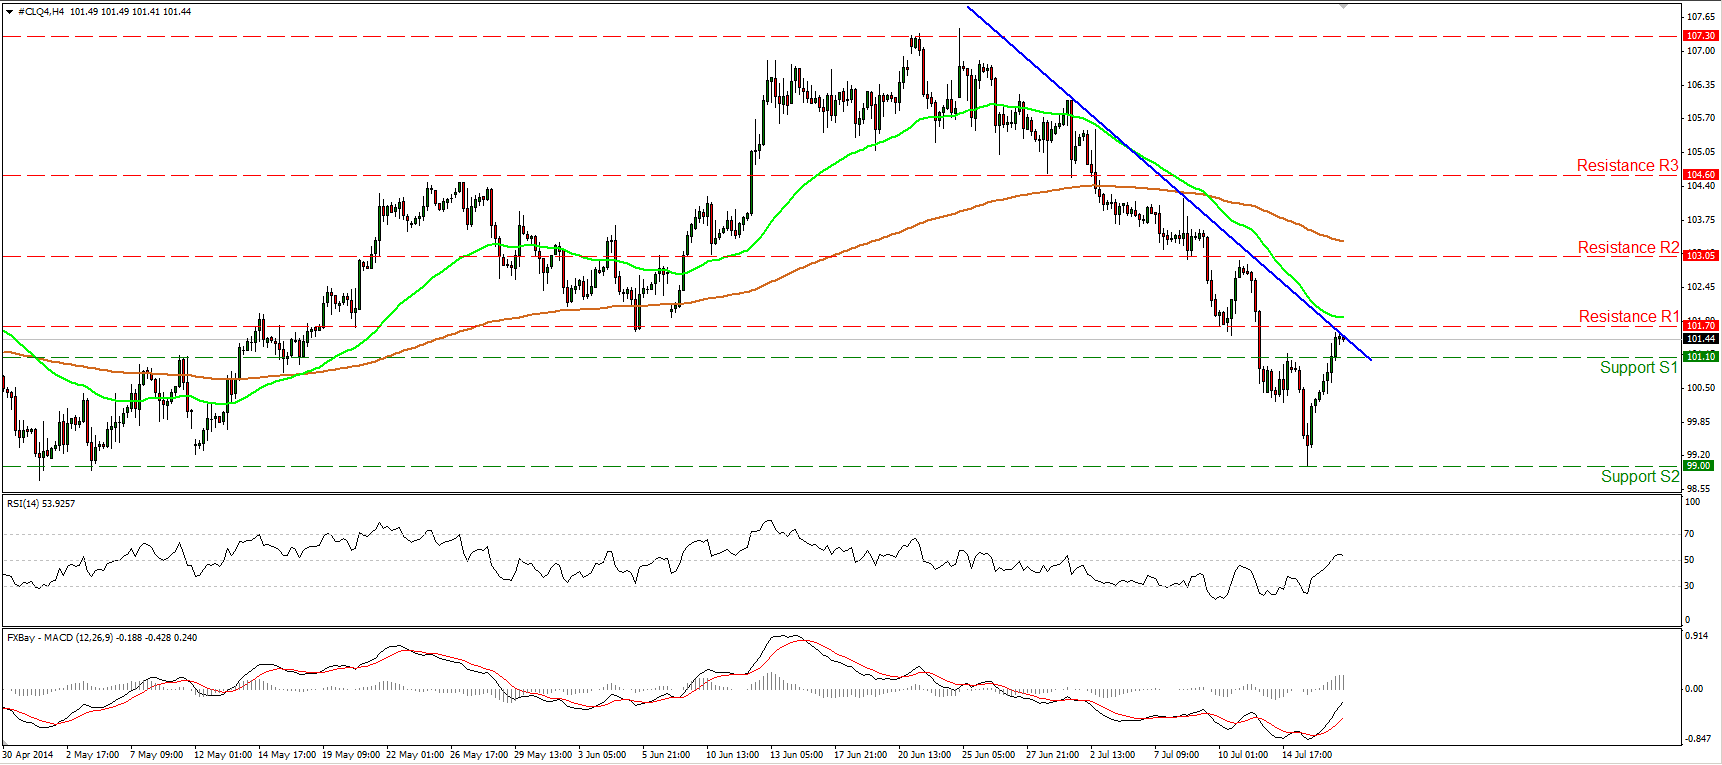
WTI moved significantly higher on Wednesday, confirming the positive divergence between the RSI and the price action. WTI is now at a critical point, testing the blue downtrend line and as long as we do not see a violation, the downtrend remains intact. However, I would maintain my neutral stance, since I would like to see a move below 101.10 (S1) before expecting another dip towards 99.00 (S2). On the other hand, a clear move above 101.70 (R1) could signal the violation of the blue downtrend line and perhaps target the 103.05 (R2) zone. Relying on our momentum studies does not seem such a good idea for now, since the MACD lies above its trigger line and is pointing up, while the RSI, although above 50, is pointing down.
• Support: 101.10 (S1), 99.00 (S2), 98.00 (S3)
• Resistance: 101.70 (R1), 103.05 (R2), 104.60 (R3)
BENCHMARK CURRENCY RATES - DAILY GAINERS AND LOSERS

MARKETS SUMMARY
