EUR/USD surges on disappointing US retail sales
EUR/USD surged on Wednesday after both the headline and core retail sales fell in September. The pair broke above the zone of 1.2760/90, to find resistance slightly below the 1.2900 (R1) line. That move confirmed a forthcoming higher high on the 4-hour chart and turned the short-term bias to the upside. A clear move above the 1.2900 (R1) hurdle is likely to extend the upside wave, perhaps towards the psychological line of 1.3000 (R2). However, having in mind that the US industrial production for September being released today is expected to accelerate, I would be cautious of a possible pullback before the next leg higher. The RSI supports the notion as it found resistance at its 70 line and turned down. As for the broader trend, on the daily chart the price structure still suggests a downtrend, thus I still see the near-term advances as a corrective phase of the longer-term down path.

• Support: 1.2760 (S1), 1.2600 (S2), 1.2500 (S3)
• Resistance: 1.2900 (R1), 1.3000 (R2), 1.3100 (R3)
GBP/JPY keeps falling
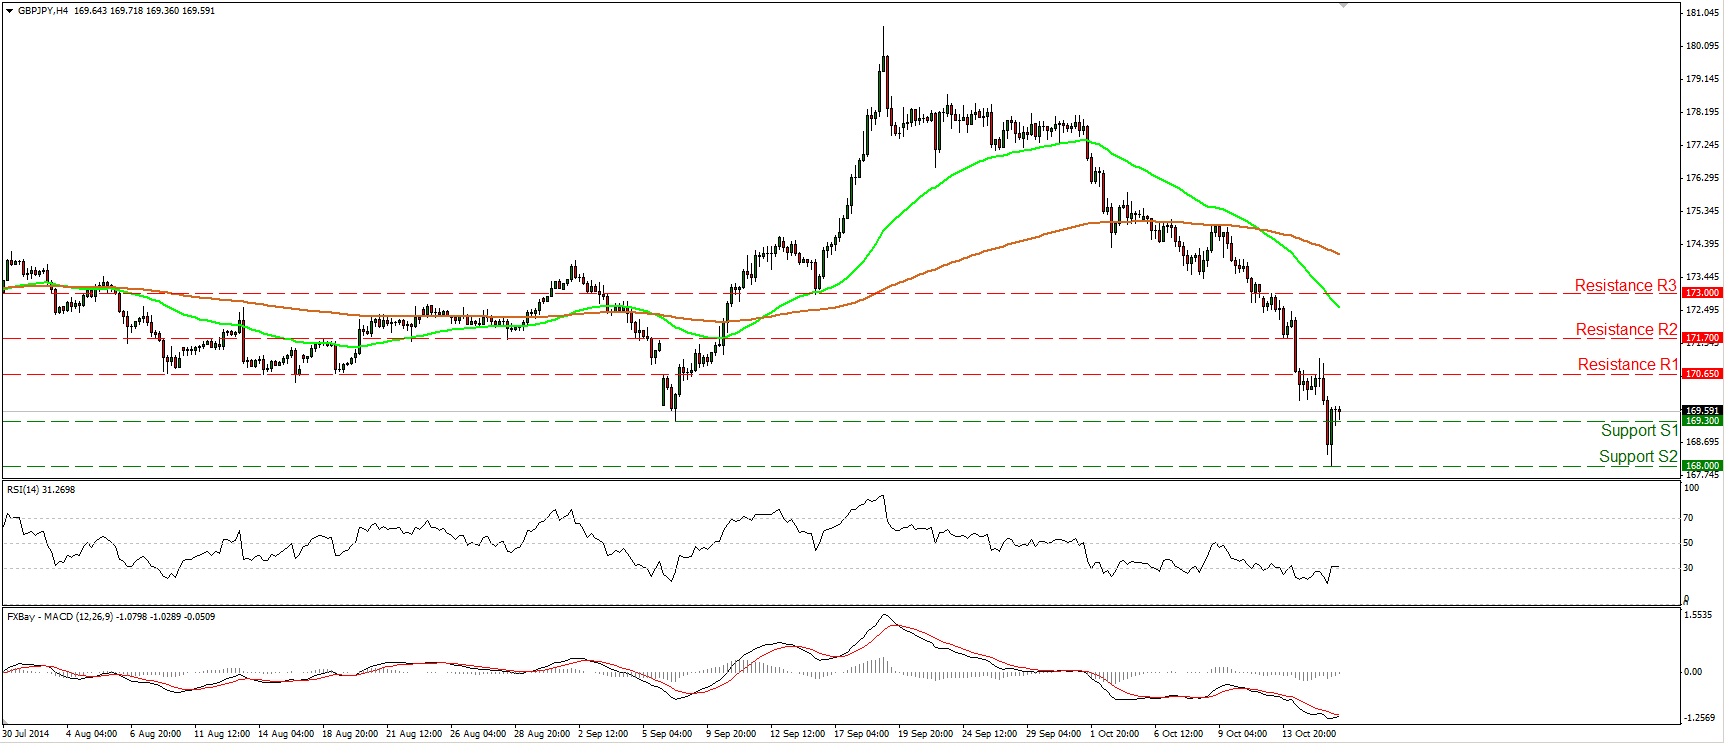
GBP/JPY continued its plunge on Wednesday to find support at 168.00 (S2), a support hurdle defined by the lows of March. After touching that line, the pair rebounded to move back above the 169.30 line, the low of the 8th of September. However, as long as the price structure remains lower peaks and lower troughs below both the 50- and the 200-period moving averages, I would maintain the view that the near-term path remains to the downside. I would expect a clear and decisive dip below the 168.00 (S2) barrier to set the stage for extensions towards our next obstacle, at 166.00 (S3). Shifting our attention at our near-term momentum oscillators, I see that the RSI exited its oversold field, while the MACD shows signs of bottoming and could move above its trigger line any time soon. This indicates that we may experience further correction before the next leg down.
• Support: 169.30 (S1), 168.00 (S2), 166.00 (S3)
• Resistance: 170.65 (R1), 171.70 (R2), 173.00 (R3)
NZD/USD surges above 0.7930
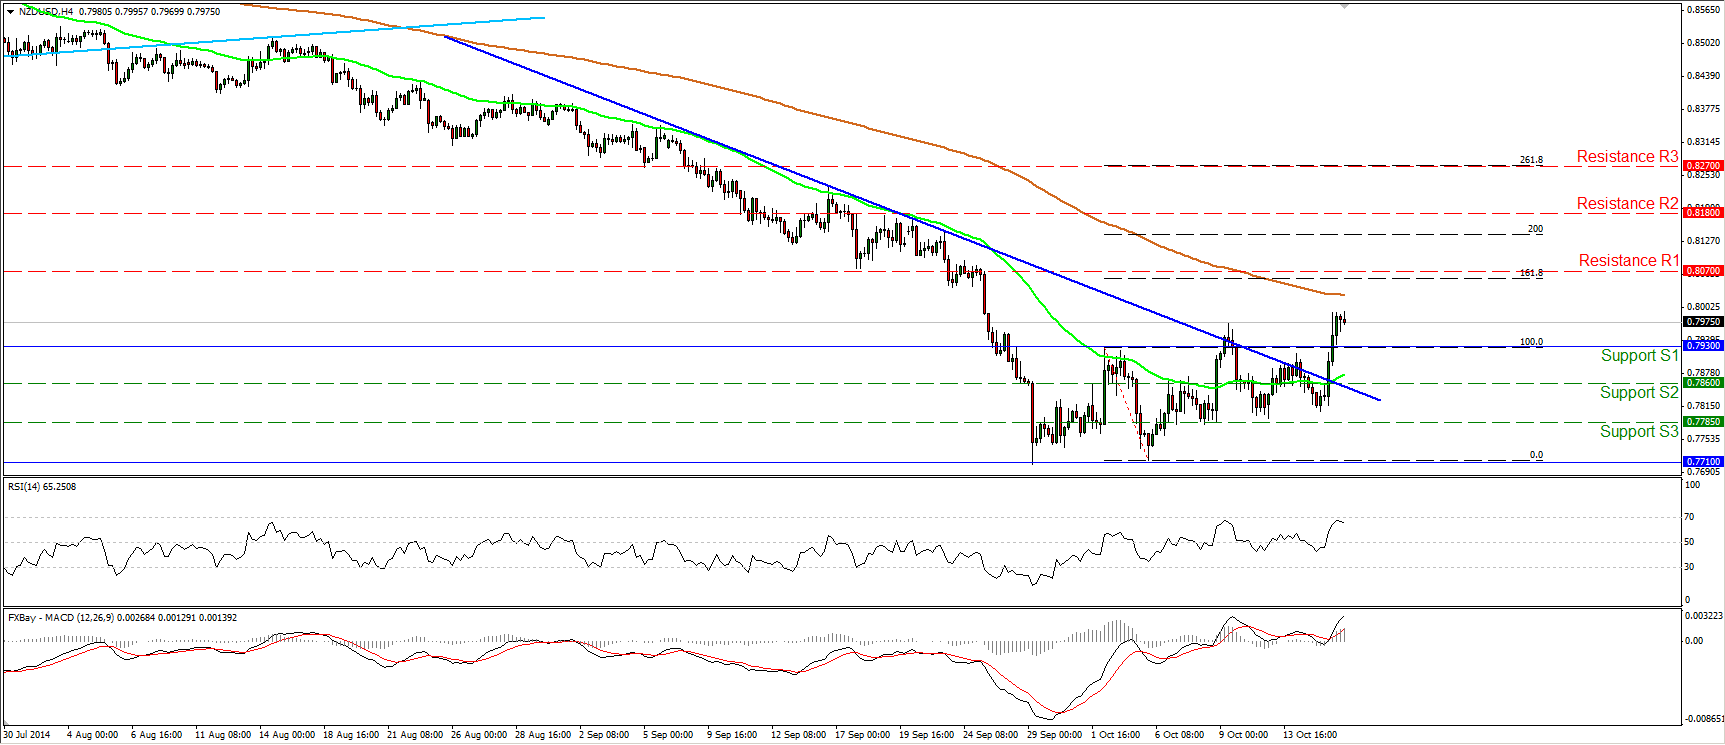
NZD/USD rallied yesterday, breaking – successfully this time – the 0.7930 hurdle. That line happens to be the upper bound of the sideways range the pair was trading since the 26th of September. I would now expect that upside escape to target the 0.8070 line, which lies pretty close to the 161.8% extension level of the width of the aforementioned sideways path. As long as the rate is trading above the prior short-term downtrend line (blue line), I would consider the near-term outlook cautiously to the upside. Nevertheless, bearing in mind that the RSI found resistance at its 70 line and is now pointing down, I would expect a minor pullback before the bulls take over again, perhaps to test the 0.7930 (S1) line as a support this time.
• Support: 0.7930 (S1), 0.7860 (S2), 0.7785 (S3)
• Resistance: 0.8070 (R1), 0.8180 (R2), 0.8270 (R3)
WTI continued tumbling
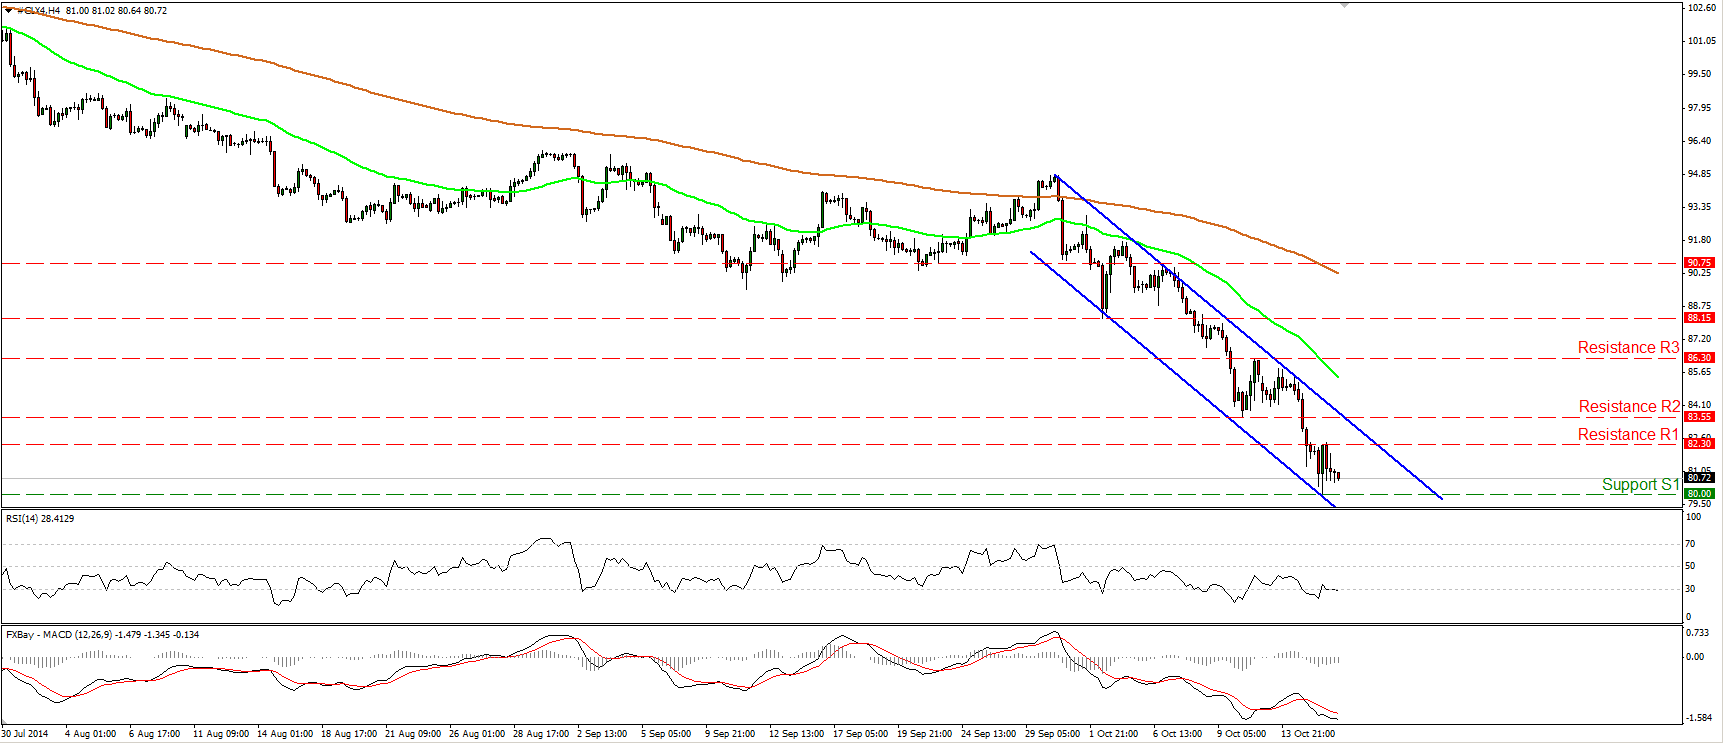
WTI continued falling yesterday touching the psychological line of 80.00 (S1). The price structure remains lower highs and lower lows below both the 50- and the 200-period moving averages, keeping the downtrend intact. On the daily chart, the 14-day RSI dipped within its oversold territory and is pointing down, while the MACD remains below both its zero and signal lines. This designates accelerating bearish momentum and magnifies the case for further declines. Nevertheless, I would prefer to see a strong move below the psychological hurdle of 80.00 (S1) before getting more confident on the downside. Such a move could trigger extensions towards our next support barrier, at 77.50 (S2), determined by the lows of June 2012
• Support: 80.00 (S1), 77.50 (S2), 77.50 (S3)
• Resistance: 82.30 (R1), 83.55 (R2), 86.30 (R3)
Gold moves above the 1235/40 area
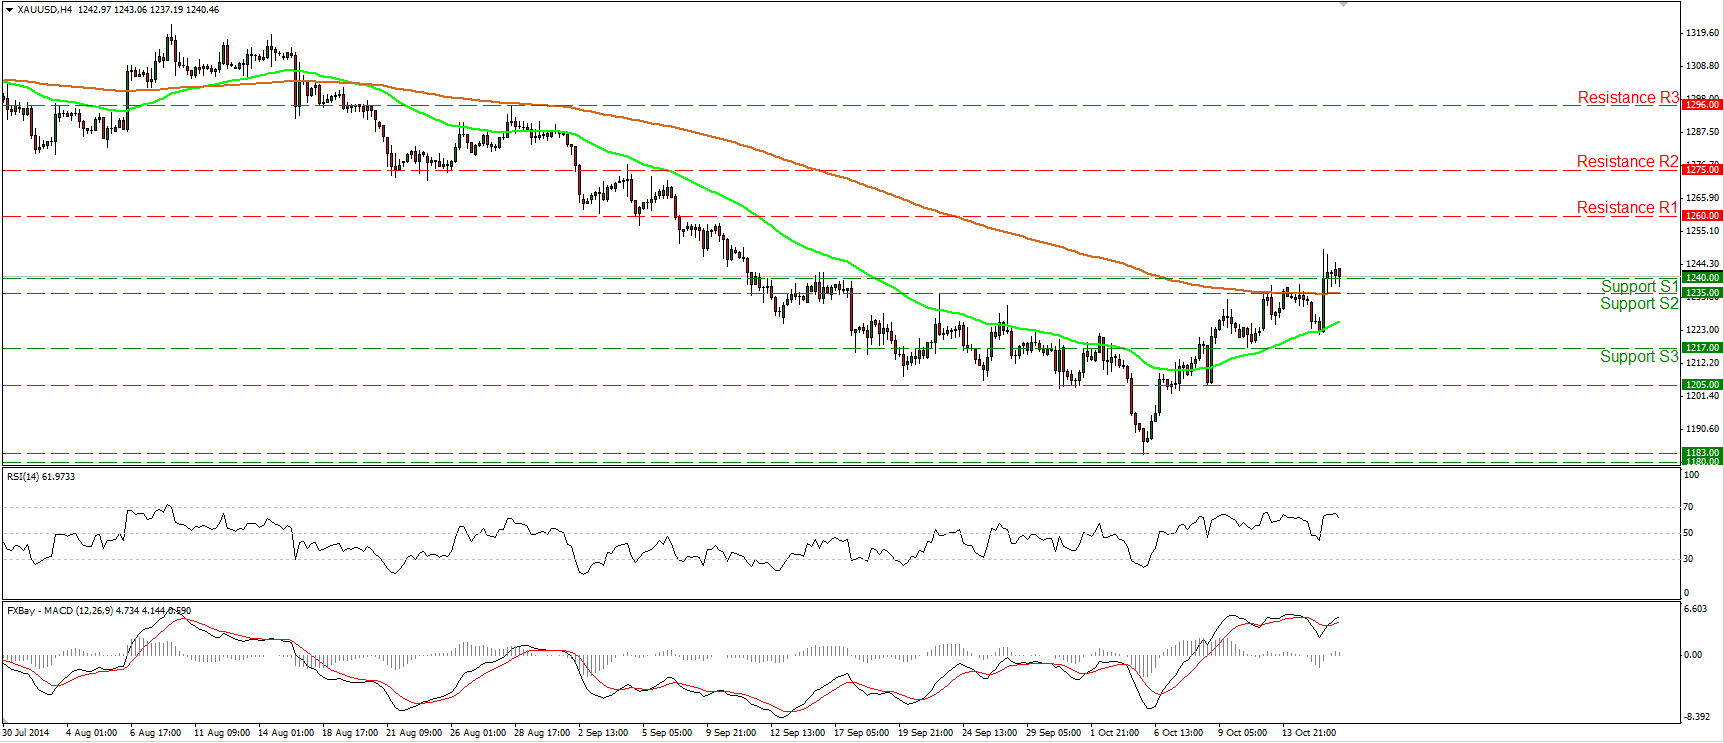
Gold rallied yesterday on the disappointing US data, breaking above the resistance zone of 1235/40 and the 200-period moving average. During the early European morning, the precious metal is trading fractionally above that zone. I would now expect the bulls to take advantage of that break and push the price towards the 1260 (R1) resistance obstacle. Changing our timeframe to the daily chart, I see that alongside the metal’s move above the 1235/40 zone, the 14-day RSI moved above its 50 line. Moreover, the daily MACD, already above its trigger line, is approaching its zero line and could get a positive sign in the near future. This supports the scenario for further advances in the near future, nonetheless, coming back to the 4-hour chart, the RSI turned down after finding resistance below its 70 line, thus we may experience a pullback before the bulls take the reins again.
• Support: 1240 (S1), 1235 (S2), 1217 (S3)
• Resistance: 1260 (R1), 1275 (R2), 1296 (R3)
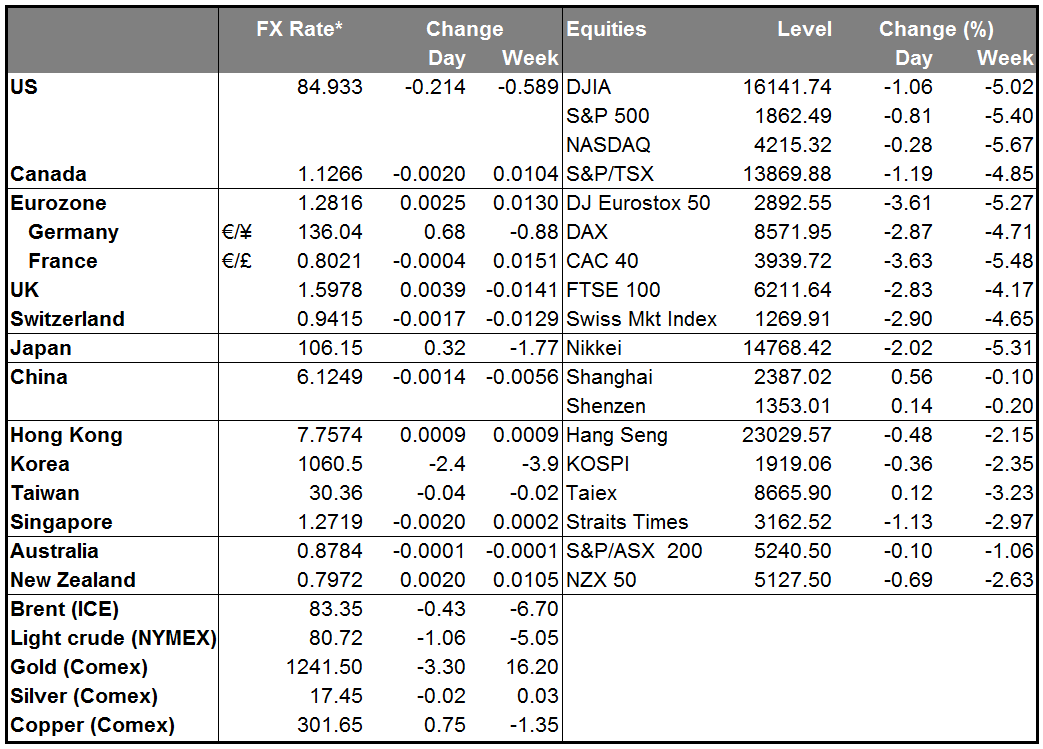
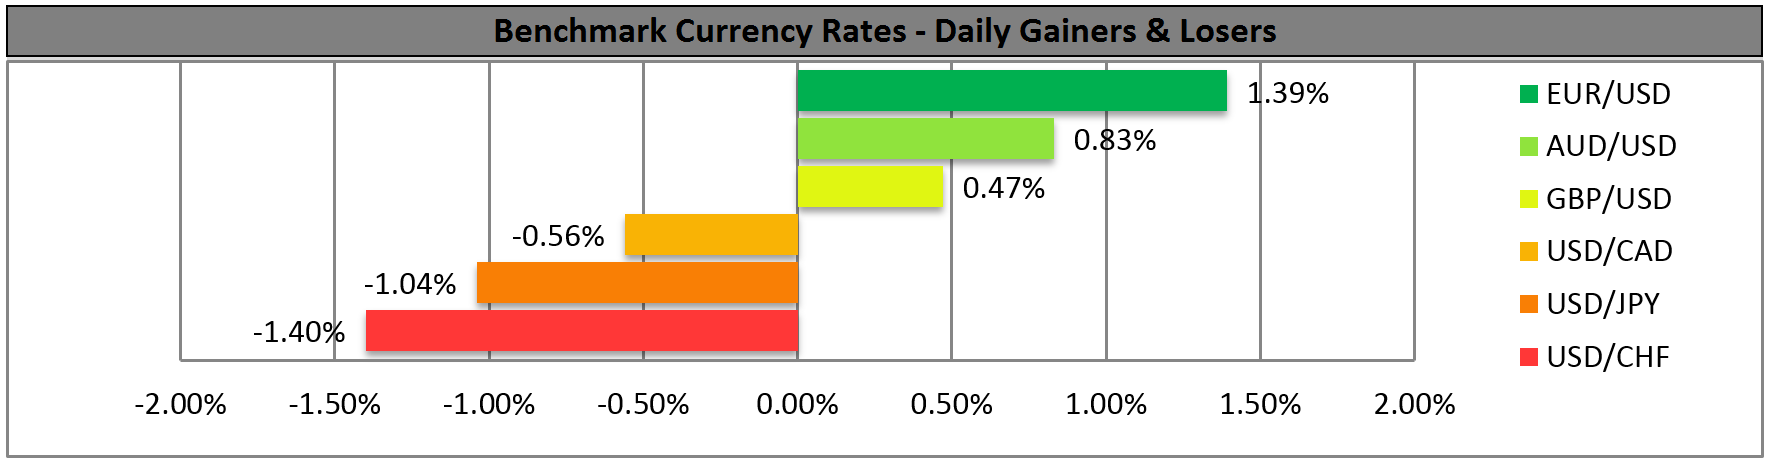
BENCHMARK CURRENCY RATES - DAILY GAINERS AND LOSERS
MARKETS SUMMARY