EUR/USD waits for the ZEW survey
EUR/USD traded virtually unchanged on Monday, remaining below the psychological barrier of 1.3000 (R1) and the lower boundary of the blue downside channel, connecting the highs and the lows on the daily chart. The MACD remains near its zero line and could become positive in the near future, while the RSI crossed again above its 50 line. These momentums signs favor more upside, perhaps a test at the psychological line of 1.3000 (R1) as a resistance this time. Nevertheless, taking into account that the German ZEW indices for September are expected to decline, we may see the pair lower. A bad release could probably open the way for another test near the support of 1.2860 (S1) in the near future. A clear break below 1.2860 (S1) is likely to trigger extensions towards the key support zone of 1.2760 (S2), defined by the lows of March and July 2013.
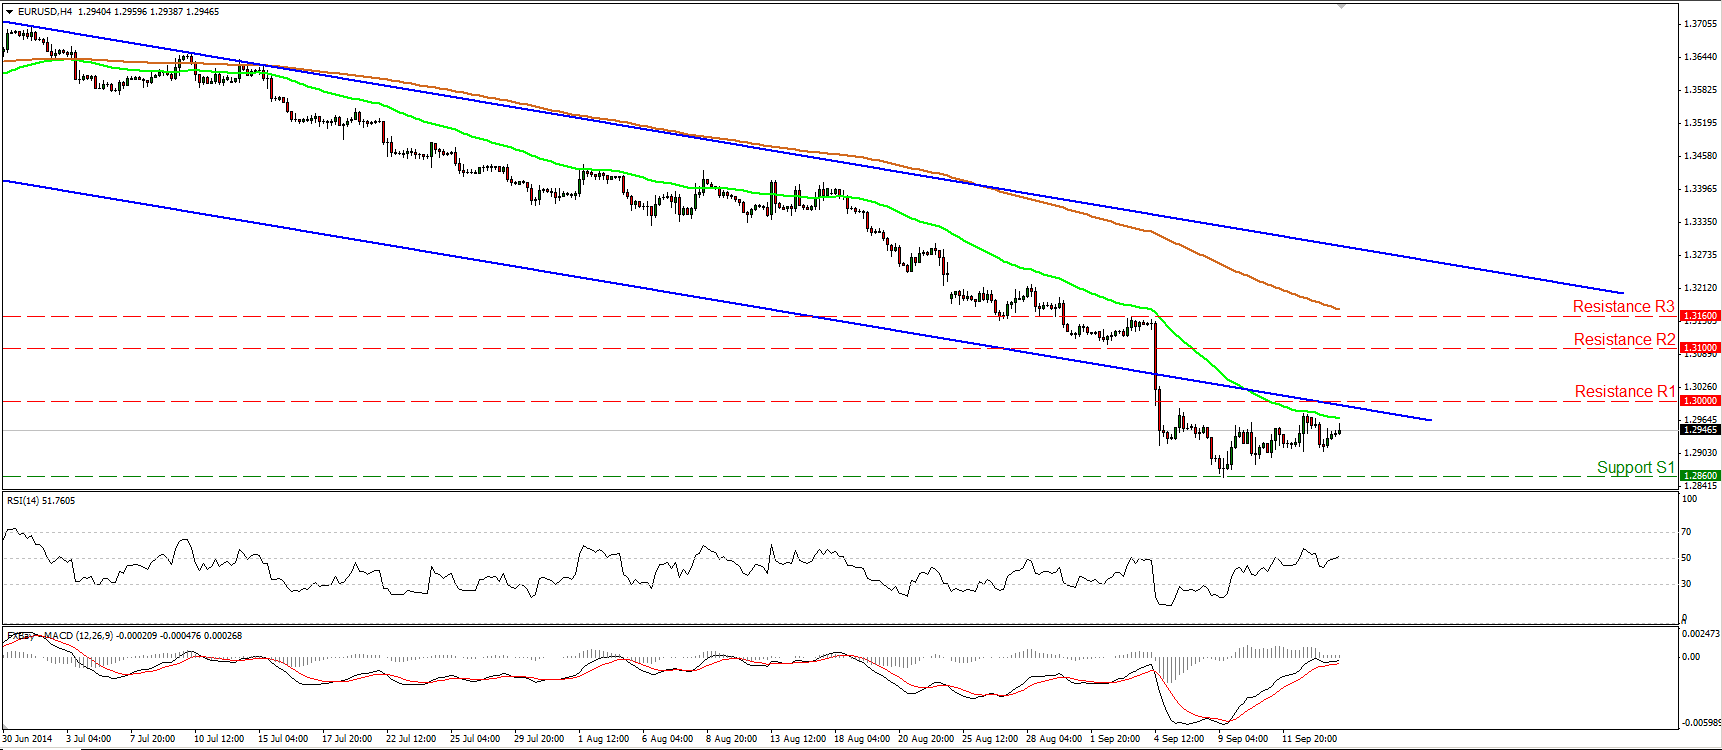
• Support: 1.2860 (S1), 1.2760 (S2), 1.2660 (S3)
• Resistance: 1.3000 (R1), 1.3100 (R2), 1.3160 (R3)
GBP/JPY pulls back

GBP/JPY moved lower after finding resistance at 174.65 (R2). Today we get the UK CPI for August, which is expected to have slowed. As a result, I would expect the pullback to continue, perhaps for a test near the support line of 173.25 (S1). Our momentum studies also support the notion. The RSI moved lower after exiting its overbought field, while the MACD has topped and fell below its signal line. As for the bigger picture, under normal circumstances I would see a cautiously positive overall outlook, since last week’s rally signaled the exit of a broadening formation on the daily chart. However, I would prefer to wait for the results of the Scottish independence referendum before taking a more confident view regarding the overall picture of this currency pair.
• Support: 173.25 (S1), 172.75 (S2), 171.60 (S3)
• Resistance: 173.95 (R1), 174.65 (R2), 175.30 (R3)
AUD/USD rebounds from near 0.9000
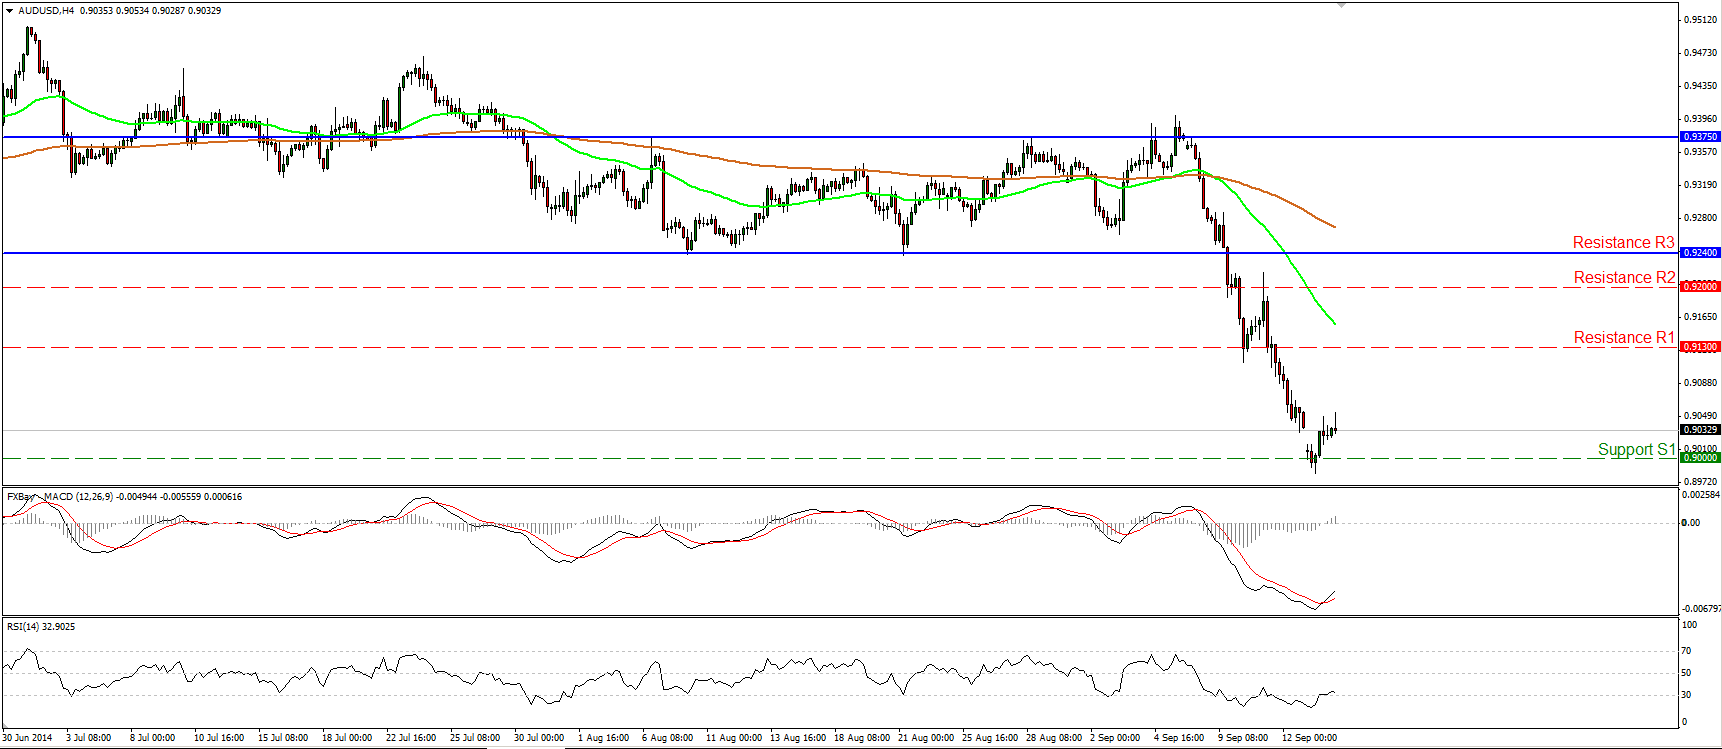
AUD/USD reached the psychological line of 0.9000 (S1) as expected, but after finding some buy orders below that line, the pair rebounded. The price structure remains lower highs and lower lows below both the 50- and the 200-period moving averages, thus I would consider the rebound as a corrective move for now. However, taking a look on our momentum studies I see a possibility that the retracement may continue. The MACD lies above its trigger and is pointing up, while the RSI exited its oversold field. I would wait for a dip below the psychological hurdle of 0.9000 (S1) to pull the trigger for extensions towards our next support line of 0.8920 (S2), the low of the 12th of March. In the bigger picture, the dip below 0.9240 signaled the downside exit of the sideways path (marked by the blue horizontal lines) and turned the picture negative.
• Support: 0.9000 (S1), 0.8920 (S2), 0.8890 (S3)
• Resistance: 0.9130 (R1), 0.9200 (R2), 0.9240 (R3)
Gold approaches 1240

Gold moved higher during the Asian morning Tuesday, and in early European trading is slightly below the resistance line of 1240 (R1) and the lower line of the purple downside channel, connecting the highs and the lows on the daily chart. Bearing in mind that the RSI moved higher after exiting overbought conditions and that the MACD crossed above its signal line, I would expect the metal to continue its advance and at least challenge the 1240 (R1) zone as a resistance. Nevertheless, as long as the yellow metal is printing lower highs and lower lows below the prior black support line, I see a negative overall picture and I would consider the recent rebound as a bounce before the bears prevail again.
• Support: 1225 (S1), 1220 (S2), 1200 (S3)
• Resistance: 1240 (R1), 1250 (R2), 1260 (R3)
WTI remains trendless
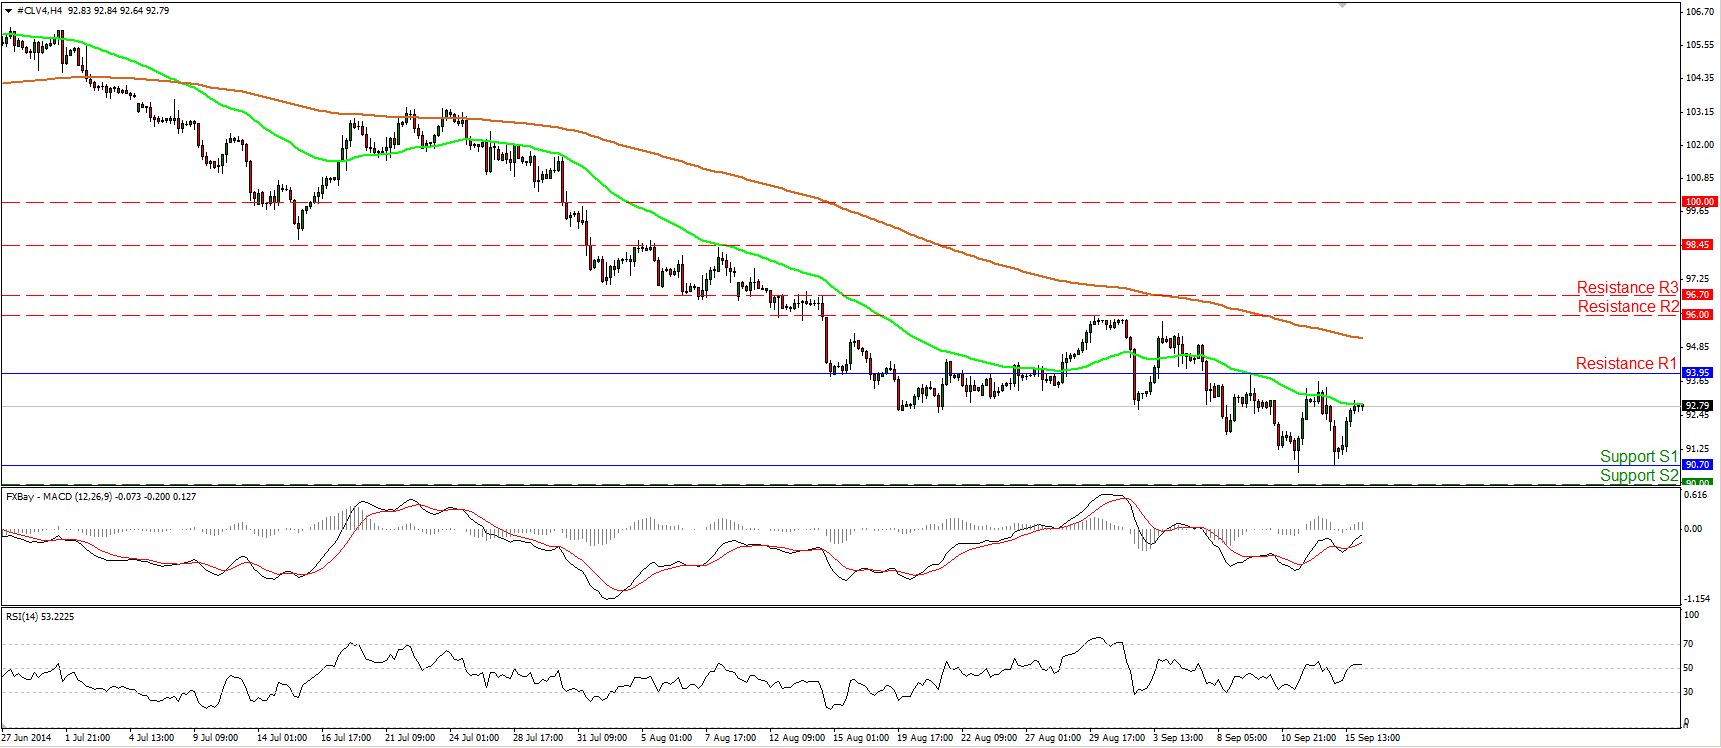
WTI moved higher yesterday after finding support at 90.70 (S1). This confirms my choice to maintain my neutral stance despite Friday’s fall. As long as the price is trading between the aforementioned support and the resistance of 93.95 (R1), I would consider the path of WTI to be to the sideways. I would wait for a move below the psychological level of 90.00 (S2) before shifting my attention to the downside. Such a break is likely to trigger extensions to the 85.75 (S3) area, defined by the lows of the 18th of April 2013. On the other hand, I believe that only a clear move above 93.95 (R1) could flip the bias to the upside, perhaps towards our next resistance at 96.00 (R2).
• Support: 90.70 (S1), 90.00 (S2), 85.75 (S3)
• Resistance: 93.95 (R1), 96.00 (R2), 96.70 (R3)
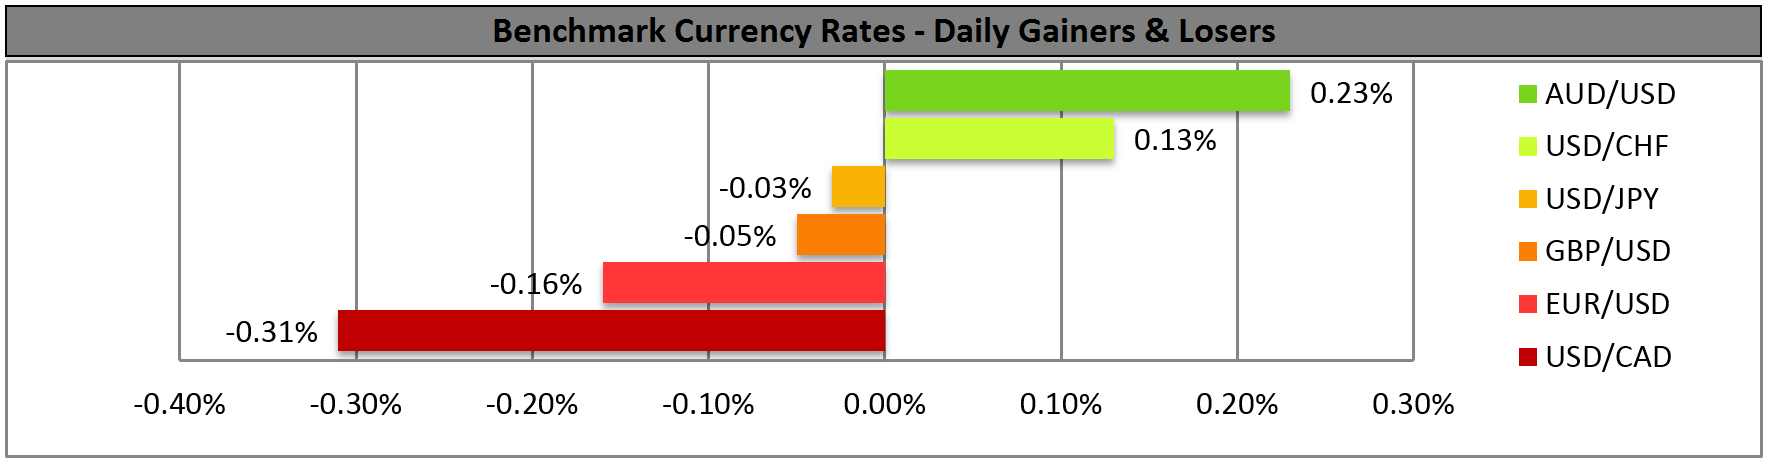
BENCHMARK CURRENCY RATES - DAILY GAINERS AND LOSERS
MARKETS SUMMARY