EUR/USD breaks below 1.3580
EUR/USD declined on Tuesday, violating the 1.3580 barrier, the lower boundary of the recent sideways path it’s been trading recently. I believe that such a dip carries larger bearish extensions and paves the way towards the psychological zone of 1.3500 (S1). In my view, the rate seems to have the necessary momentum to challenge that zone, since the MACD fell below both its zero and signal lines while the RSI has further to go before signaling oversold conditions. On the daily chart the rate is back below the 200-day moving average, while our daily momentum studies moved lower, leaving their neutral levels. Bearing all these indications, I would change my stance from neutral to negative.
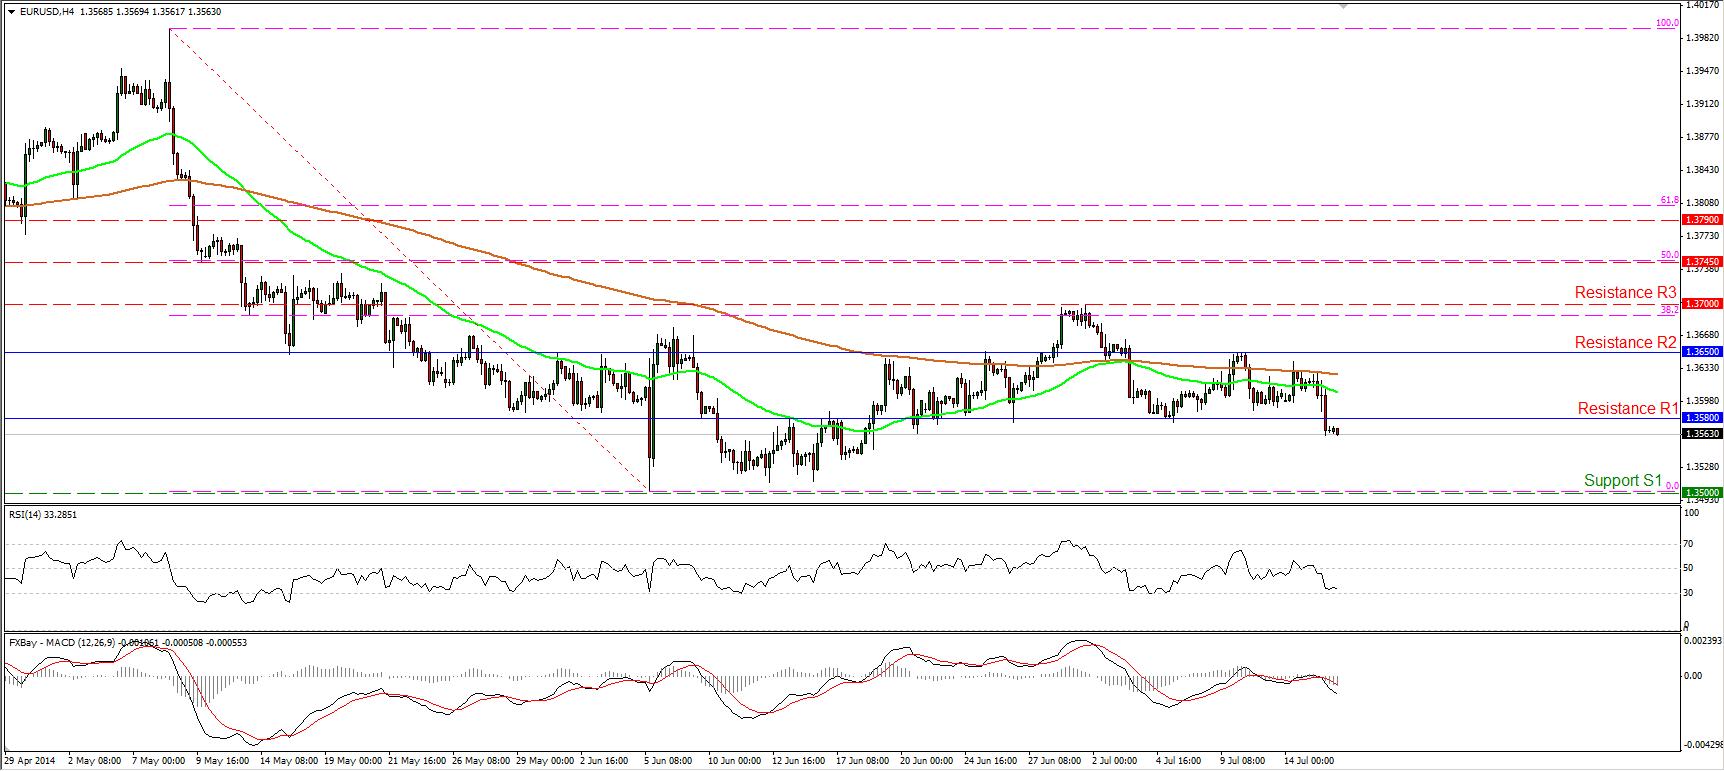
• Support: 1.3500 (S1), 1.3475 (S2), 1.3400 (S3).
• Resistance: 1.3580 (R1), 1.3650 (R2), 1.3700 (R3).
EUR/JPY finds resistance at 138.45
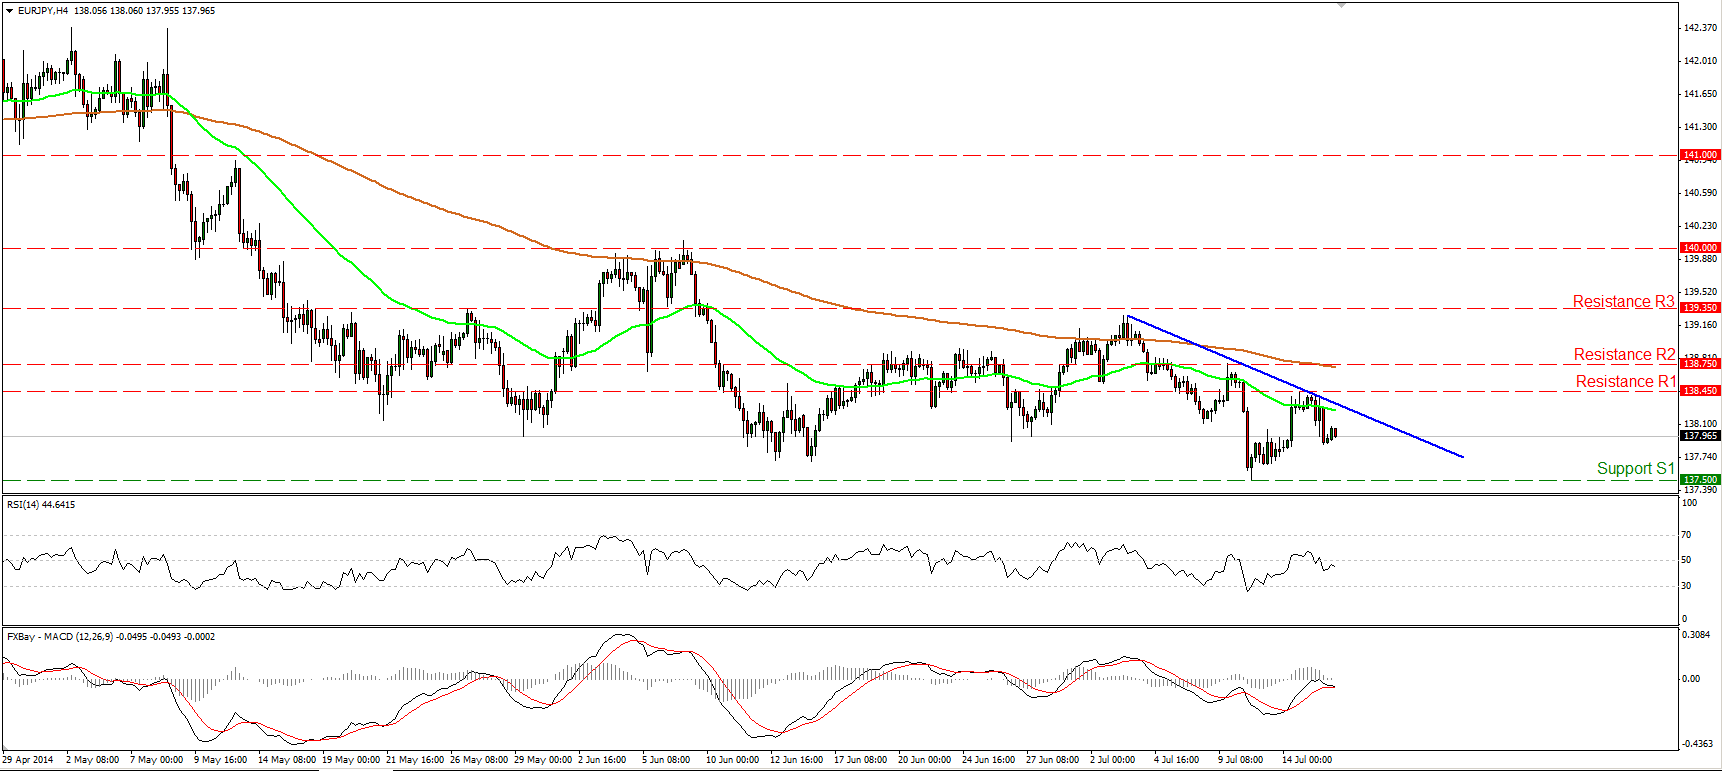
EUR/JPY moved lower, forming a lower high, after finding resistance at 138.45 (R1). The RSI remains below its 50 level, pointing down, while the MACD, already within its negative zone, seems ready to fall below its signal line. Taking this into account I would expect the rate to continue declining and challenge the support barrier of 137.50 (S1). Nevertheless, we need a clear dip below that level to have a forthcoming lower low and the continuation of the minor term downtrend. On the daily chart, I cannot identify a clear trending structure, thus I would consider the longer-term path of EUR/JPY to be to the sideways. Moreover, the price oscillates between the 50- and the 200-day moving average, which are pointing sideways, corroborating my neutral view as far as the long-term picture is concerned.
• Support: 137.50 (S1), 136.75 (S2), 136.20 (S3).
• Resistance: 138.45 (R1), 138.75 (R2), 139.35 (R3).
GBP/USD surges after surprising CPI data
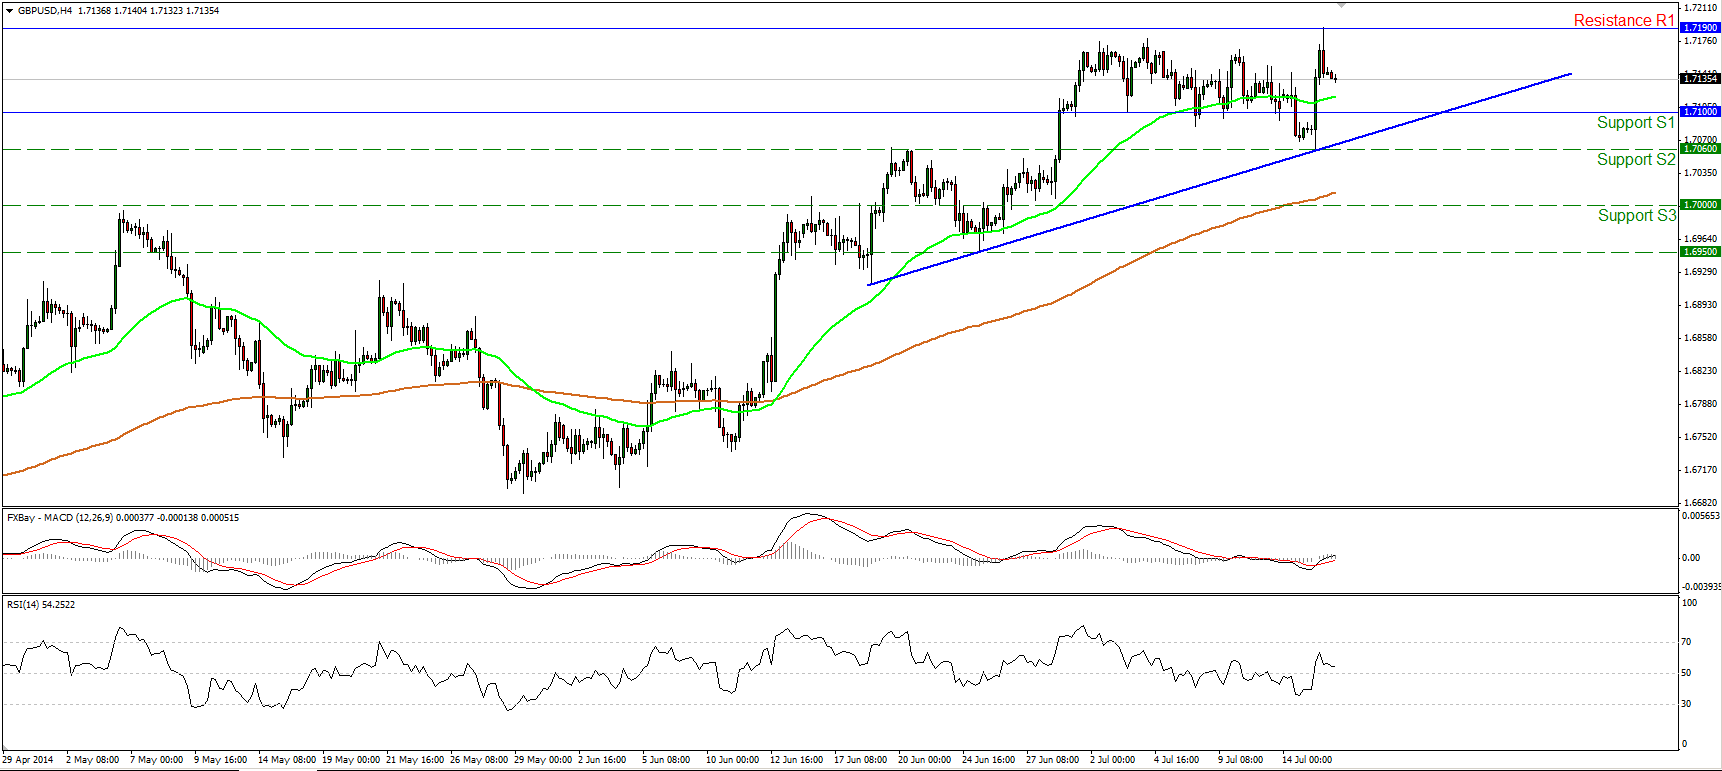
GBP/USD rebounded strongly from our support zone of 1.7060 (S2), moved back above 1.7100 (S1) and surged to find resistance at 1.7190 (R1). The MACD poked its nose above both its zero and trigger lines, but the RSI turned down after crossing above its 50-level. On the 1-hour chart, both our momentum studies are declining, indicating decelerating momentum after the strong rally. Considering our momentum indications, the short-term picture is cautiously positive, in my view, and a decisive move above 1.7190 (R1) could signal another higher peak and is likely to pave the way towards the 1.7300 (R2) zone. On the daily chart, the 80-day exponential moving average provides reliable support to the lows of the price action, keeping the long-term path to the upside.
• Support: 1.7100 (S1), 1.7060 (S2), 1.7000 (S3).
• Resistance: 1.7190 (R1), 1.7300 (R2), 1.7400 (R3).
Gold bears prevail after a brief pause
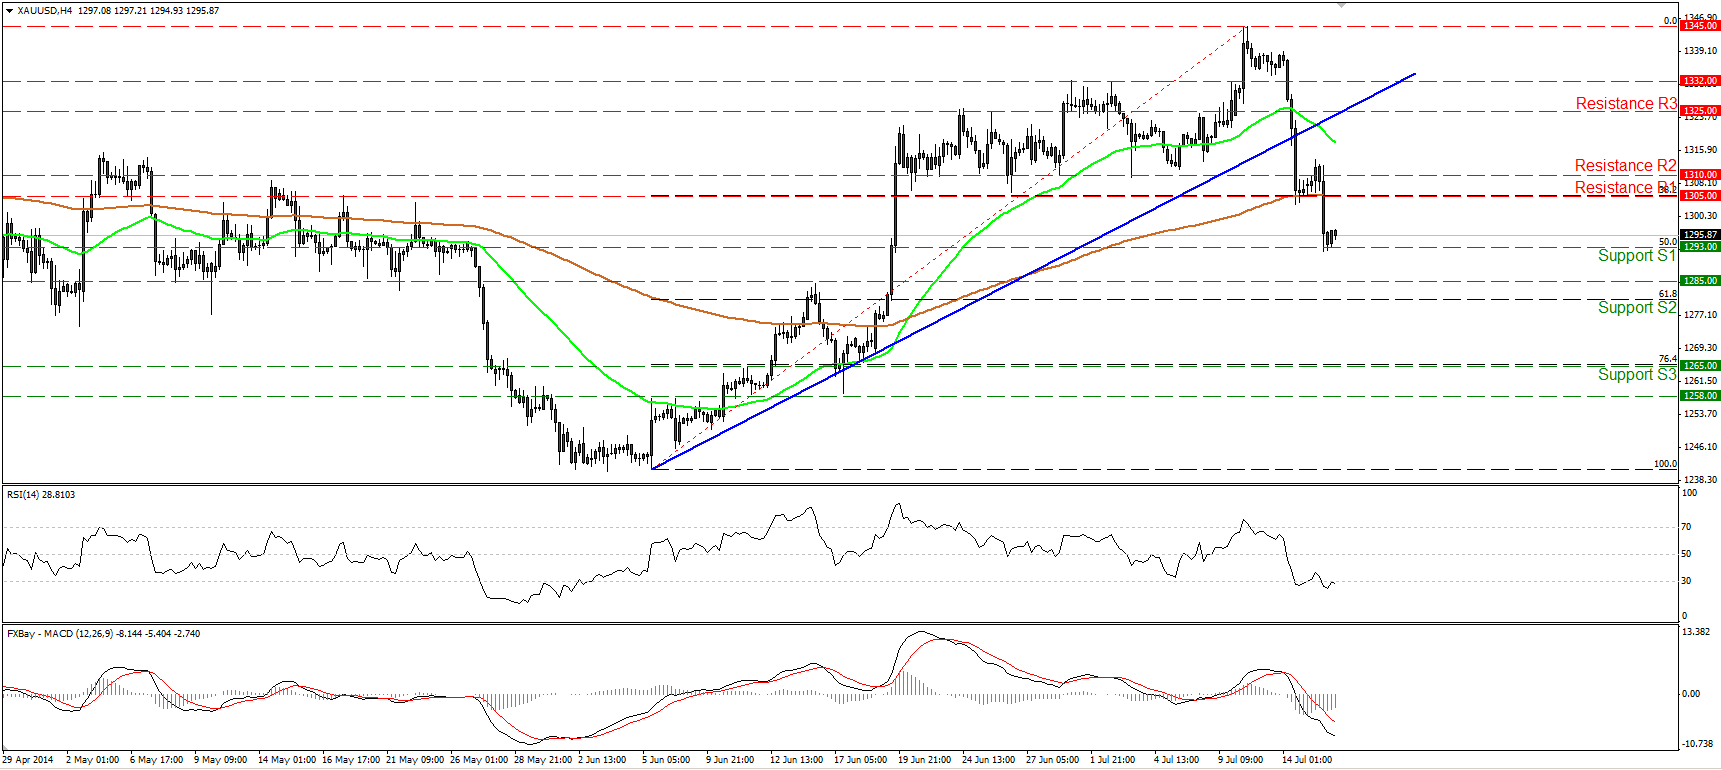
Gold continued tumbling, after a small bounce from the 1305 barrier and the 200-period moving average, also the 38.2% retracement level of the 5th June – 10th of July advance. The precious metal dipped below that support (turned into resistance) zone to find support at 1293 (S1), the 50% retracement level of the aforementioned advance. The picture remains negative in my view and a clear move below 1293 (S1) could target the next obstacle at 1285 (S2). The RSI, already within its oversold zone, touched its 30 level and turned down again, while the MACD remains below both its zero and trigger lines. This confirms yesterday’s negative momentum. Nevertheless, zooming in on the 1-hour chart, I see positive divergence between our hourly momentum studies and the price action, and as a result I cannot rule out another pause near 1293 (S1) before the bears take control again.
• Support: 1293 (S1), 1285 (S2), 1265 (S3).
• Resistance: 1305 (R1), 1310 (R2), 1325 (R3).
WTI dips below 100.40, but rebounds from 99.00
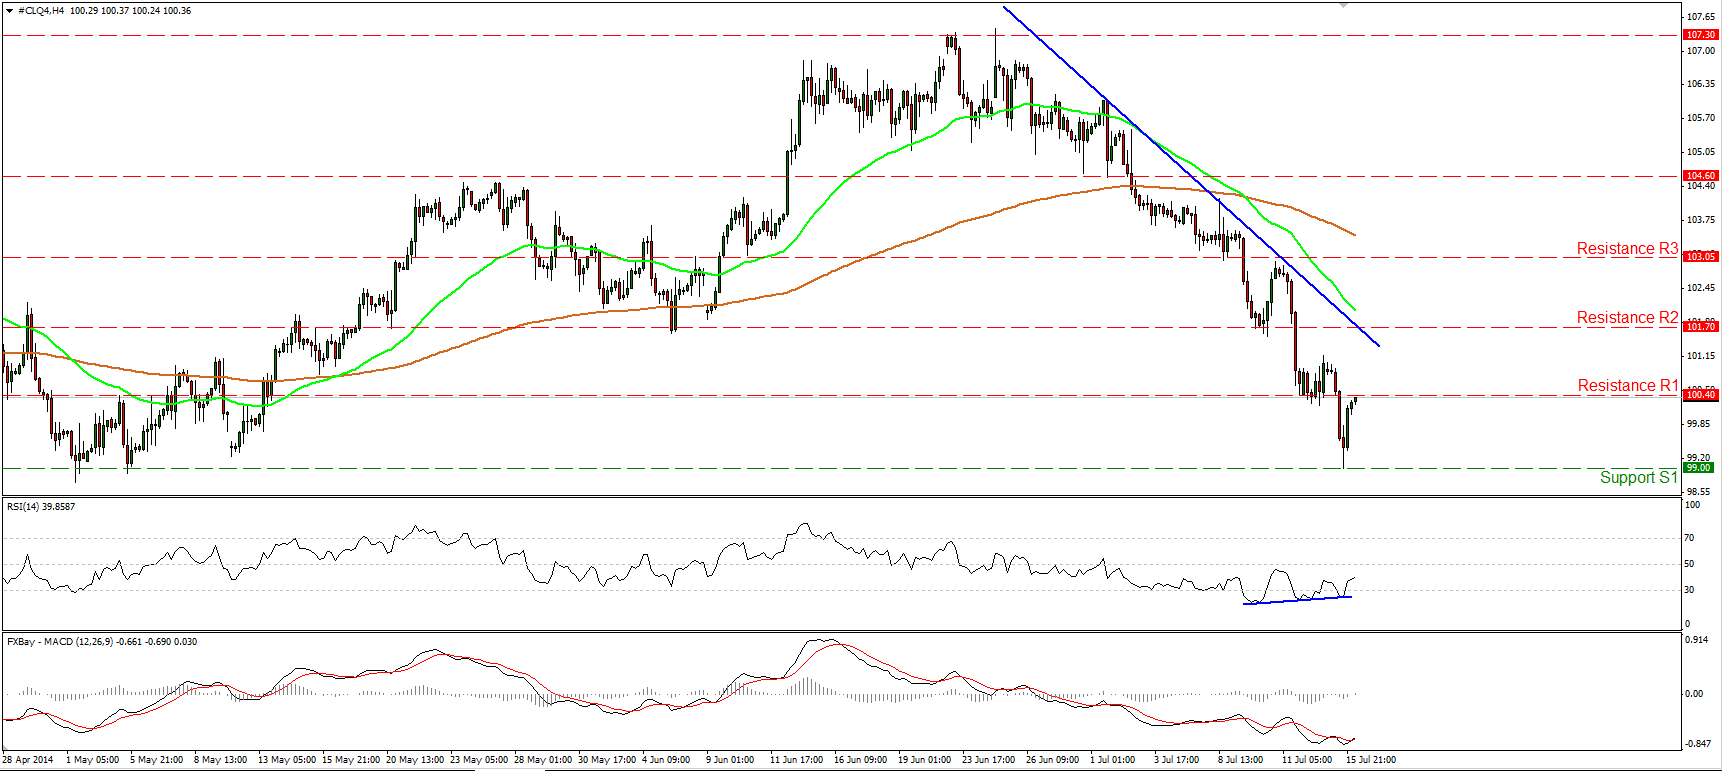
WTI fell sharply yesterday, breaking below the 100.40 zone and reaching the support barrier of 99.00 (S1), where it triggered some buy orders and rebounded strongly. Although the move confirmed a lower low and kept the downtrend in motion, the positive divergence between the RSI and the price action is still in effect, while the MACD, although in its negative field, crossed above its signal line. Bearing that in mind, I would remain flat for today, since the upside corrective wave may continue, and I would wait for a dip below 99.00 (S1) before expecting further declines.
• Support: 99.00 (S1), 98.00 (S2), 97.00 (S3).
• Resistance: 100.40 (R1), 101.70 (R2), 103.05 (R3).
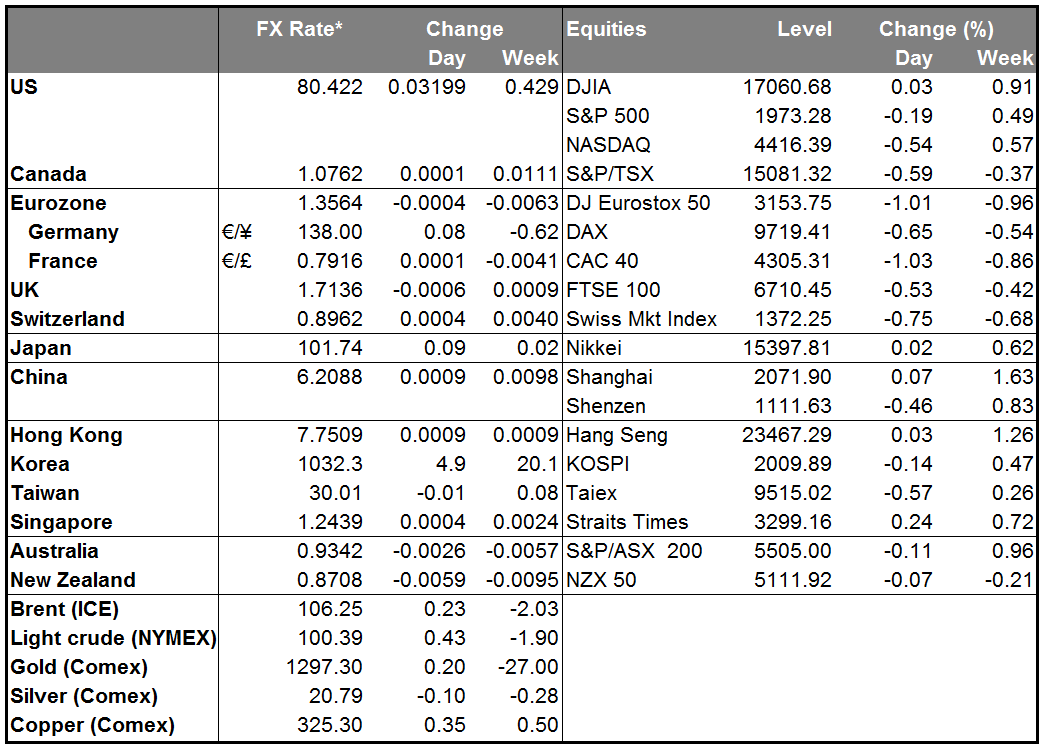
BENCHMARK CURRENCY RATES - DAILY GAINERS AND LOSERS

MARKETS SUMMARY