EUR/USD declines after hitting the 1.2760/90 zone
EUR/USD moved lower after finding resistance in the 1.2760/90 area. That area acted as a major support back in 2013 and it now acts as a major resistance, preventing the bulls from driving the battle higher. However, only a dip below 1.2600 (S1) is likely to signal that the 3rd – 14th October corrective move is completed in that zone. Such a move could target once again the 1.2500 (S2) psychological level, which happens to be the 76.4% retracement level of the July 2012-May 2014 major advance. On the daily chart, as long as the price structure remains lower peaks and lower troughs below both the 50- and the 200-day moving averages, I will maintain the view that the overall path remains to the downside. Hence, I will treat the recent up move or any extensions of it as a corrective phase for now.
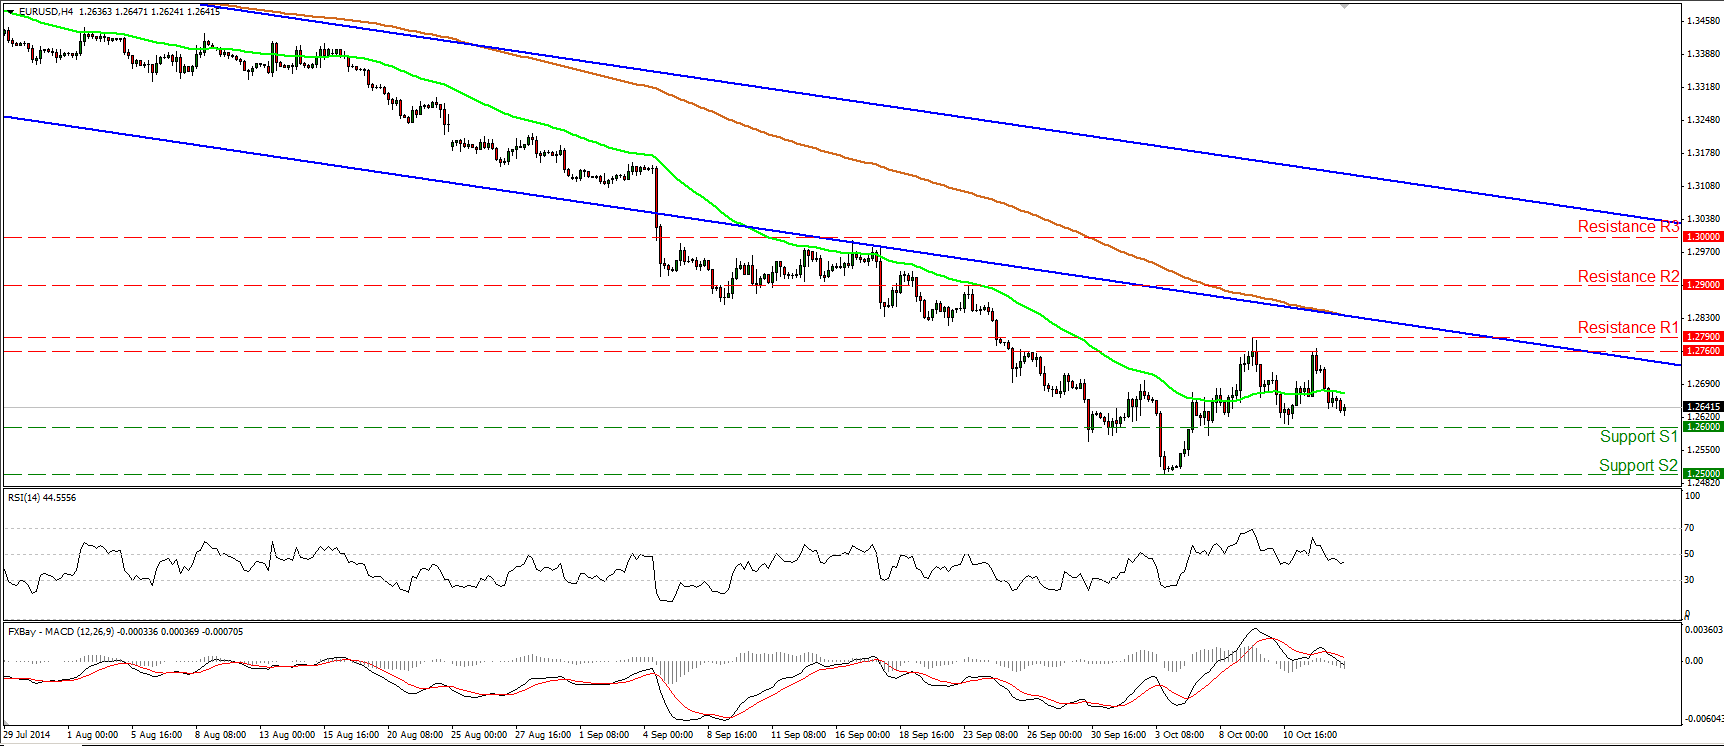
• Support: 1.2600 (S1), 1.2500 (S2), 1.2465 (S3)
• Resistance: 1.2790 (R1), 1.2900 (R2), 1.3000 (R3)
GBP/USD tumbles after UK inflation slows
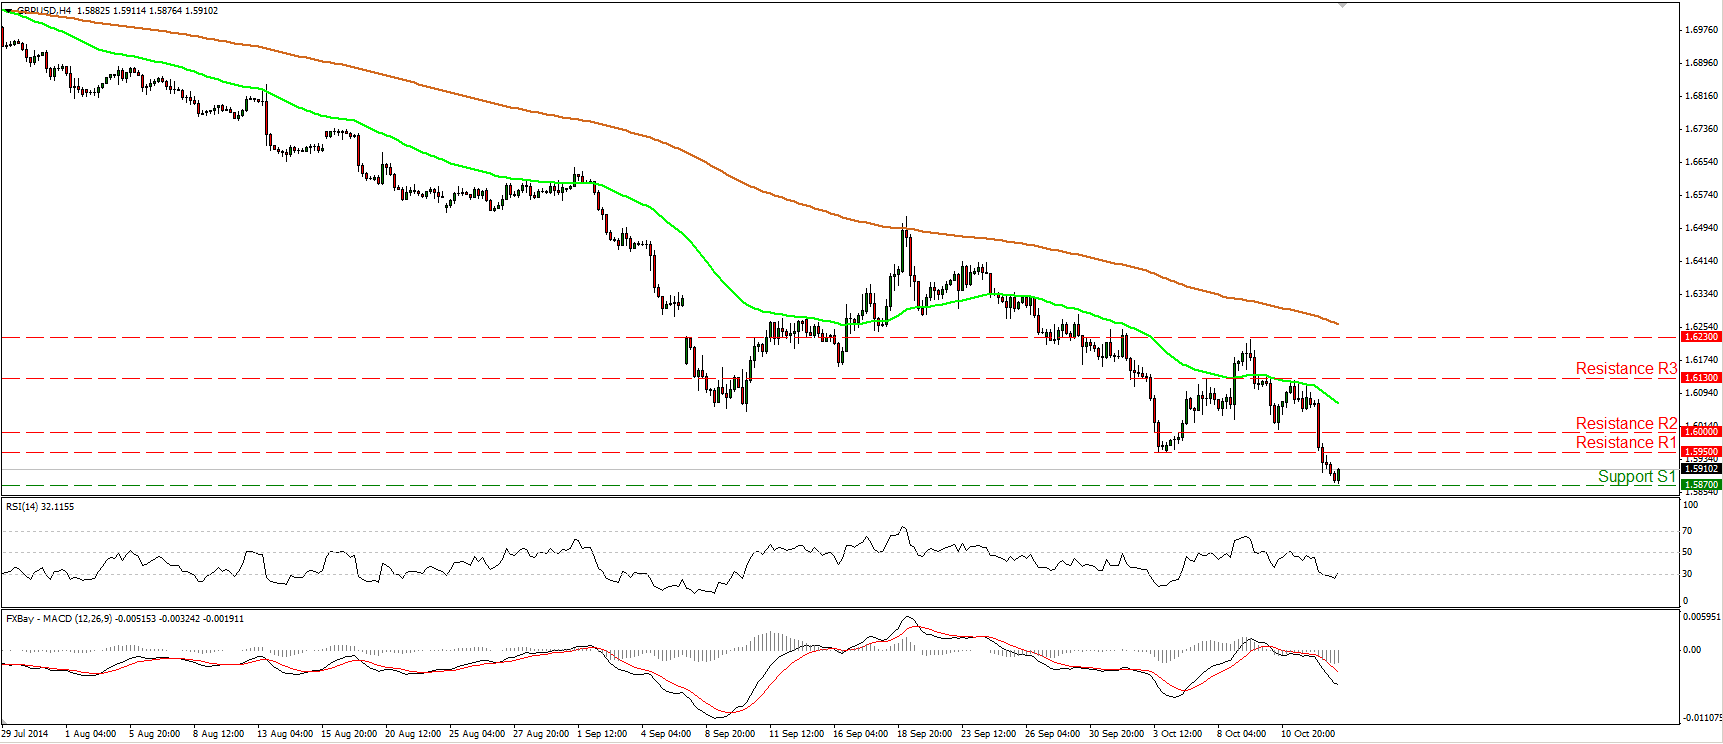
GBP/USD tumbled after data showed that the UK CPI slowed to a five year low. The release caused the bears to push the rate below 1.6000 and to break our support (turned into resistance line) of 1.5950. During the early European morning, the rate is trading near the support line of 1.5870 (S1), where a clear and decisive dip could see scope for larger bearish extensions, perhaps towards the resistance-turned-into-support line of 1.5720 (S2), defined by the high of the 21st of August 2013. That barrier also happens to be the 61.8% retracement level of the July 2013 - July 2014 uptrend. However, today we get the UK employment data, which are expected to prove positive for the pound. This could cause a short-term bounce before the bears prevail again. As far as the broader trend is concerned, I will stick to the view that as long as Cable is trading below the 80-day exponential moving average, the overall path remains to the downside.
• Support: 1.5870 (S1), 1.5720 (S2), 1.5565 (S3)
• Resistance: 1.5950 (R1), 1.6000 (R2), 1.6130 (R3)
EUR/JPY finds support near 135.00

EUR/JPY declined on Tuesday, but after finding support near the psychological line of 135.00 (S1), it rebounded somewhat. Having in mind that I see positive divergence between the RSI and the price action, I would be cautious that the rebound may continue. However, as long as the price is printing lower highs and lower lows below both the moving average, I still see a negative picture and I would consider any extensions of yesterday’s rebound as corrective move before the bears prevail again. If I see a clear close below the key line of 135.00, I will get more confident on the downside and I would expect extensions towards our next support obstacle, at 134.10 (S2), marked by the low of the 20th of November 2013.
• Support: 135.00 (S1), 134.10 (S2), 133.20 (S3)
• Resistance: 135.90 (R1), 136.60 (R2), 137.00 (R3)
WTI plunges

WTI plunged on Tuesday, breaking below the support (turned into resistance) line of 83.55 (R1) and finding support at 81.30 (S1). If the bears are strong enough to overcome that line, I would expect them to trigger extensions towards the psychological line of 80.00 (S2). Our daily oscillators support the notion. The RSI dipped below 30 and is pointing down, while the MACD remains below both its zero and signal lines. This designates accelerating negative momentum and magnifies the case for further declines in the near future. In the bigger picture, as long as the price structure remains lower highs and lower lows below both the 50- and the 200- day moving averages, I would consider the overall picture of WTI to be to the downside.
• Support: 81.30 (S1), 80.00 (S2), 77.50 (S3)
• Resistance: 83.55 (R1), 86.30 (R2), 88.15 (R3)
Gold finds resistance in the 1235/40 area

Gold declined yesterday after finding strong resistance in the 1235/1240 zone and near the 200-period moving average. The 38.2% retracement level of the 8th August – 6th October decline also lies within the 1235/40 zone. A clear and decisive break above that key resistance area is the move that could probably pull the trigger for another leg higher, perhaps towards our next resistance hurdle at 1260 (R3). However, having a look at our short-term momentum studies, I would be mindful of further pullback in the close future. The RSI moved lower and is now testing its 50 line, while the MACD, although positive, fell below its signal line. As far as the broader trend is concerned, I would maintain my “wait and see” stance for the same reasons I mentioned last week. On the 6th of October, the yellow metal rebounded strongly from the critical support zone of 1180/83, defined by the lows of June and December 2013, but the absence of any bullish trend reversal signals makes it premature to argue about any uptrend scenarios, in my view.
• Support: 1217 (S1), 1205 (S2), 1183 (S3)
• Resistance: 1235 (R1), 1240 (R2), 1260 (R3)
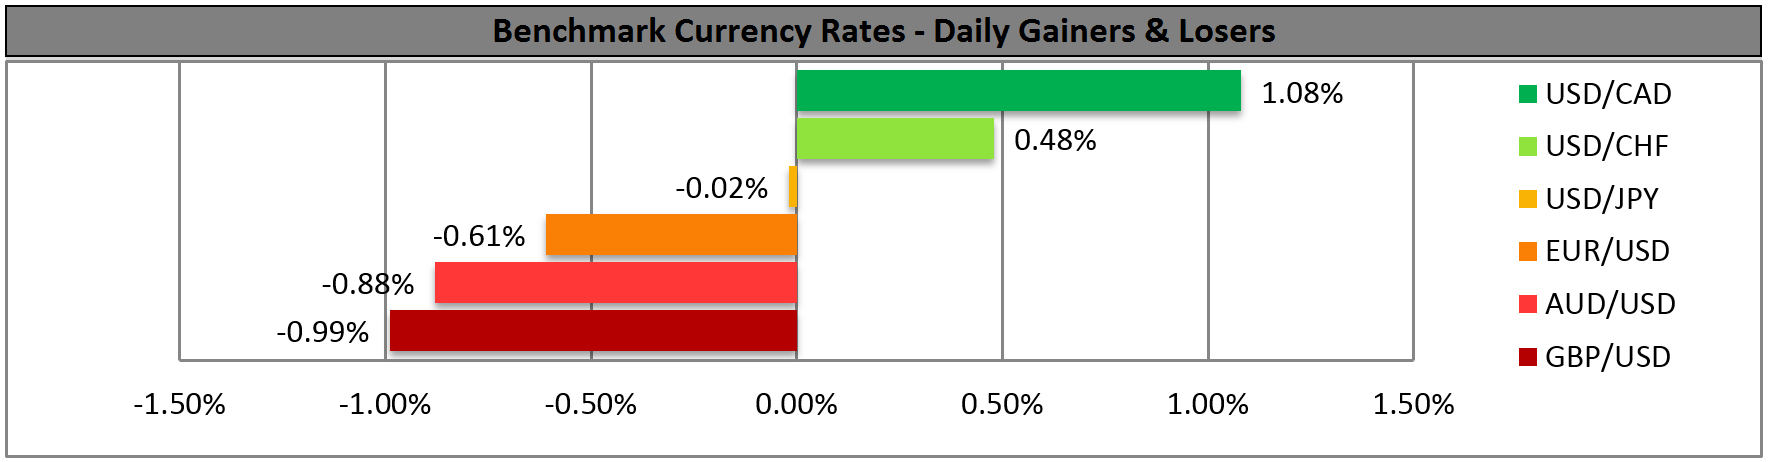
BENCHMARK CURRENCY RATES - DAILY GAINERS AND LOSERS
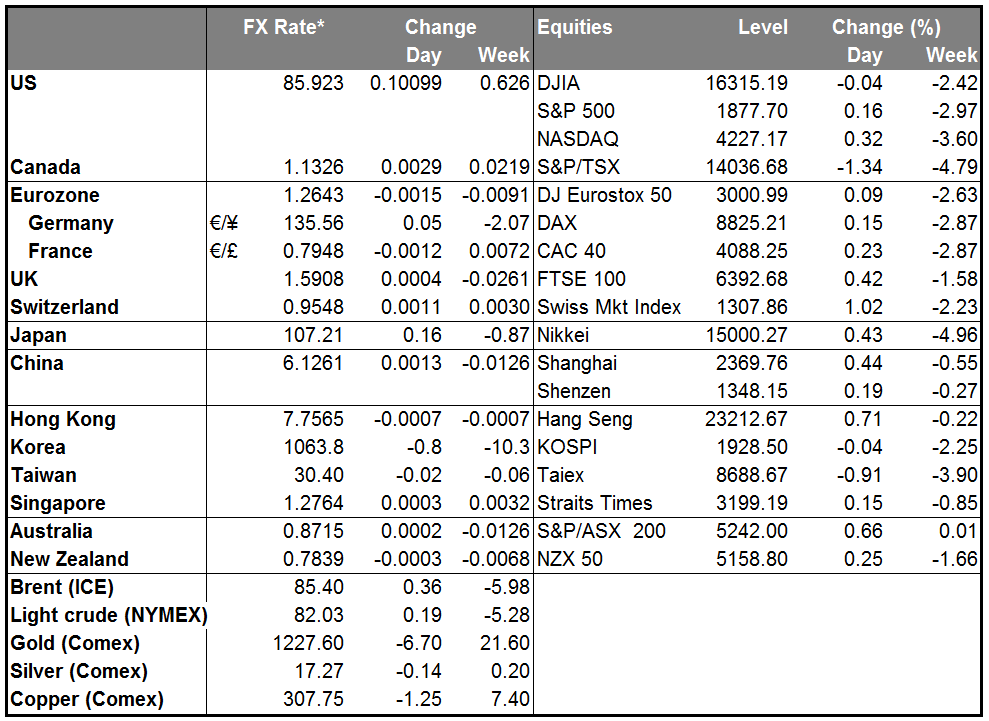
MARKETS SUMMARY