EUR/USD still in a symmetrical triangle
EUR/USD remains capped below the 50-period moving average and within the symmetrical triangle formation. There were a couple of attempts to break the near-term trend line, but none of them found much support. The directionless movement of the pair reflect investors’ concerns ahead of today’s Eurozone’s GDP figures. The recent data suggest that growth in the bloc is slowing, which could trigger the breakout and set the direction of the pair. Usually symmetrical triangles are thought of as a continuation pattern and a break in either direction is likely to determine the near-term bias. Given the sluggish growth outlook for the bloc, this put more chances of a downward breakout, in my view.
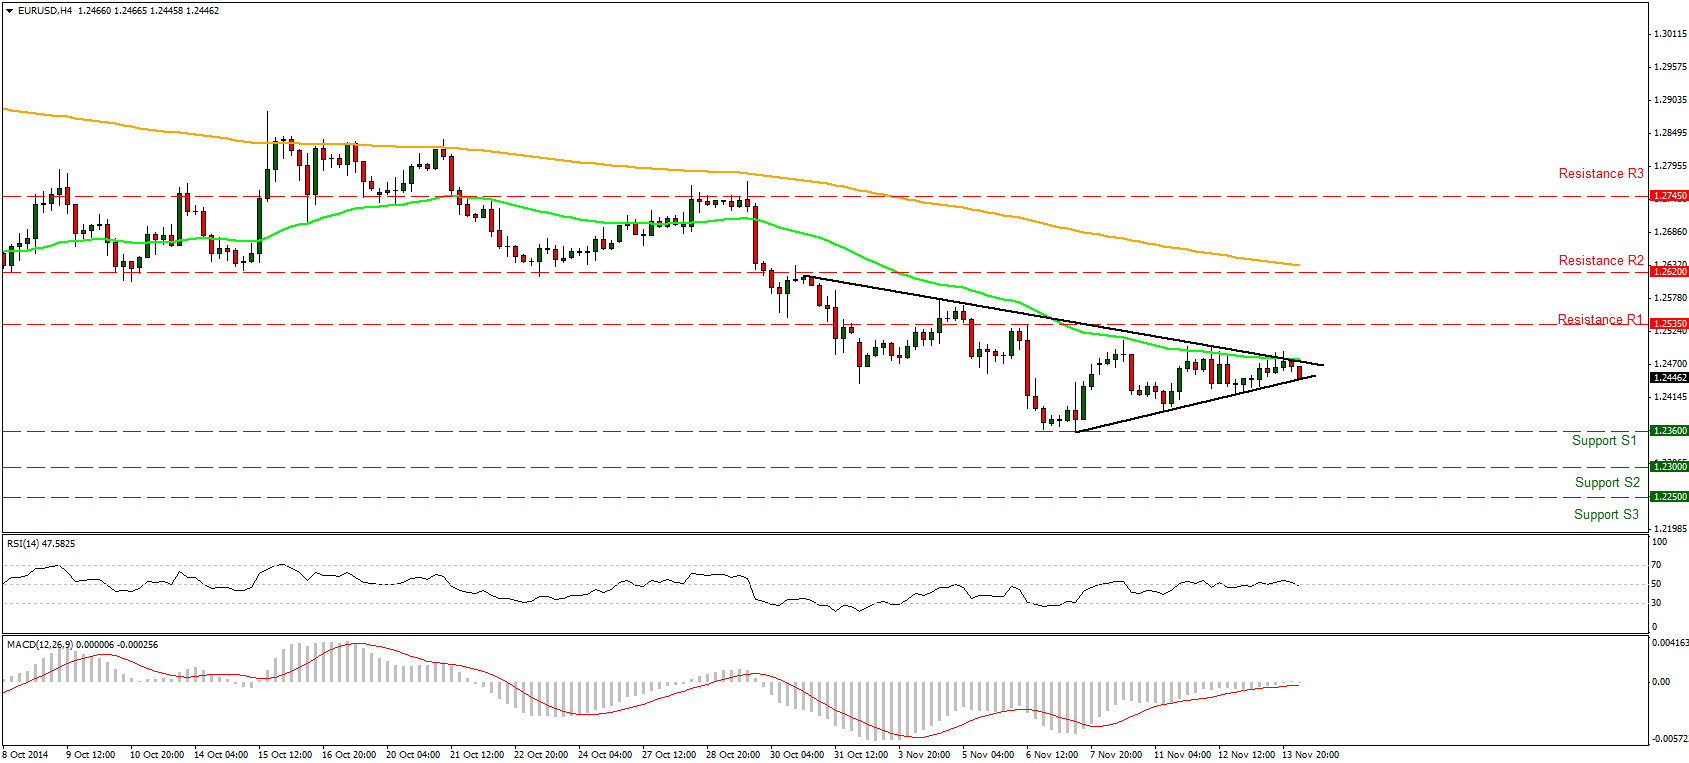
• Support: 1.2360 (S1), 1.2300 (S2), 1.2250 (S3).
• Resistance: 1.2535 (R1), 1.2620 (R2), 1.2745 (R3).
GBP/USD tumbled on Thursday
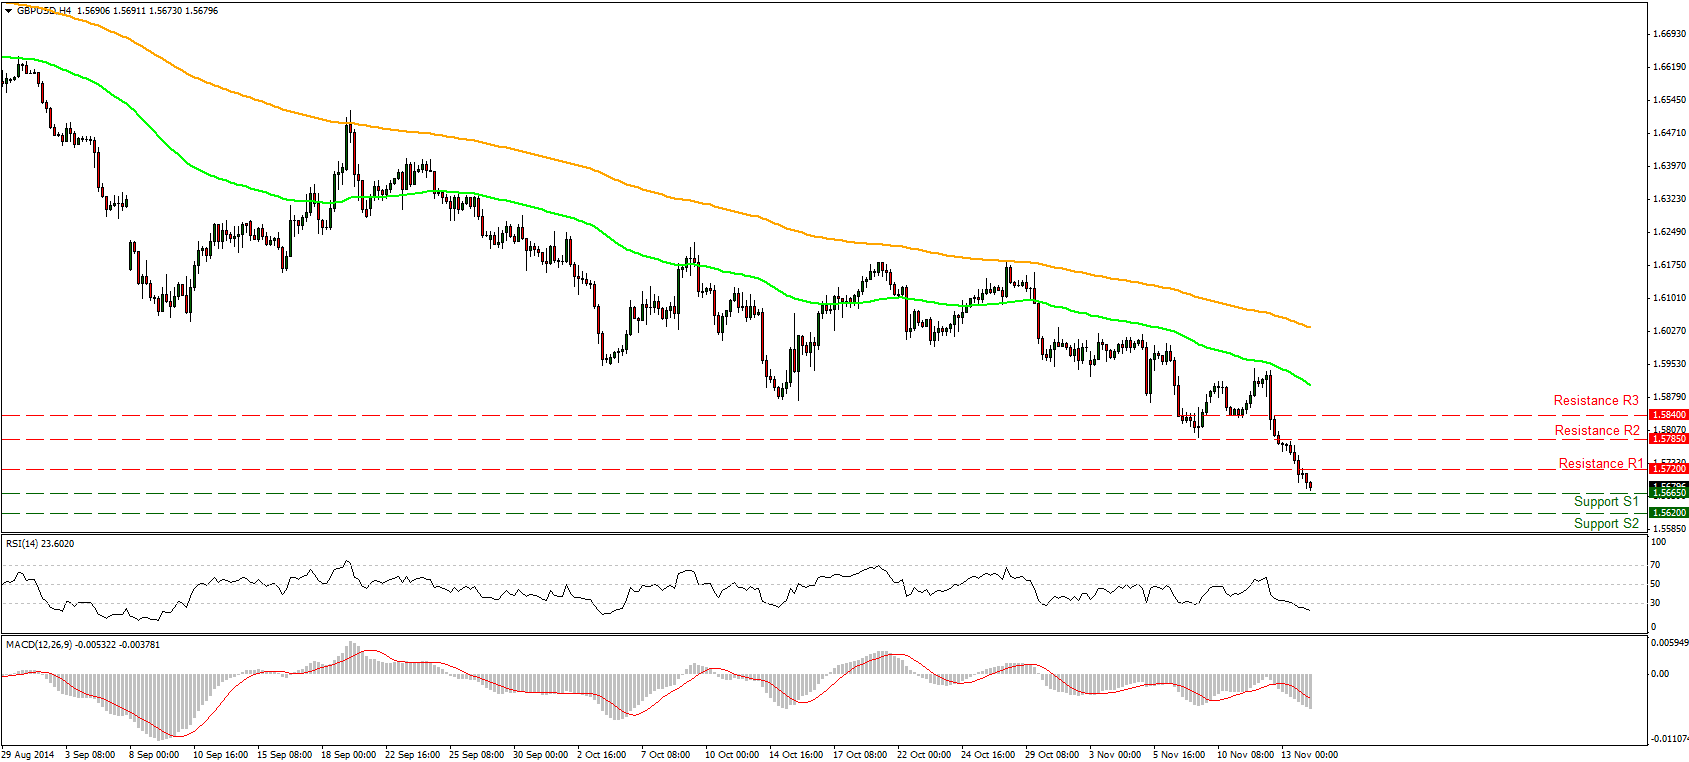
GBP/USD tumbled on Thursday, breaking below our support (turned into resistance) line of 1.5720 (R1). The dip below the 1.5785 (R2) signaled a forthcoming lower low on the daily chart and supported the case for further declines. During the early European hours the pair is heading towards our support of 1.5665 (S1), where a break will likely have larger bearish implication and would target 1.5620 (S2) support line. Our momentum signs support this notion: the RSI moved further into its oversold territory and is pointing down, while the MACD, already in its negative territory, shows no sign of bottoming. These oscillators suggest accelerating bearish momentum. In the bigger picture, I maintain my view that as long as the pair is trading below the 80-day exponential moving average, the overall path remains negative.
• Support: 1.5665 (S1), 1.5620 (S2), 1.5550 (S3) .
• Resistance: 1.5720 (R1), 1.5785 (R2), 1.5840 (R3).
USD/JPY in a consolidative mode
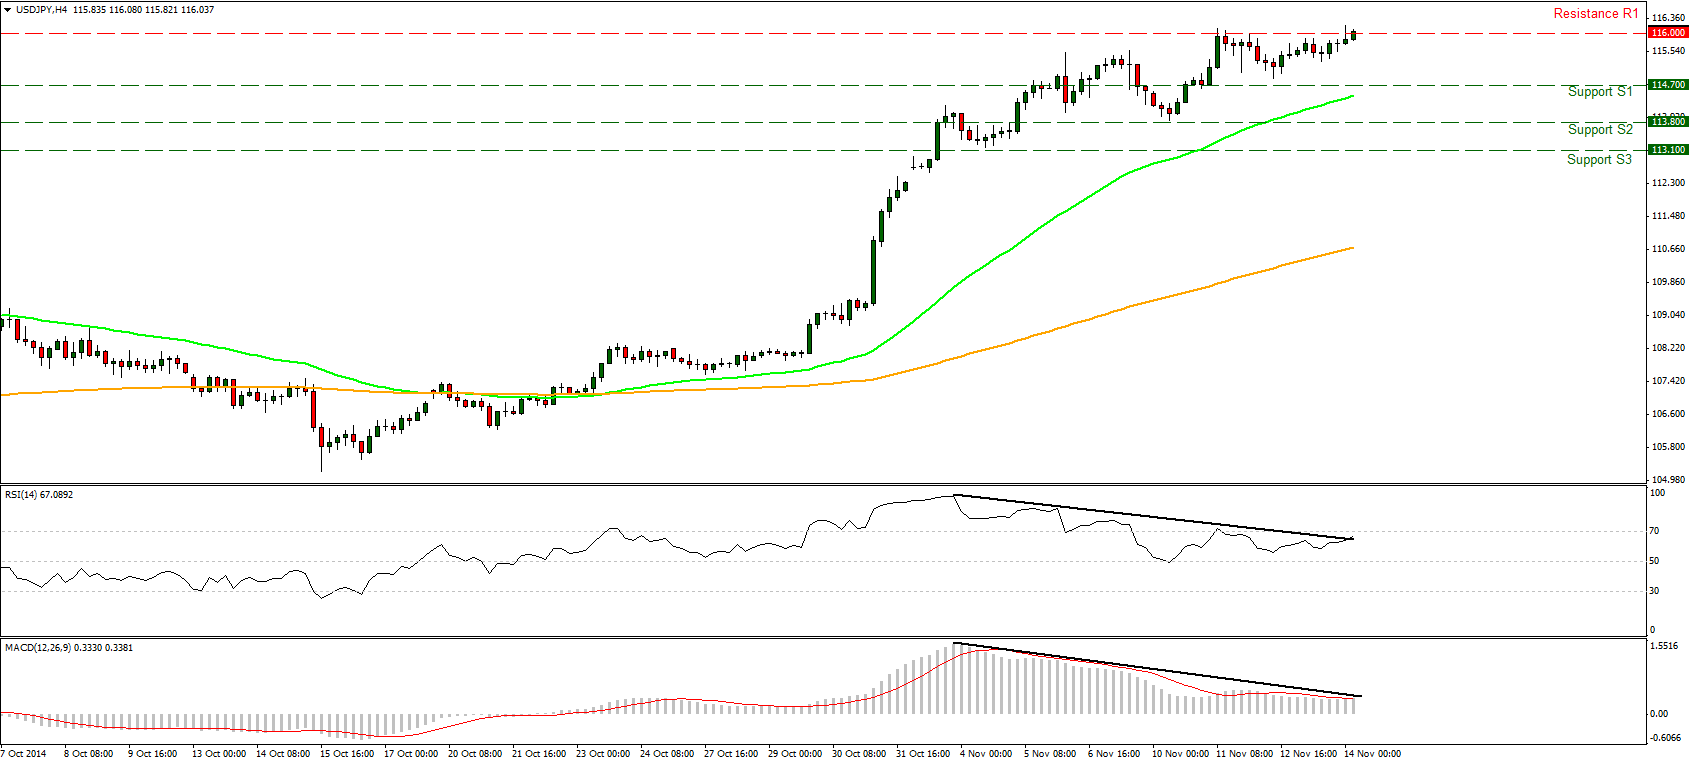
USD/JPY consolidated on Thursday, staying below the 116.00 (R1) resistance line. I still see negative divergence between both of our near-term momentum studies and the price action, thus I would stay mindful of a possible pullback in the short term. The pullback could occur at least towards the 114.70 (S1) support line, which stands slightly above the 23.6% retracement level of the 29th of October – 11th of November advance. As for the broader trend, I believe that the overall outlook remains positive and I would treat any possible pullback as a corrective move before buyers prevail again. Furthermore, the daily MACD is already above its zero and trigger line and shows no signs of topping, while the 14-day RSI remains in its overbought territory. These are bullish momentum signs that suggest the rally is likely to continue.
• Support: 114.70 (S1), 113.80 (S2) 113.10 (S3).
• Resistance: 116.00 (R1), 117.00 (R2), 118.00 (R3).
Gold steady near 1167

Gold resumed its attempts on Thursday to break our resistance line of 1167 (R1), but once again the bulls were not strong enough to push the price above that obstacle. During the early European hours, the precious metal is heading for another test of that barrier. As long as this resistance persists, I would prefer to stay on the sidelines at least for the near-term. On the daily chart, the price structure still suggests a downtrend but I will retain my view that a break below the 1137 (S1) zone is needed to get more confident for further extensions.
• Support: 1137 (S1), 1125 (S2), 1100 (S3) .
• Resistance: 1167 (R1), 1180 (R2), 1205 (R3).
WTI plunged on Thursday
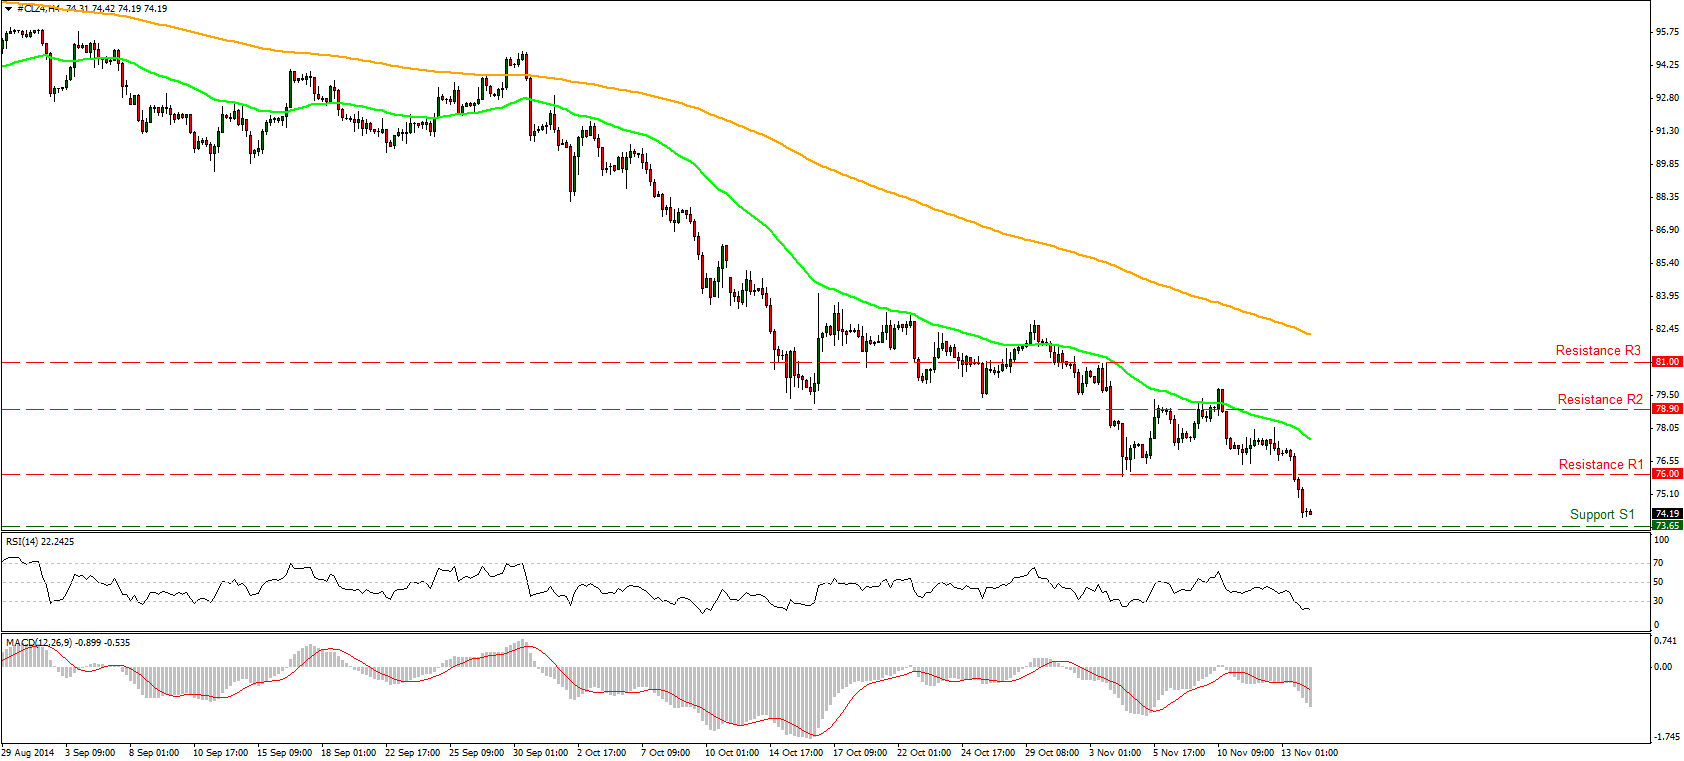
WTI plunged on Thursday, breaking two support lines in a row. The move was halted just above the 73.65 (S1) support line. A clear and decisive break of that line could trigger further extensions towards the 71.50 (S2) support level, which is defined by the low of 31st of August 2010. Looking at our momentum studies, the RSI entered its oversold field and is pointing somewhat down, while the MACD, already below its zero level, crossed its signal line and moved down. These are bearish momentum signs that suggest further declines are likely to occur. On the daily chart, the price structure remains lower highs and lower lows below both the 50- and the 200- day moving averages, keeping the overall trend to the downside.
• Support: 73.65 (S1), 71.50 (S2), 70.00 (S3) .
• Resistance: 76.00 (R1), 78.90 (R2), 81.00 (R3).
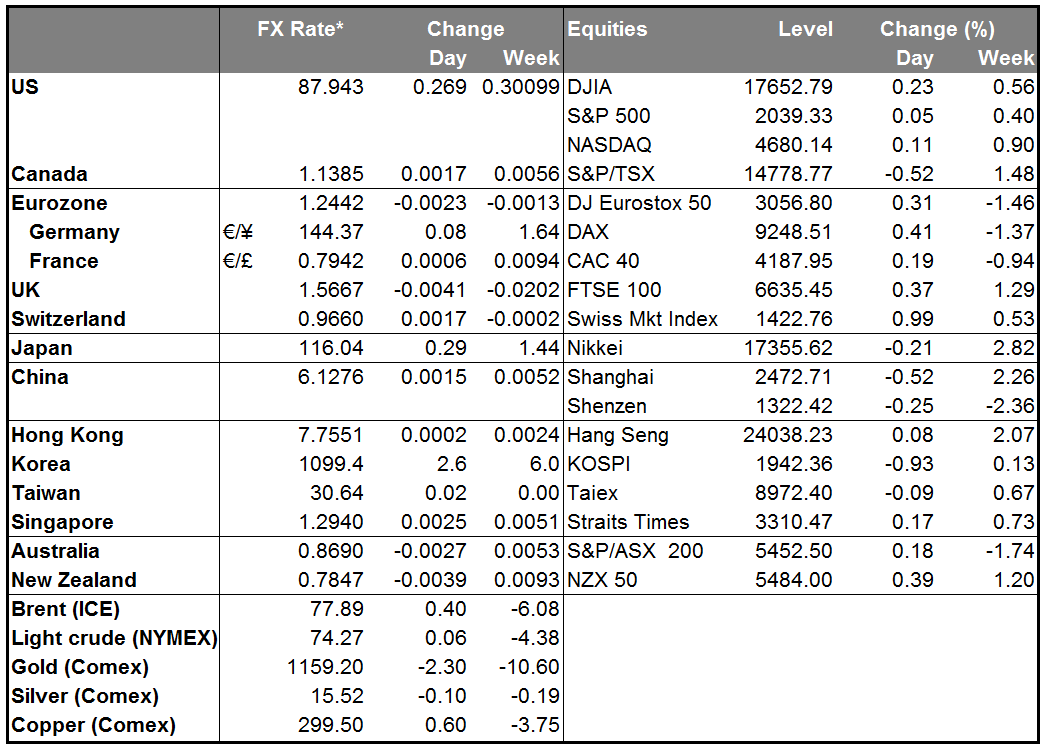
BENCHMARK CURRENCY RATES - DAILY GAINERS AND LOSERS
MARKETS SUMMARY