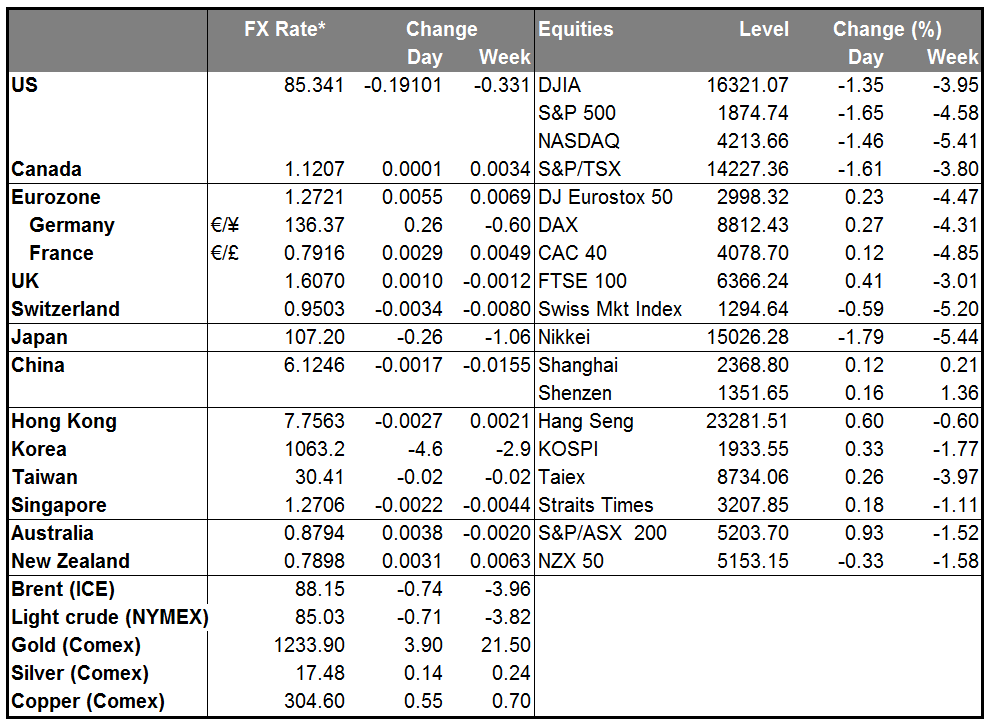
EUR/USD reaches the 1.2760/90 zone
EUR/USD moved higher on Monday, reaching the 1.2760/90 zone as expected. Although our daily momentum studies point towards further upside, I would take to the sidelines for now since the 1.2760/90 zone acted as a major support back in 2013 and it now acts as a major resistance, preventing the bulls from driving the battle higher. A dip below 1.2600 (S1) is likely to signal that the 3rd – 14th October corrective move is completed in that zone and could target once again the 1.2500 (S2) psychological level, which happens to be the 76.4% retracement level of the July 2012-May 2014 major advance. As long as the price structure remains lower peaks and lower troughs below both the 50- and the 200-day moving averages, I will maintain the view that the overall path remains to the downside. Hence, I will treat the recent up move or any extensions of it as a corrective phase for now.
• Support: 1.2600 (S1), 1.2500 (S2), 1.2465 (S3)
• Resistance: 1.2790 (R1), 1.2900 (R2), 1.3000 (R3)
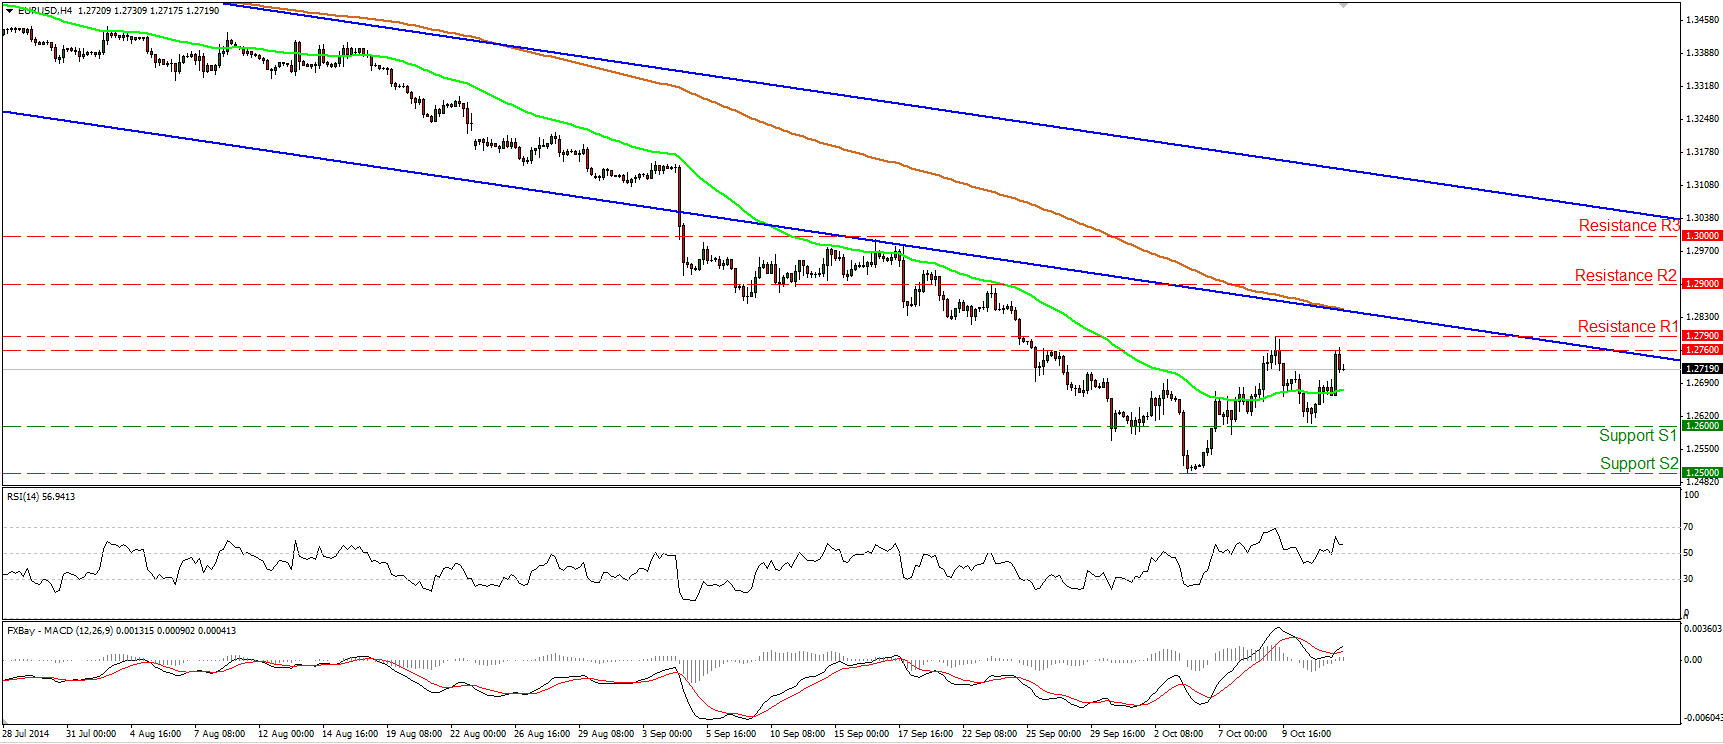
GBP/JPY finds support at 171.70
GBP/JPY continued tumbling yesterday, but the decline was halted at 171.70 (S1) and the rate rebounded somewhat. The pair is forming lower highs and lower lows below both the 50- and the 200-period moving averages, thus the short-term path remains to the downside in my view. Today, we get the UK CPI for September which is expected to have slowed. Something like that could cause the bears to break the support line of 171.70 (S1). If they manage to do so, I would expect them to set the stage for extensions towards our next support line at 170.65 (S2).
• Support: 171.70 (S1), 170.65 (S2), 169.30 (S3)
• Resistance: 173.00 (R1), 173.50 (R2), 175.00 (R3)
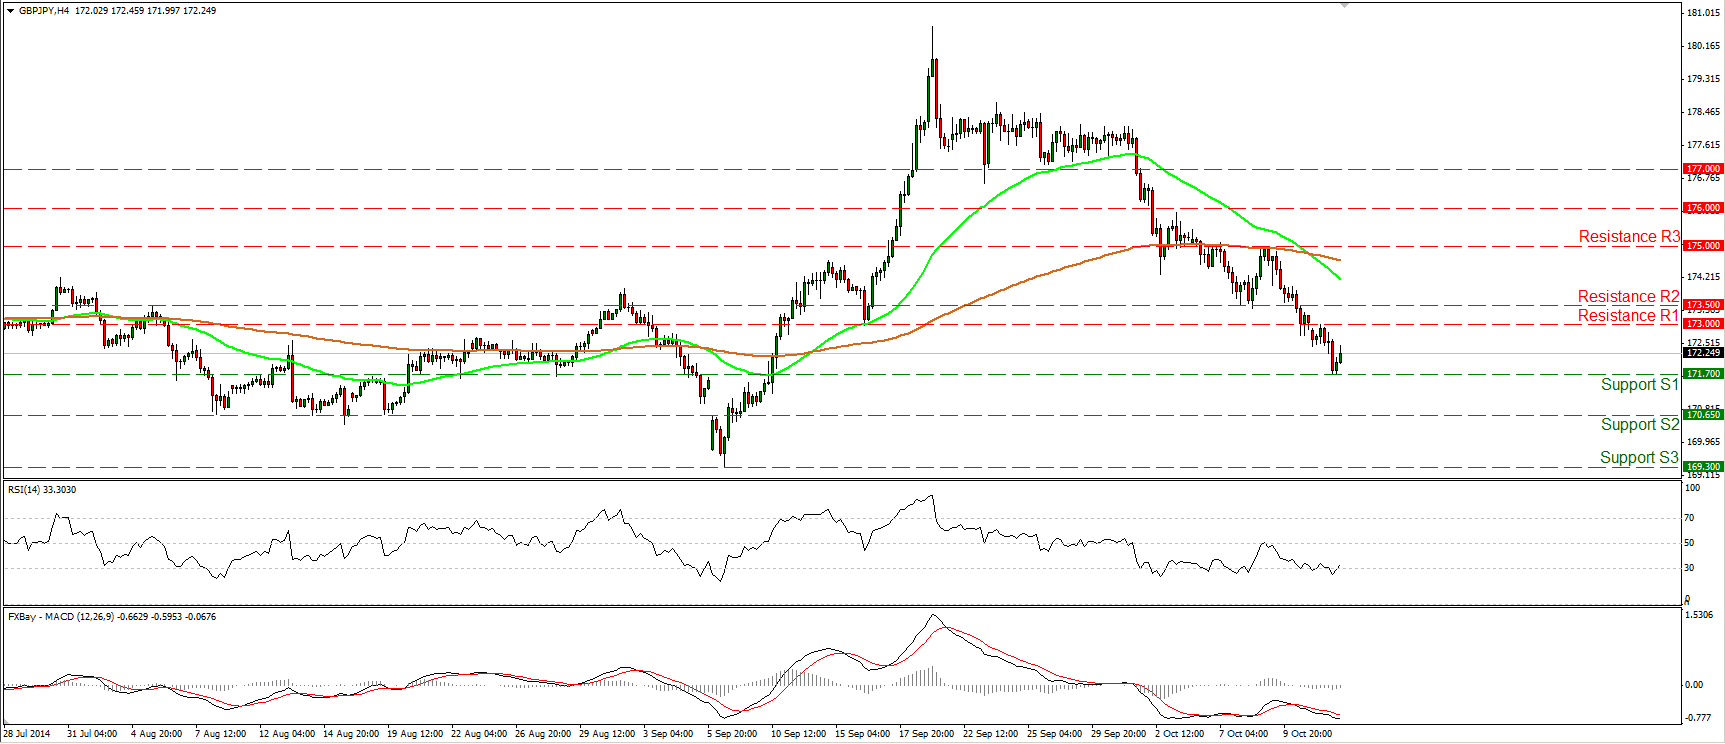
AUD/USD within a range
AUD/USD moved higher after finding support marginally above our obstacle of 0.8640 (S2). As far as the near-term picture is concerned, I see a sideways range between that support line and the resistance of 0.8900 (R1). As a result, I would expect another test near the 0.8900 (R1) area in the close future. As for the broader trend, I still see a downtrend. However, looking at our daily oscillators, I see that the 14-day RSI moved higher after exiting its oversold field and is now approaching its 50 line, while the daily MACD lies above its trigger and is pointing up. As a result I would wait for the bears to give more actionable signs that the downtrend is back in force before getting confident on the downside again.
• Support: 0.8740 (S1), 0.8640 (S2), 0.8565 (S3)
• Resistance: 0.8900 (R1), 0.9000 (R2), 0.9100 (R3)
Gold challenges the 1235/45 zone

Gold moved somewhat higher on Monday and during the early European morning is challenging the resistance zone of 1235/1240 and the 200-period moving average. A clear and decisive move above that resistance area could probably pull the trigger for another leg higher, perhaps towards our next resistance hurdle at 1260 (R3). The notion is also supported by both our daily momentum indicators. The 14-day RSI remains above its 50 line, while the daily MACD, although negative, stays above its trigger and is pointing up. As far as the broader trend is concerned, I would maintain my “wait and see” stance for the same reasons I mentioned last week. On the 6th of October, the yellow metal rebounded strongly from the critical support zone of 1180/83, defined by the lows of June and December 2013, but the absence of any bullish trend reversal signals makes it premature to argue about any uptrend scenarios, in my view.
• Support: 1217 (S1), 1205 (S2), 1183 (S3)
• Resistance: 1235 (R1), 1240 (R2), 1260 (R3)
WTI in a consolidative mode
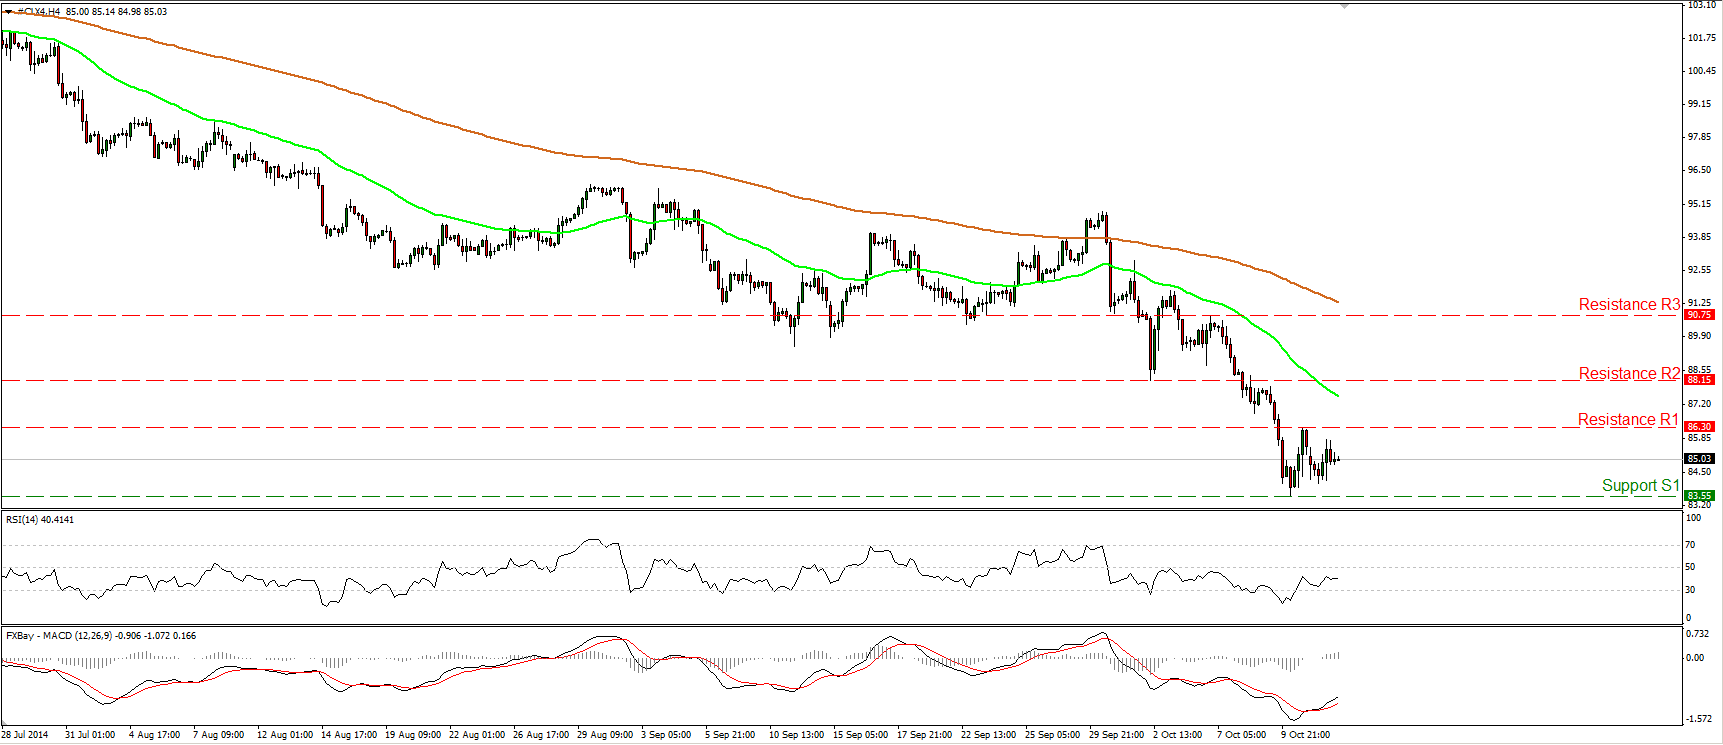
WTI moved in a consolidative mode yesterday, remaining between the support line of 83.55 (S1) and the resistance barrier of 86.30 (R1). On the daily chart, the price structure still suggests a downtrend, thus I would wait for a dip below the support line of 83.55 (S1) to open the way towards the low of the 2nd of July, near the 82.00 (S2) zone. The daily MACD remains below both its zero and signal lines, confirming the recent negative momentum of WTI, but the 14-day RSI found support near its 30 line, a line that is well respected by the RSI during the current price downtrend. As a result, I would be cautious of an upside bounce before the bears take the reins again.
• Support: 83.55 (S1), 82.00 (S2), 80.00 (S3)
• Resistance: 86.30 (R1), 88.15 (R2), 90.75 (R3)
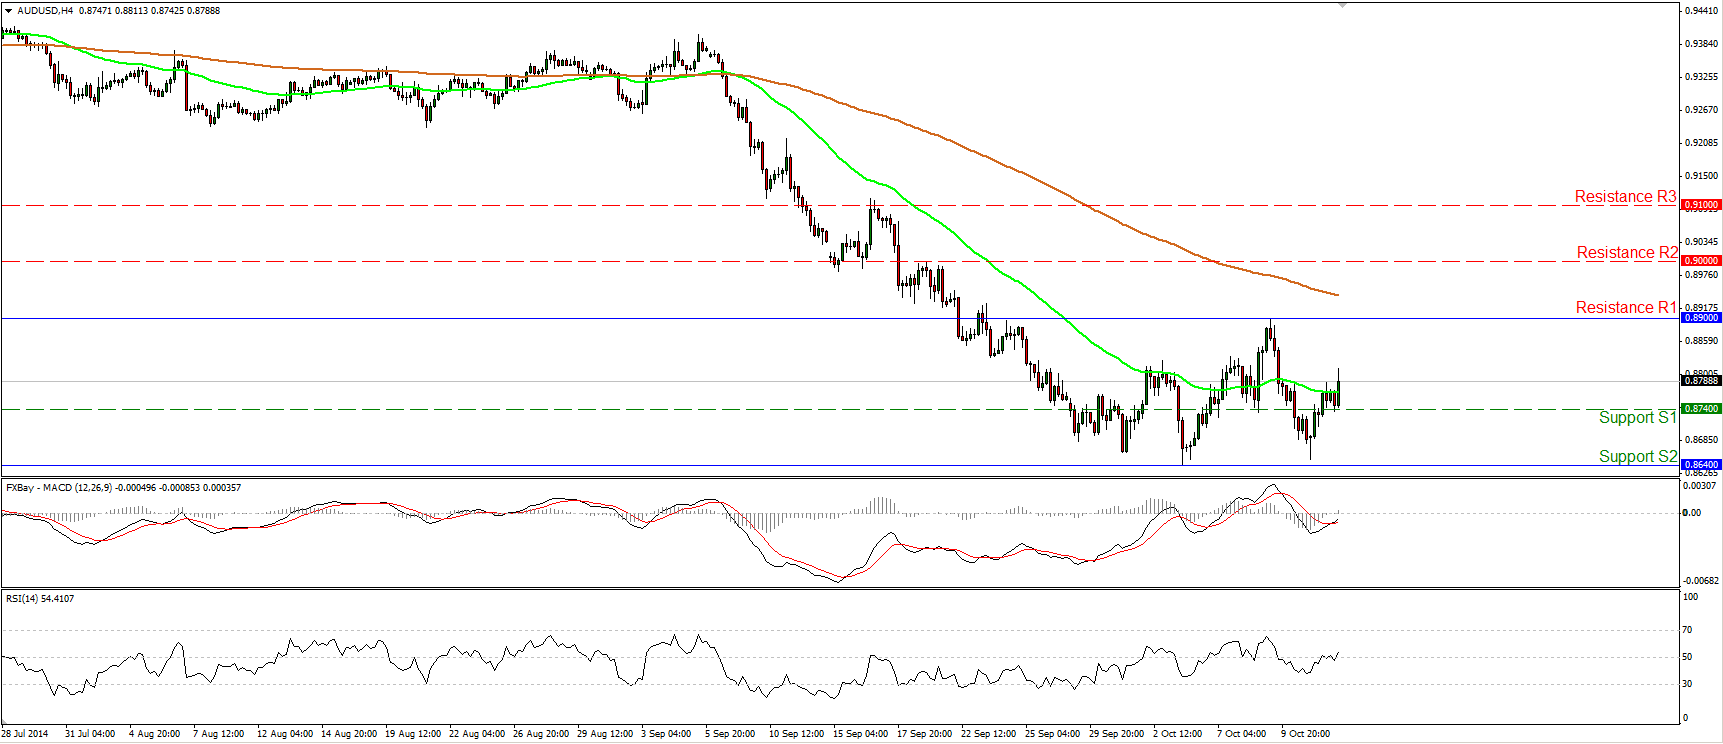
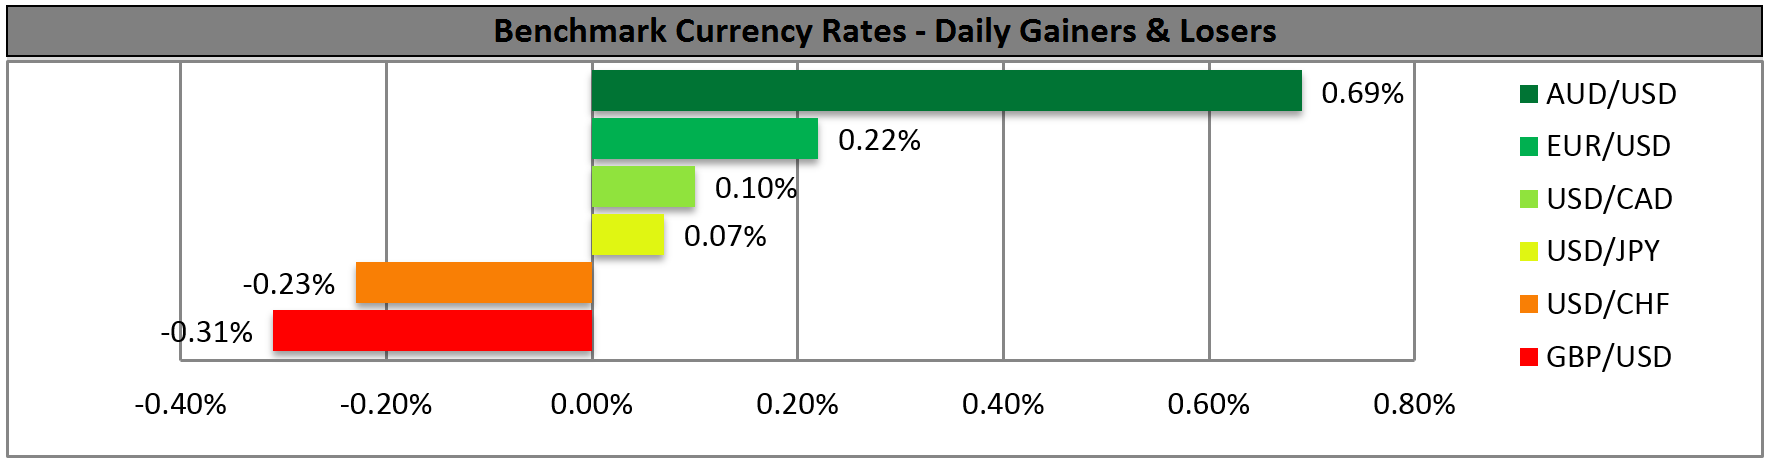
BENCHMARK CURRENCY RATES - DAILY GAINERS AND LOSERS
MARKETS SUMMARY