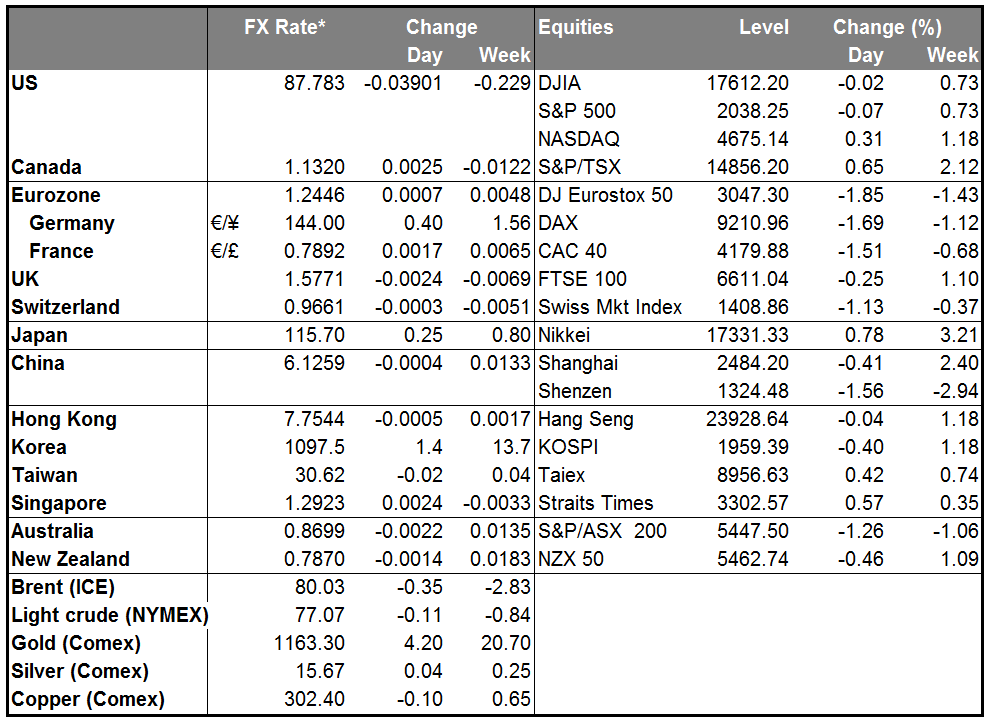
EUR/USD in a symmetrical triangle
EUR/USD remains capped below our black downtrend line and the 50-period moving average. There were a couple of attempts to break the near-term trend line, but none of them found much support and the pair has now formed a symmetrical triangle reflecting investors’ indecisiveness. The Eurozone’s preliminary Q3 GDP figures to be released on Friday could trigger the breakout and set the direction of the pair. Usually the symmetrical triangles are thought of as a continuation pattern. Given the negative outlook of EUR/USD in the bigger picture, this put more chances of a downward breakout, in my view.
• Support: 1.2360 (S1), 1.2300 (S2), 1.2250 (S3).
• Resistance: 1.2535 (R1), 1.2620 (R2), 1.2745 (R3) .
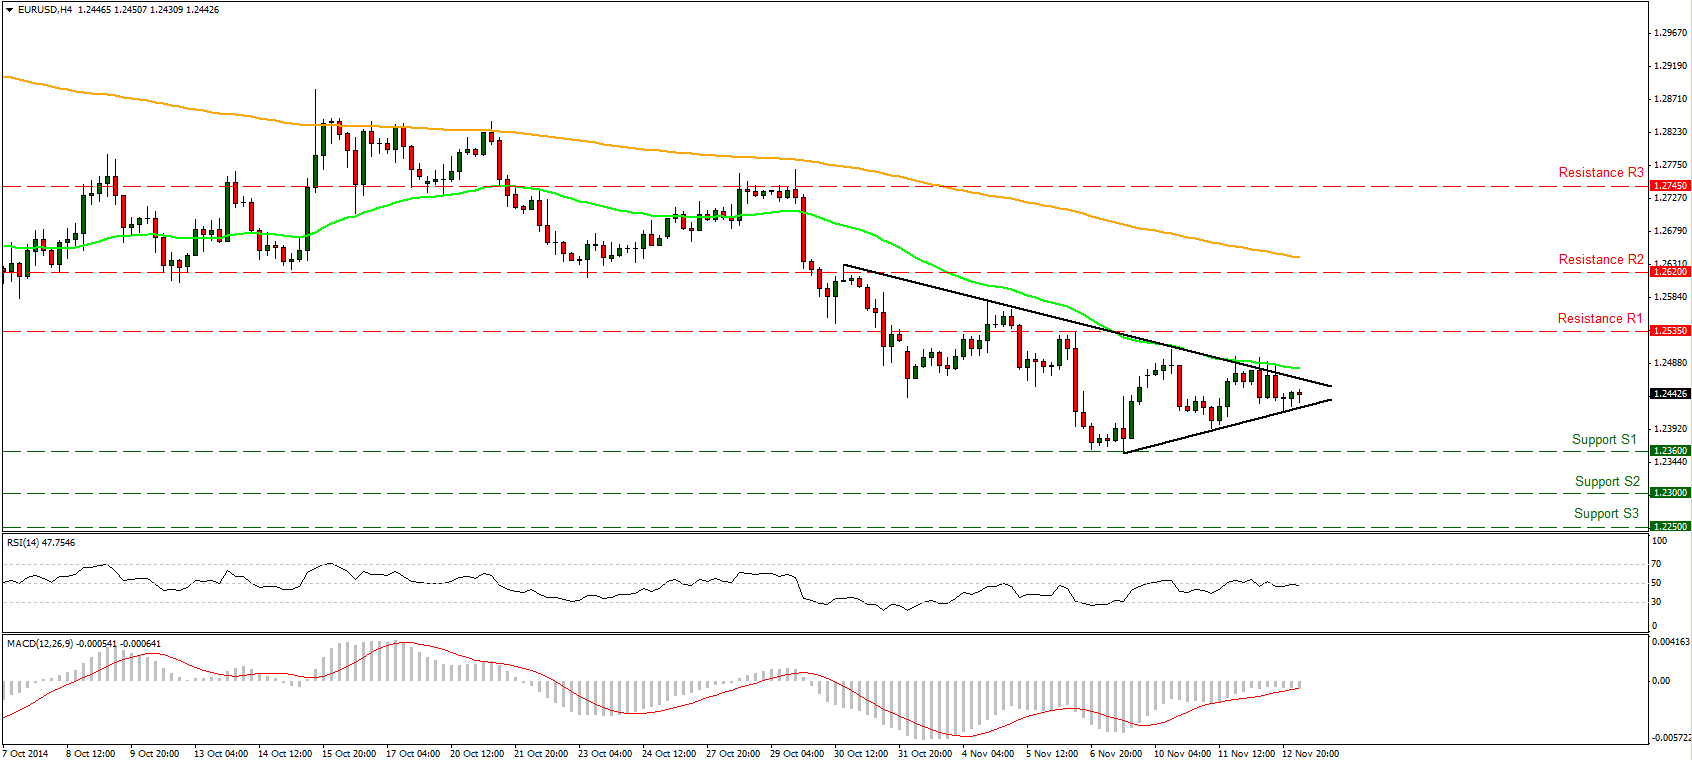
GBP/USD plunged after the inflation report
GBP/USD plunged following the inflation report, breaking our support-turned-into-resistance 1.5785 (R1) line. A dip below that hurdle signaled a forthcoming lower low on the daily chart and could trigger extensions towards the next support barrier of 1.5720 (S1), defined by the high of the 21st of August 2013. Our momentum signs support this notion: the RSI moved towards its 30 line and is pointing down, while the MACD, already in its negative territory, crossed below its trigger line. In the bigger picture, I maintain my view that as long as the pair is trading below the 80-day exponential moving average, the overall path remains negative.
• Support: 1.5720 (S1), 1.5665 (S2), 1.5620 (S3) .
• Resistance: 1.5785 (R1), 1.5840 (R2), 1.5950 (R3).
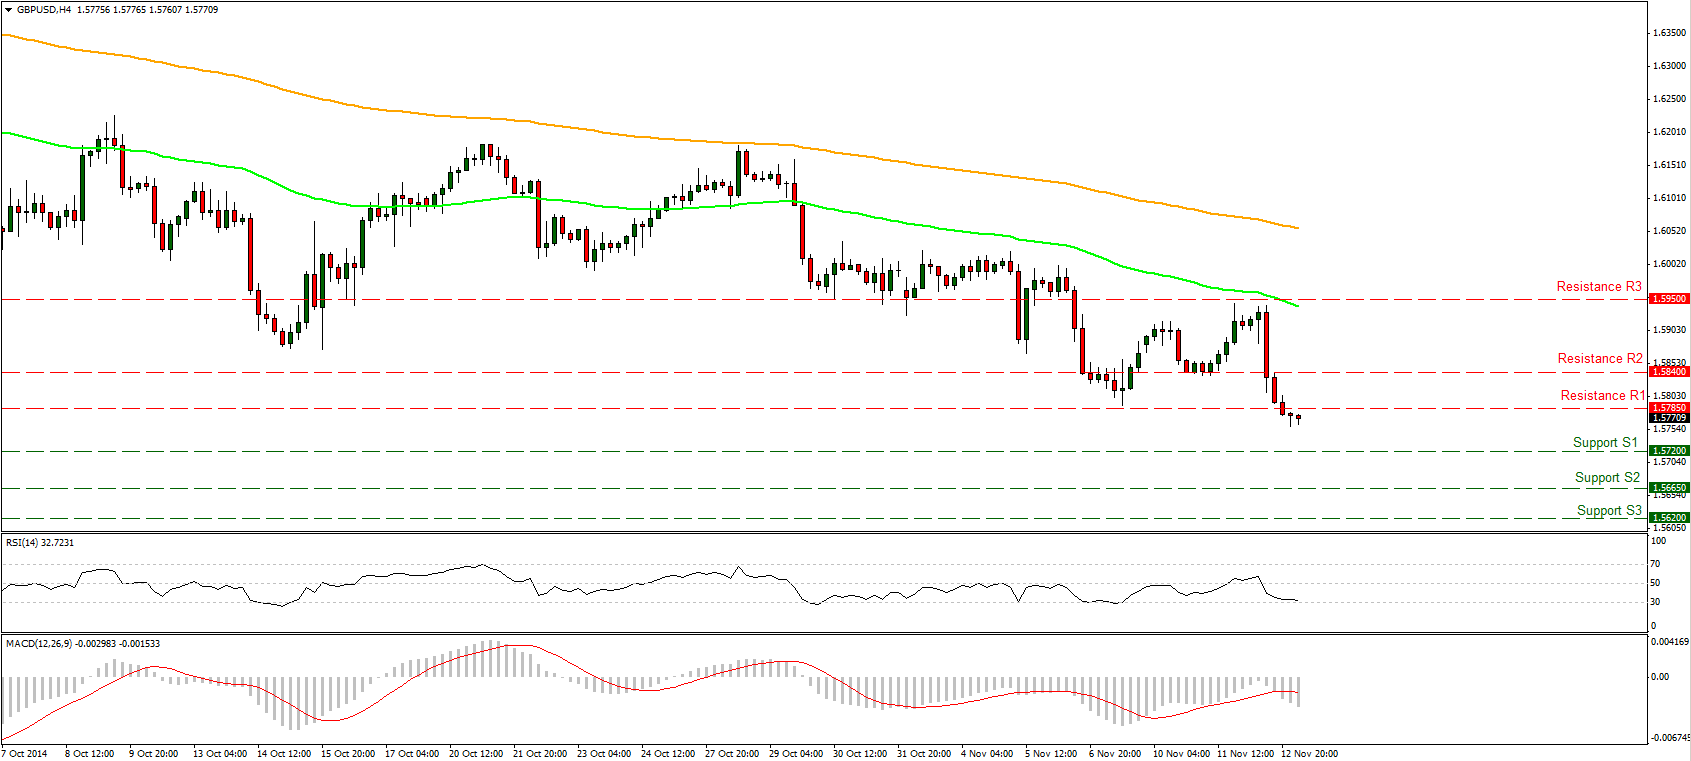
USD/JPY in a consolidative mode
USD/JPY moved sideways on Wednesday, staying below the 116.00 (R1) resistance line. I still see negative divergence between both of our near-term momentum studies and the price action, thus I would stay mindful of a possible pullback in the immediate future, before the bulls prevail again. The pullback could occur at least towards the 114.70 (S1) support line, which stands slightly above the 23.6% retracement level of the 29th of October – 11th of November advance. As for the broader trend, I believe that the overall outlook remains positive and I would treat any possible pullback as a corrective move before buyers prevail again. Furthermore, the daily MACD is already above its zero and trigger line and shows no signs of topping, while the 14-day RSI remains in its overbought territory. These are bullish momentum signs that suggest the rally is likely to continue.
• Support: 114.70 (S1), 113.80 (S2) 113.10 (S3).
• Resistance: 116.00 (R1), 117.00 (R2), 118.00 (R3).
Gold remains elevated near 1167
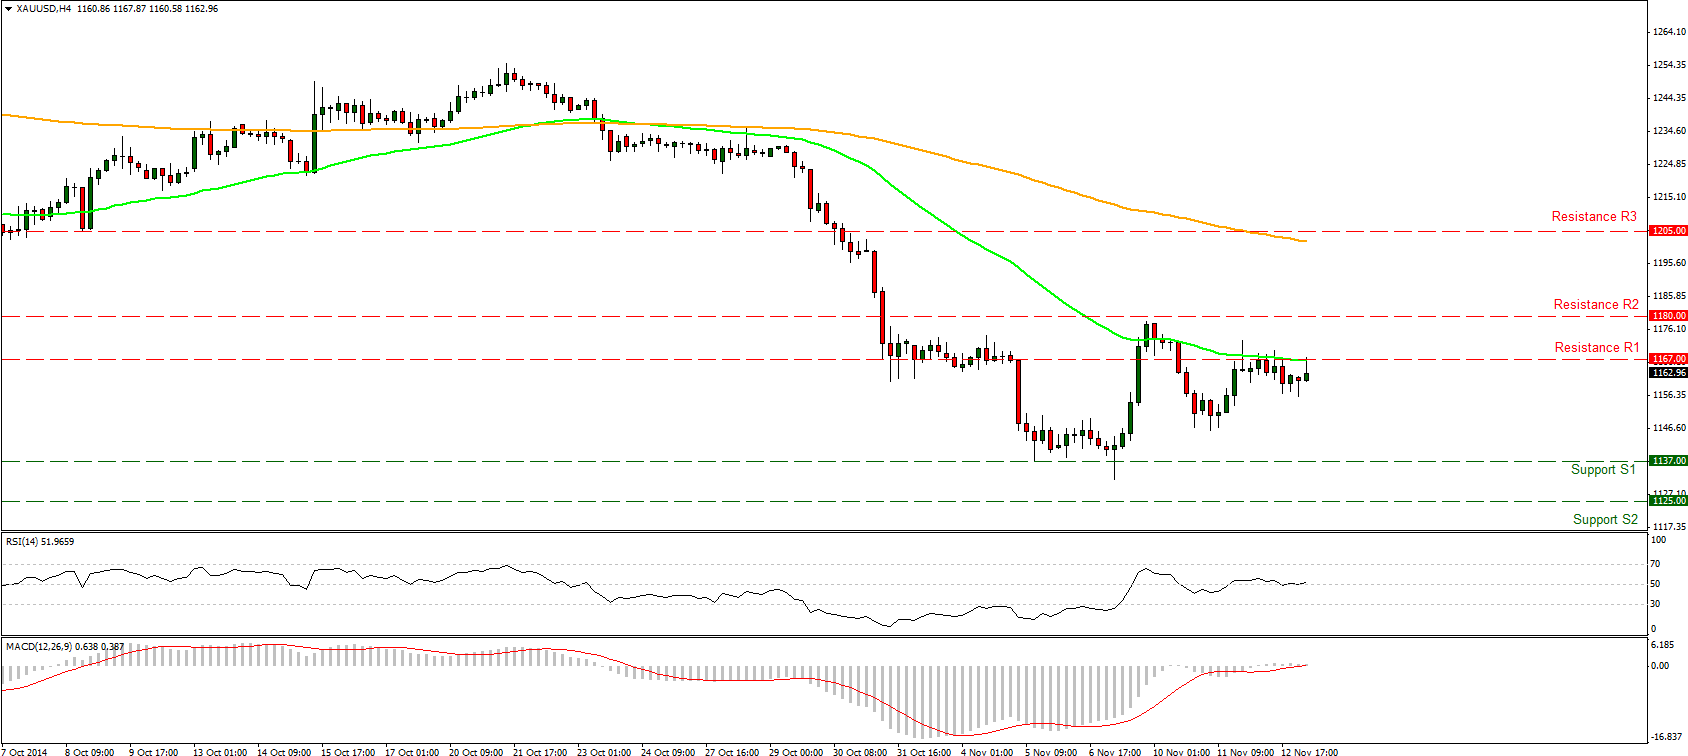
Gold made another attempt on Wednesday to breach our resistance line of 1167 (R1), but once again it proved unsuccessful. During the early European hours, the precious metal is heading for another test of that barrier. As long as this resistance persists, I would prefer to stay on the sidelines at least for the near-term. The RSI is marginally above its 50 line and is pointing up, while the MACD poked its nose above its zero and signal line keeping alive the scenario for another test of the 1167 (R1) hurdle. On the daily chart, the price structure still suggests a downtrend but I will retain my view that a break below the 1137 (S1) zone is needed to get more confident for further extensions.
• Support: 1137 (S1), 1125 (S2), 1100 (S3) .
• Resistance: 1167 (R1), 1180 (R2), 1205 (R3).
WTI still moves sideways

WTI traded sideways between the 76.00 (S1) support area and the resistance of 79.80 (R1). Since the oil price seems to be oscillating between these two lines, I would prefer remain neutral. A clear and decisive break of 76.00 (S1) is necessary for further declines, perhaps towards the psychological zone of 75.00 (S2), defined by the lows of October 2010. On the other hand, a break above 79.80 (R1) could trigger further extensions towards 81.00 (R2). On the daily chart, the price structure remains lower highs and lower lows below both the 50- and the 200- day moving averages, keeping the overall trend to the downside.
• Support: 76.00 (S1), 75.00 (S2), 73.65 (S3) .
• Resistance: 79.80 (R1), 81.00 (R2), 83.50 (R3).
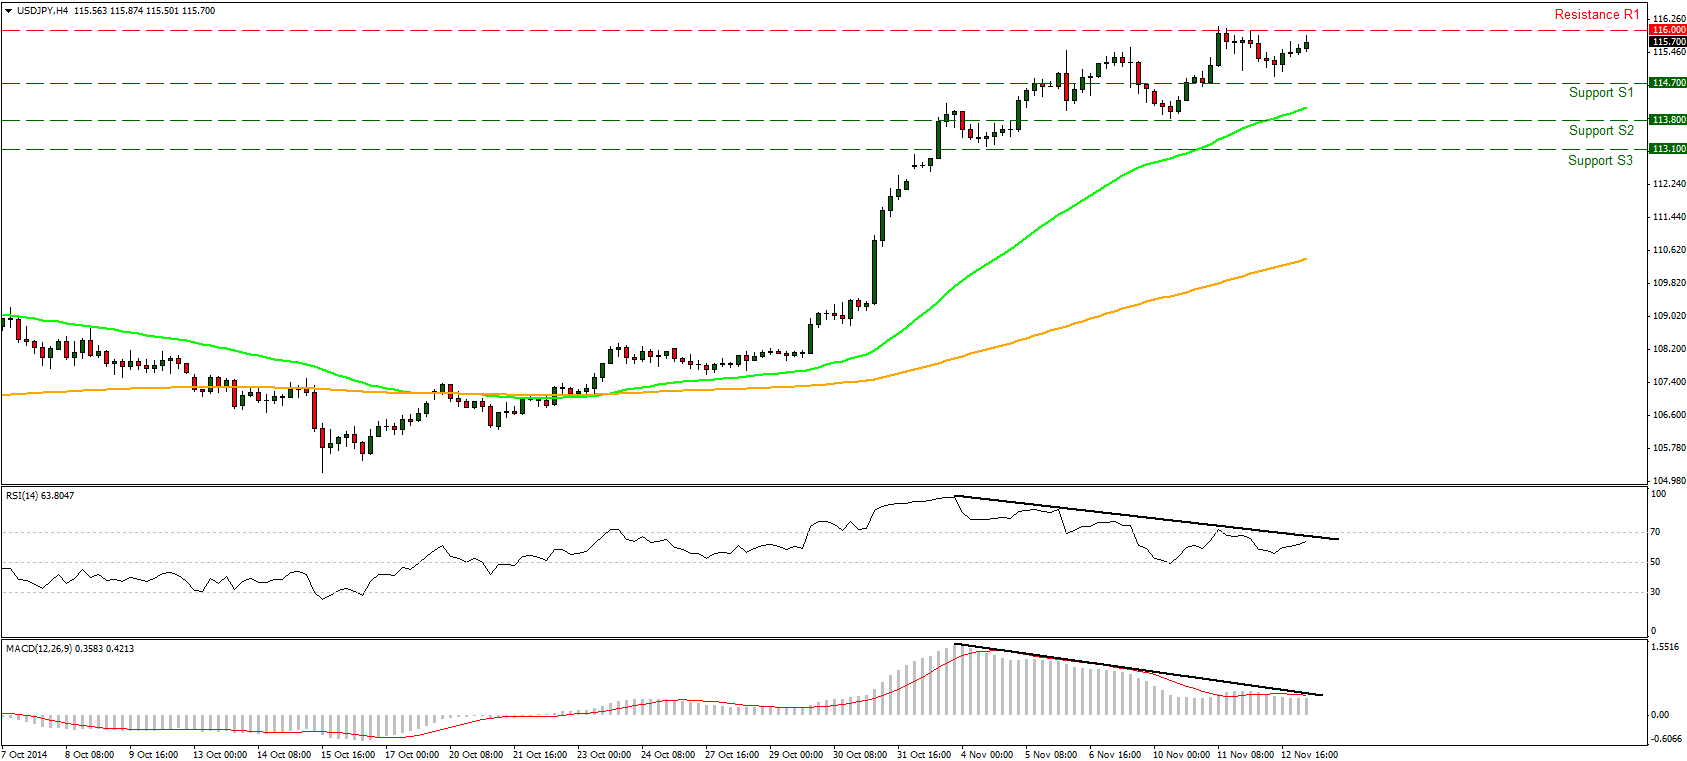
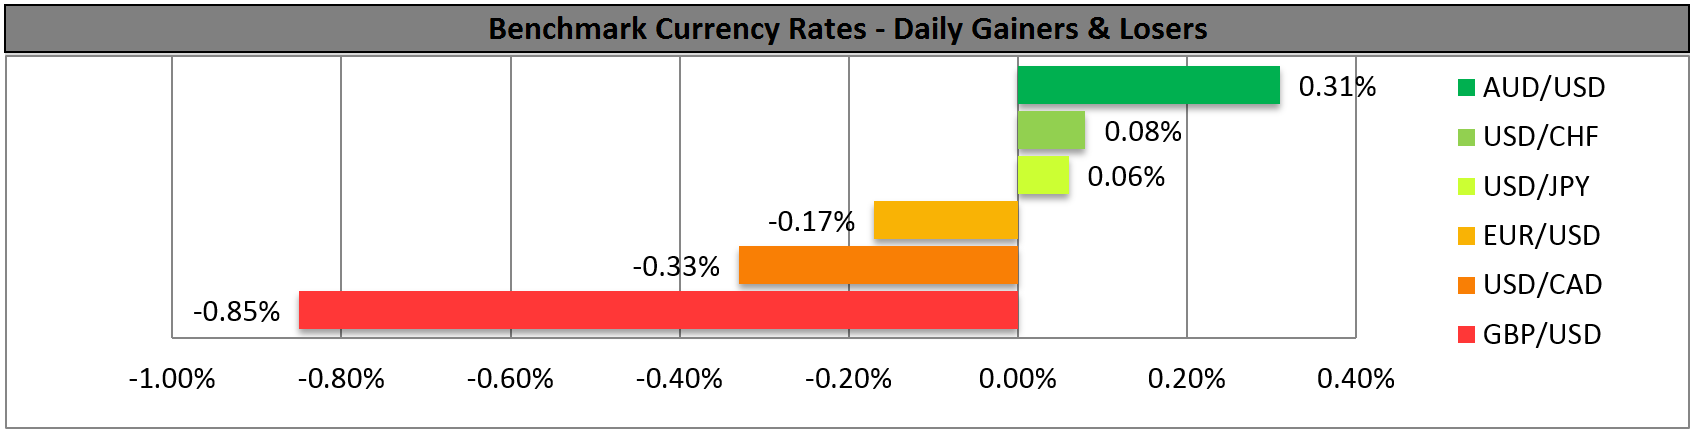
BENCHMARK CURRENCY RATES - DAILY GAINERS AND LOSERS
MARKETS SUMMARY