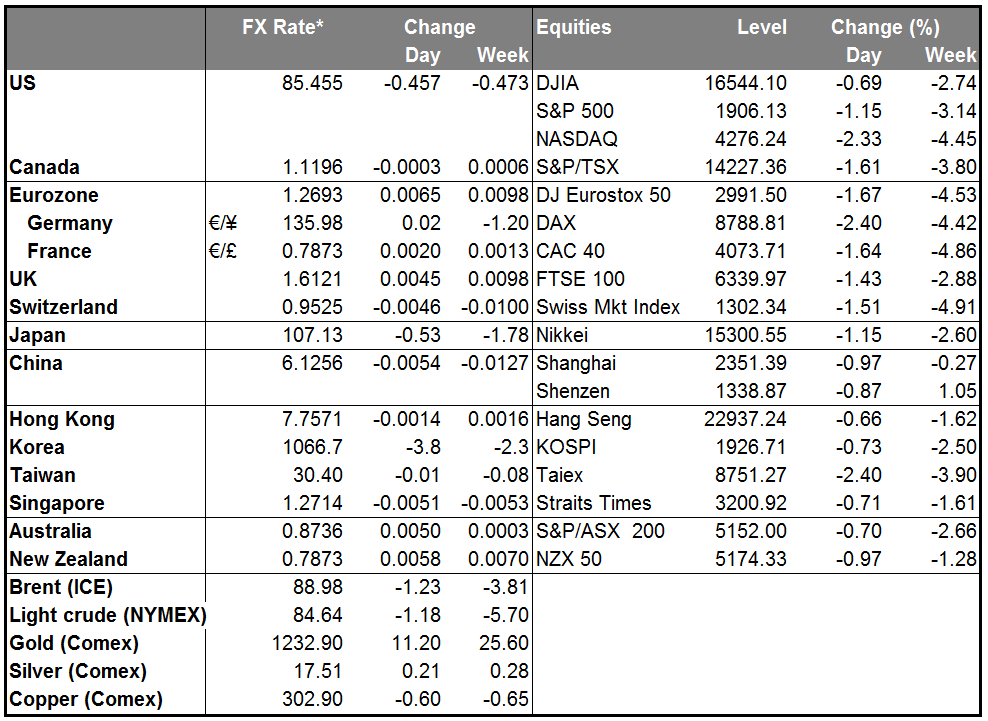
UR/USD rebounds from near 1.2600
EUR/USD rebounded from near the 1.2600 (S1) line during the Asian morning, printing a higher low. I would now expect the pair to challenge once again the resistance zone of 1.2760/90. The near-term momentum studies also favor an upward bounce. The RSI crossed back above its 50 line and is pointing up, while the MACD found support at its zero line and appears willing to move above its trigger in the close future. Only a dip below 1.2600 (S1) is likely to confirm that the 3rd – 9th October corrective wave is completed at 1.2790 (R1). Such a move could target once again the psychological zone of 1.2500 (S2), which coincides with the 76.4% retracement level of the July 2012- May 2014 major advance. On the daily chart, as long as the price structure remains lower peaks and lower troughs below both the 50- and the 200-day moving averages, I will maintain the view that the overall path remains to the downside. Hence, I will treat last week’s up move or any extensions of it as a corrective phase for now.
• Support: 1.2600 (S1), 1.2500 (S2), 1.2465 (S3)
• Resistance: 1.2790 (R1), 1.2900 (R2), 1.3000 (R3)
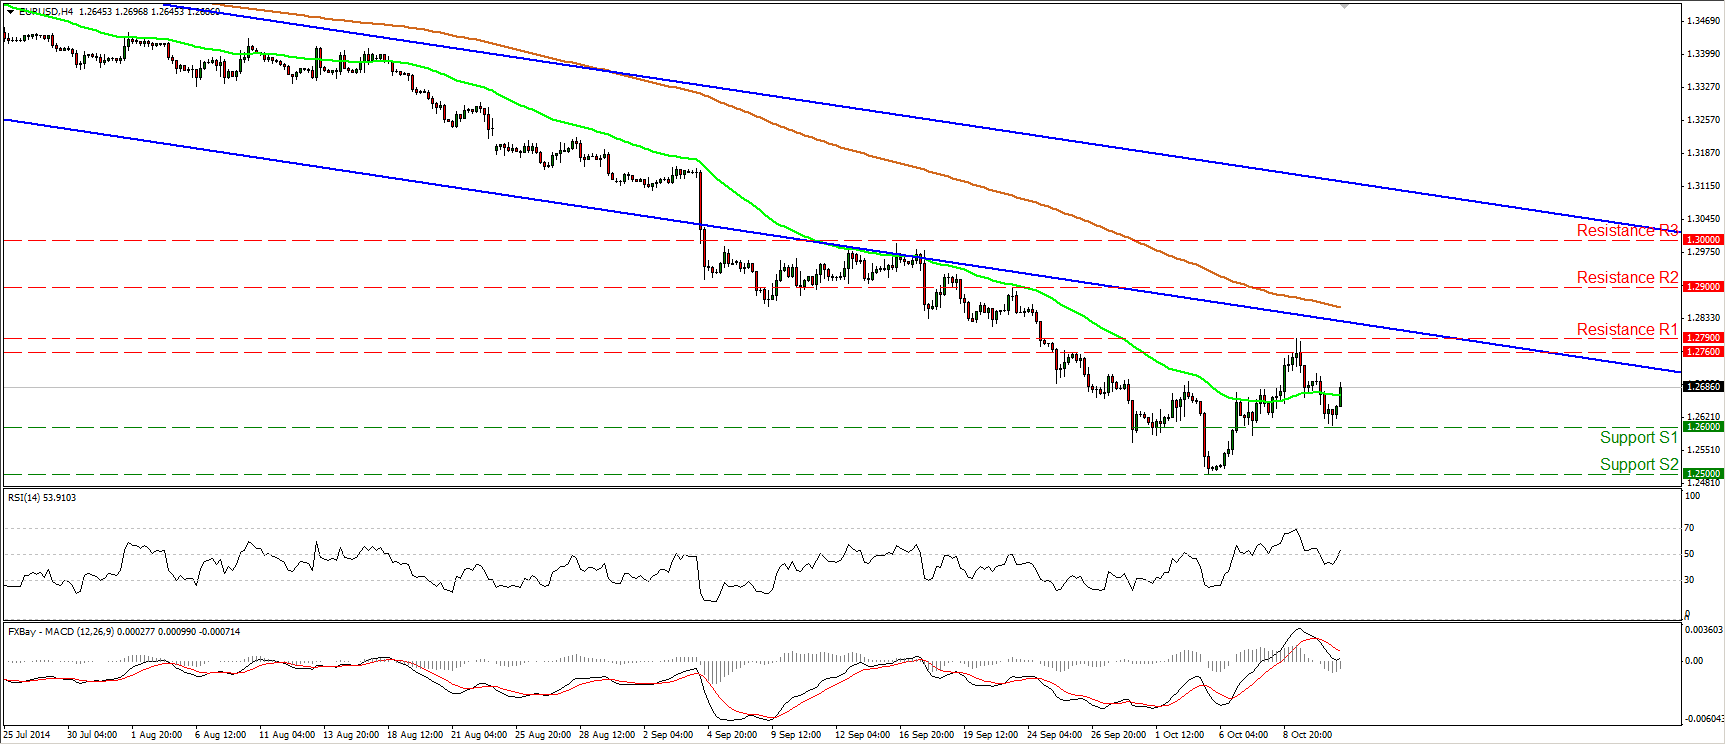
GBP/USD finds support fractionally above 1.6000
GBP/USD found some buy orders a few pips above the psychological line of 1.6000 (S1) and rebounded strongly to trade near the 50-period moving average. Taking a look at our near-term oscillators, I see that the RSI moved above its 50 line and is pointing up, while the MACD appears willing to obtain a positive sign again. These momentum signs amplify the case for the continuation of the up wave, perhaps for another test near the resistance hurdle of 1.6230 (R1), the high of last Thursday. As far as the longer-term trend is concerned, I will repeat for the umpteenth time that as long as Cable remains below the 80-day exponential moving average, I see a negative overall picture. Nevertheless, I also see positive divergence between the daily momentum indicators and the price action, something that indicates decelerating bearish momentum. I would wait for more actionable negative signs before getting again confident about the overall downtrend.
• Support: 1.6000 (S1), 1.5950 (S2), 1.5860 (S3)
• Resistance: 1.6230 (R1), 1.6400 (R2), 1.6500 (R3)
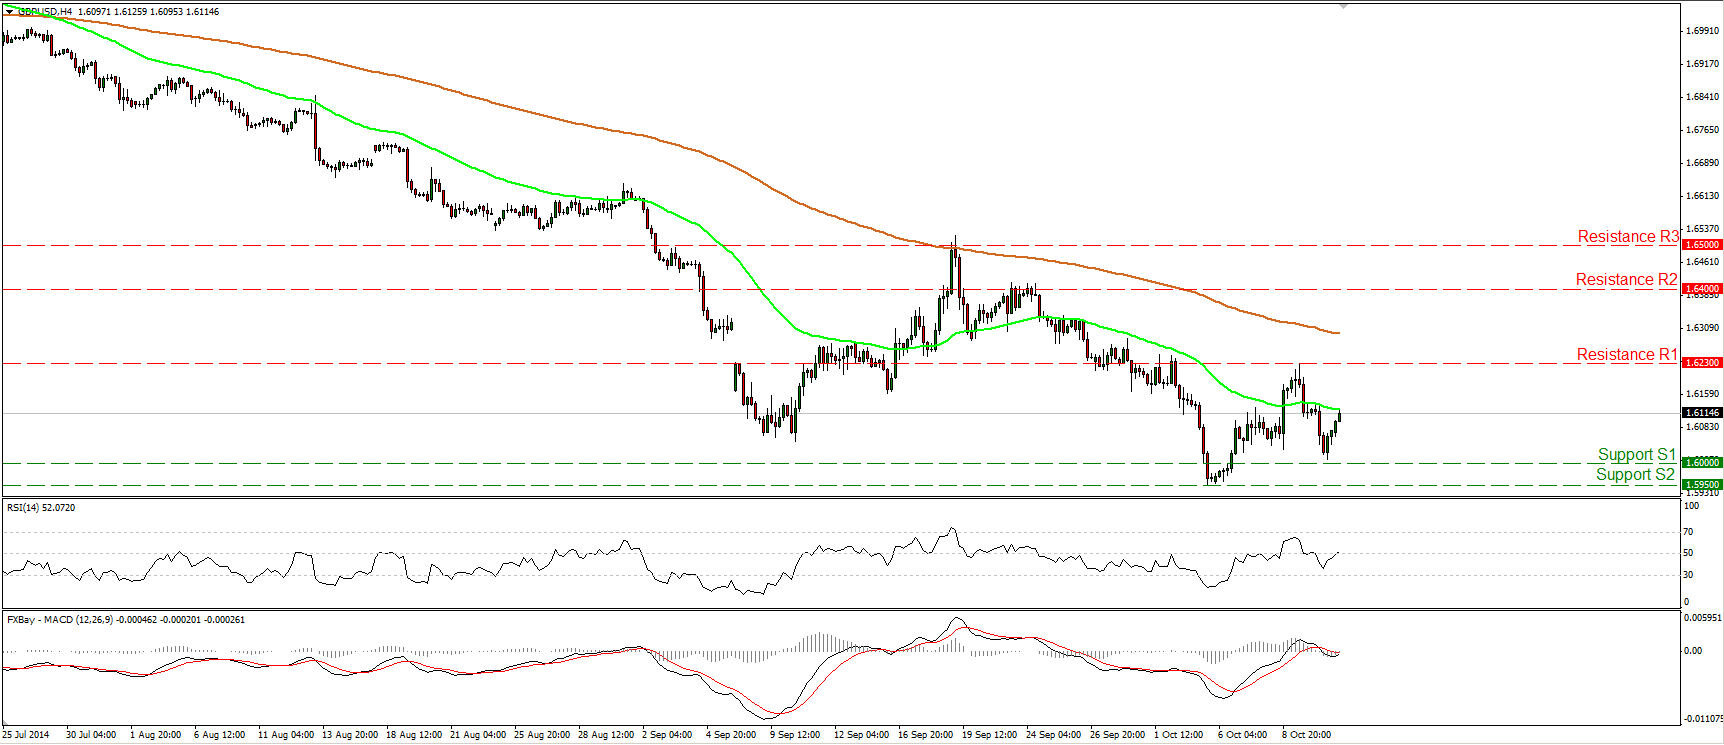
USD/JPY continues its tumble
USD/JPY moved lower after testing the 108.00 line as a resistance. This confirms my view that we have the completion of a double top formation and enhances the chances for further declines in the near future. I still expect the bears to challenge the low of the 16th of September at 106.80 (S1), which happens to be the 161.8% extension level of the double top’s width. That level also coincides with the 38.2% retracement of the 8th August – 1st October up move. Another dip below here could set the stage for extensions towards the 106.00 (S2) line, which is the 200% extension of the pattern’s width. On the weekly chart, last week’s candle closed negative, confirming the hanging man stick mentioned in my previous comments. This, together with the fact that the 14-week RSI moved lower after dipping below its 70 line, increases the possibilities for the beginning of a downside corrective phase.
• Support: 106.80 (S1), 106.00 (S2), 104.75 (S3)
• Resistance: 107.50 (R1), 108.00 (R2), 109.25 (R3)
Gold prints a higher low
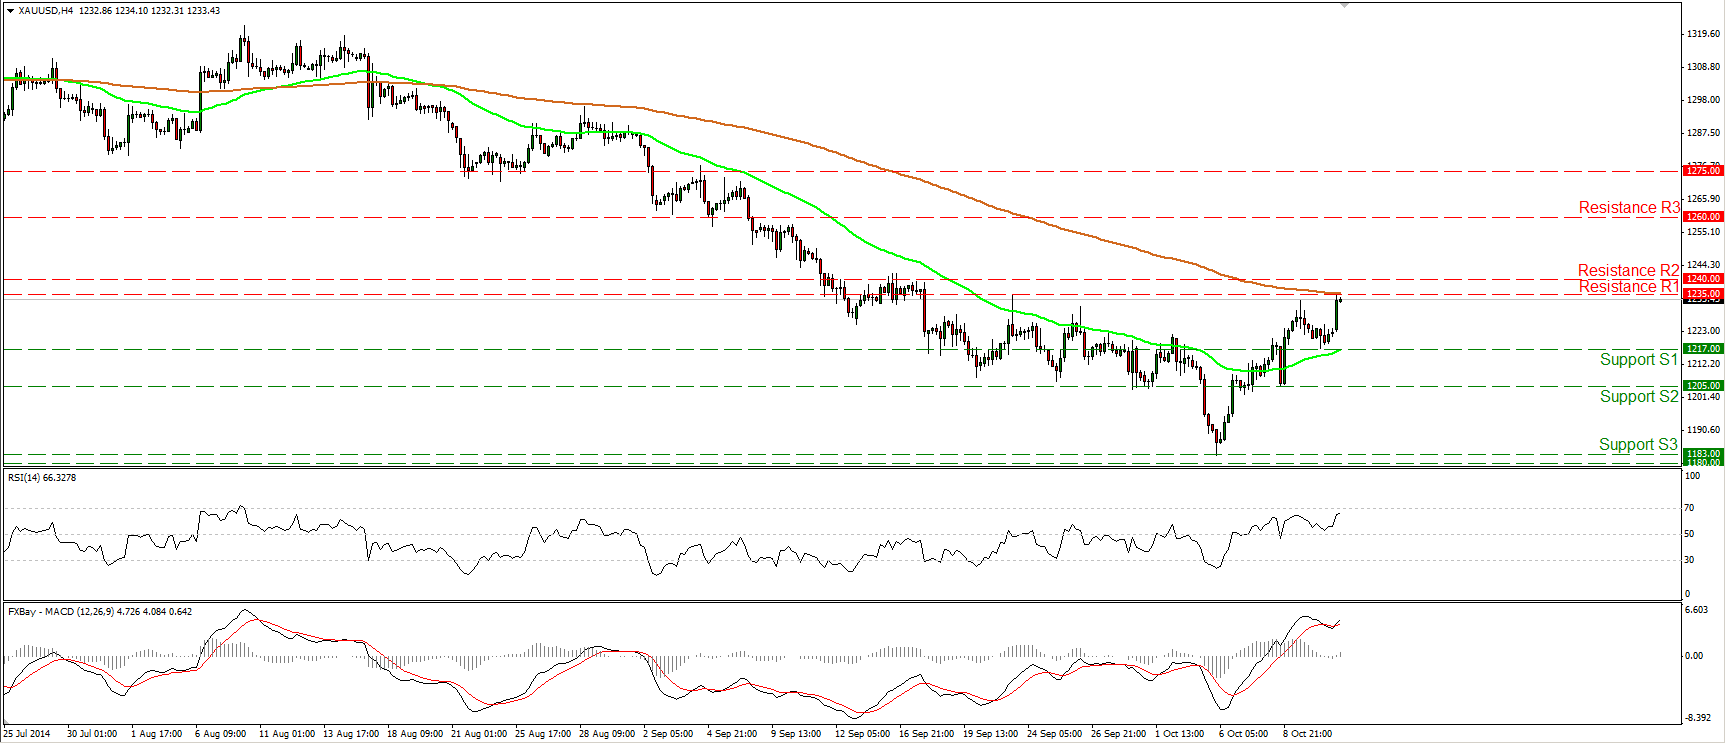
Gold moved higher during the Asian morning Monday, printing a higher low at 1217 (S1). During the early European morning, the precious metal looks ready to challenge the resistance zone of 1235/40 and the 200-period moving average. A clear and decisive move above that resistance zone is likely to pave the way for our next resistance barrier, at 1260 (R3). The notion is also supported by both our daily momentum indicators. The 14-day RSI crossed above its 50 line and is pointing up, while the daily MACD, although negative remains above its trigger. As far as the broader trend is concerned, I would maintain my “wait and see” stance for the same reasons I mentioned last week. On the 6th of October, the yellow metal rebounded strongly from the critical support zone of 1180/83, defined by the lows of June and December 2013, but the absence of any bullish trend reversal signals makes it too early to argue about any uptrend scenarios, in my view.
• Support: 1217 (S1), 1205 (S2), 1183 (S3)
• Resistance: 1235 (R1), 1240 (R2), 1260 (R3)
WTI finds resistance at 86.30
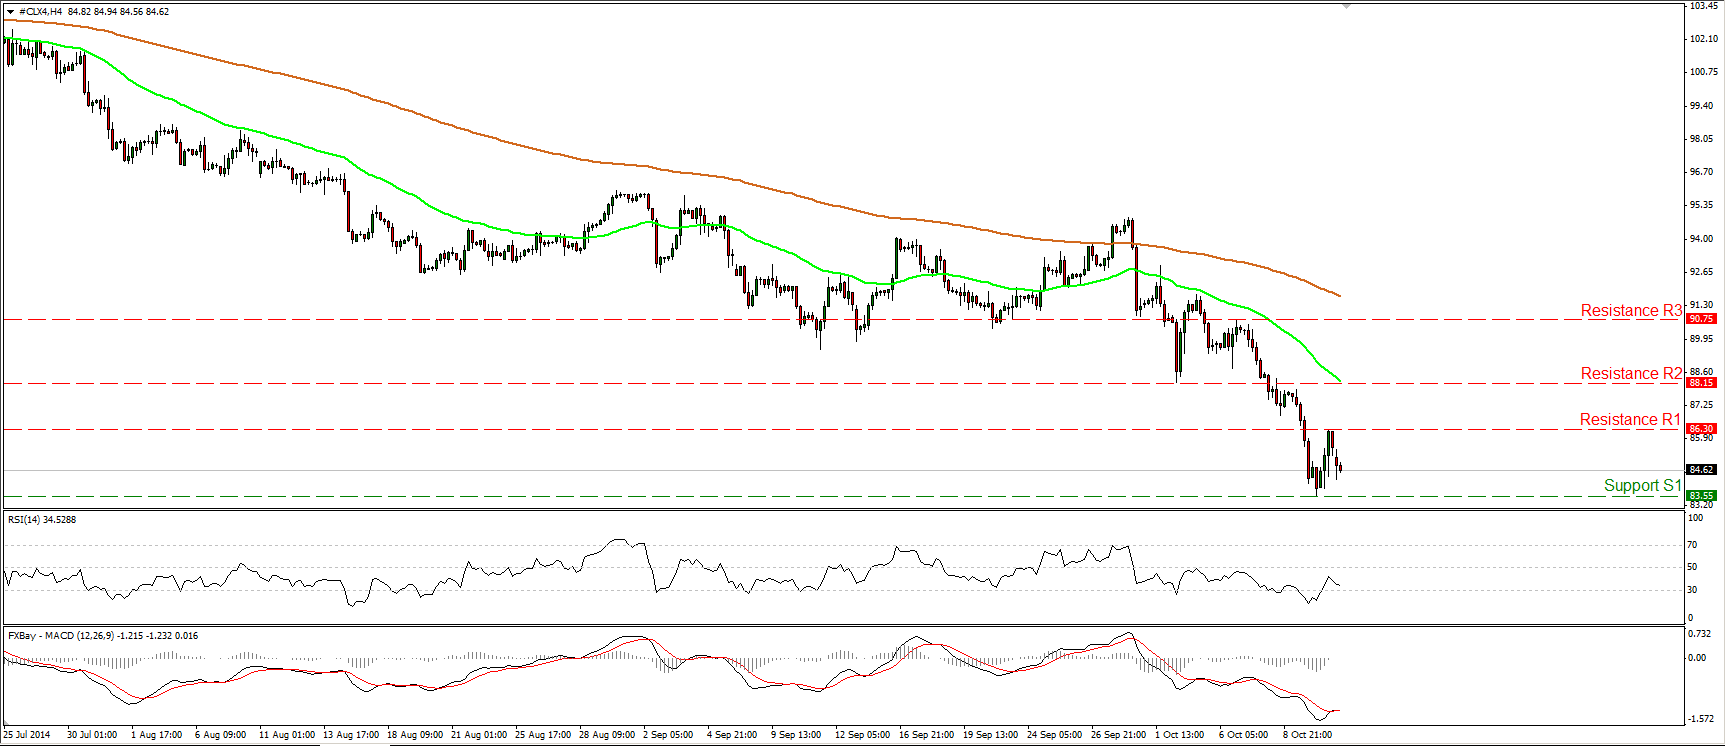
WTI declined after finding resistance at 86.30 (R1) and at the time of writing is heading towards the support line of 83.55 (S1), defined by Friday’s low. If the bears are strong enough to overcome that hurdle, I would expect them to see scope for extensions towards the low of the 2nd of July 2012, near the 82.00 zone. On the daily chart, as long as the price structure remains lower highs and lower lows below both the 50- and the 200-day moving averages, the overall trend remains to the downside, in my view.
• Support: 83.55 (S1), 82.00 (S2), 80.00 (S3)
• Resistance: 86.30 (R1), 88.15 (R2), 90.75 (R3)
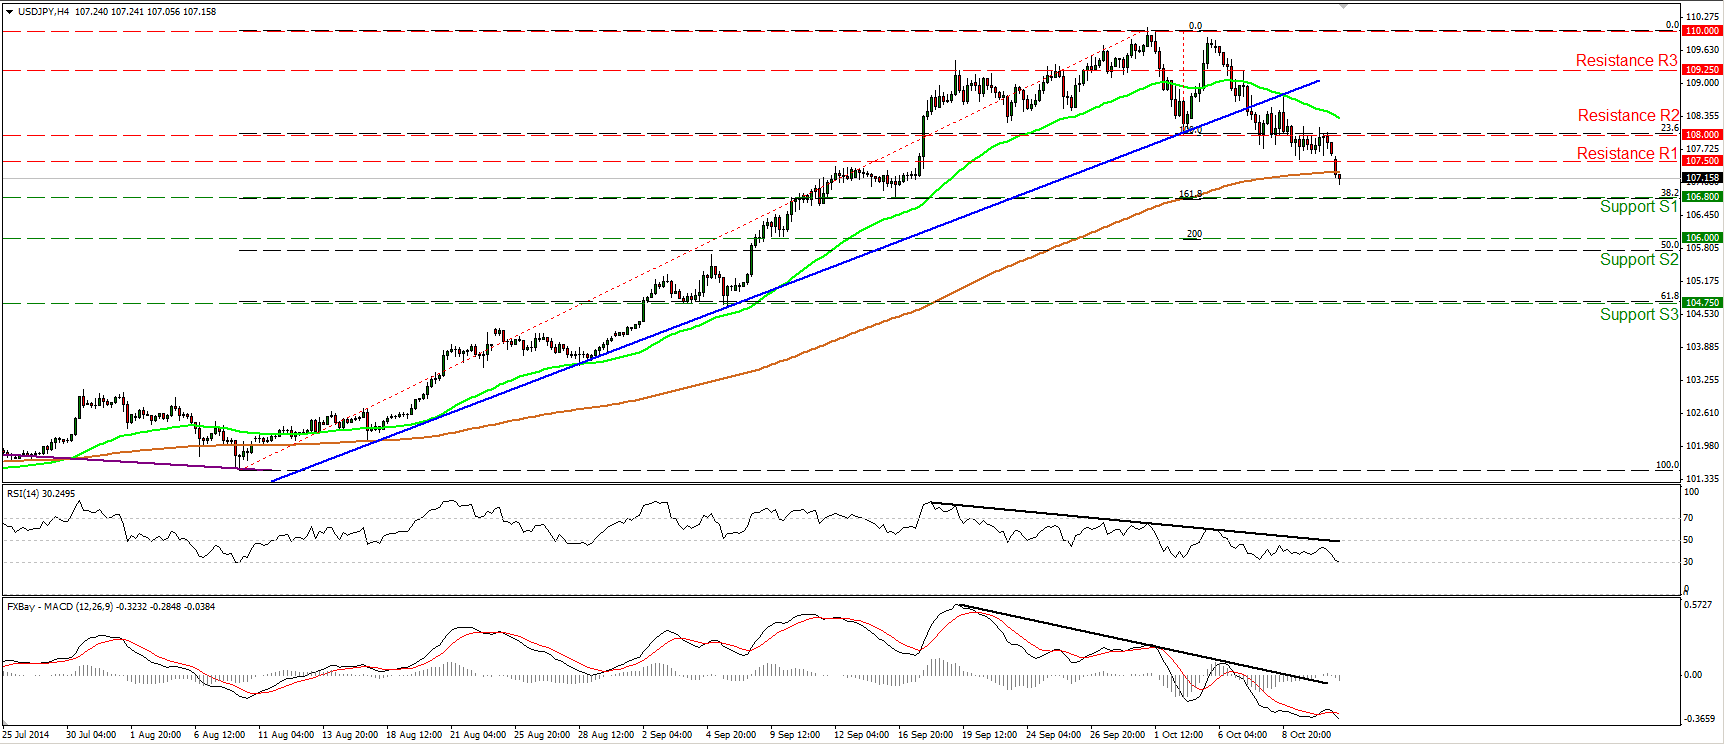
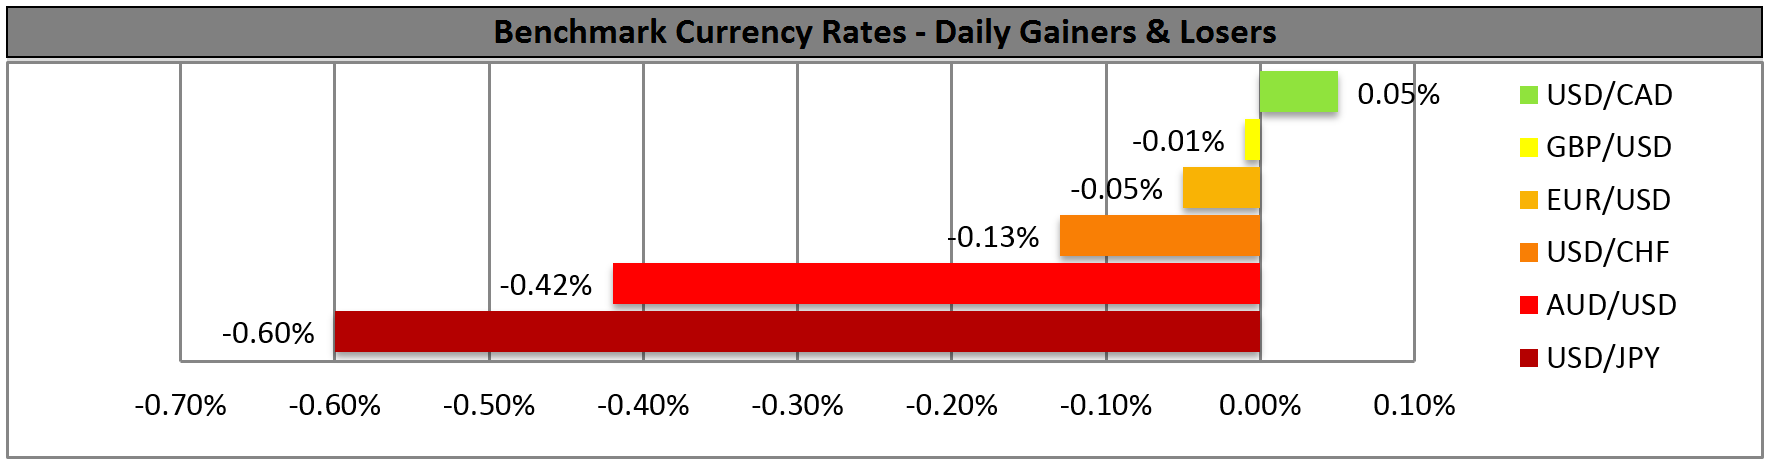
BENCHMARK CURRENCY RATES - DAILY GAINERS AND LOSERS
MARKETS SUMMARY