EUR/USD still in a consolidative mode
EUR/USD moved higher on Tuesday but found resistance at our black downtrend line and the 50-period moving average. During the early European morning, the pair is trading fractionally below that line. A decisive move above is necessary to trigger extensions towards our 1.2535 (R1) resistance zone. The pair is not giving any clear short-term directional impulses, as shown by our 4-hour momentum studies. The RSI is on its 50 line and moving sideways, while the MACD is above its trigger line approaching the zero level. In the bigger picture, since the price structure remains lower highs and lower lows below both the 50- and the 200-day moving averages, I maintain my view that the overall outlook of EUR/USD remains negative.
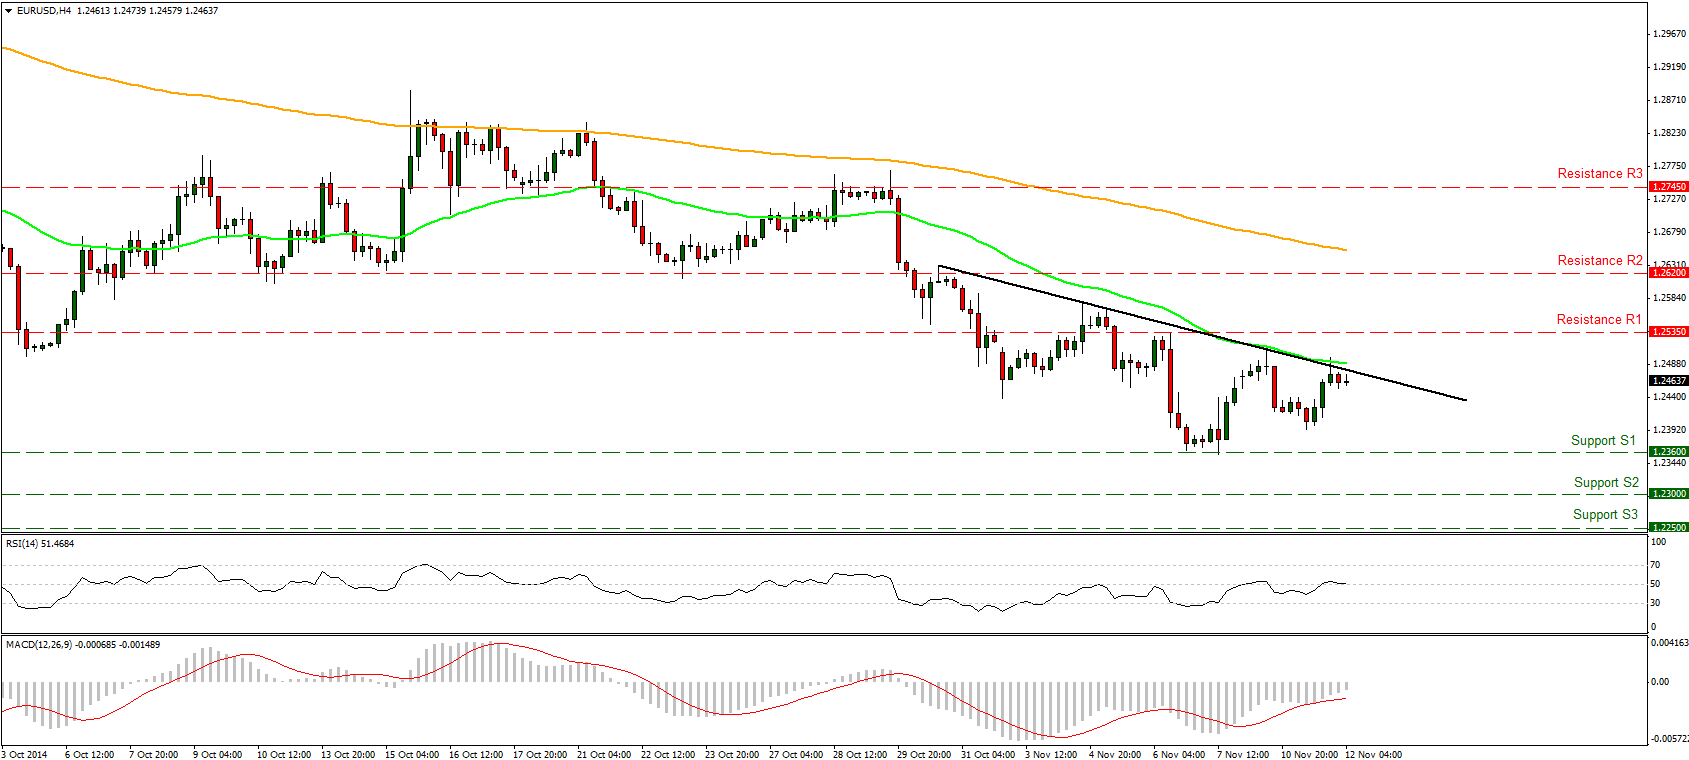
• Support: 1.2360 (S1), 1.2300 (S2), 1.2250 (S3).
• Resistance: 1.2535 (R1), 1.2620 (R2), 1.2745 (R3) .
GBP/USD undecided ahead of inflation report
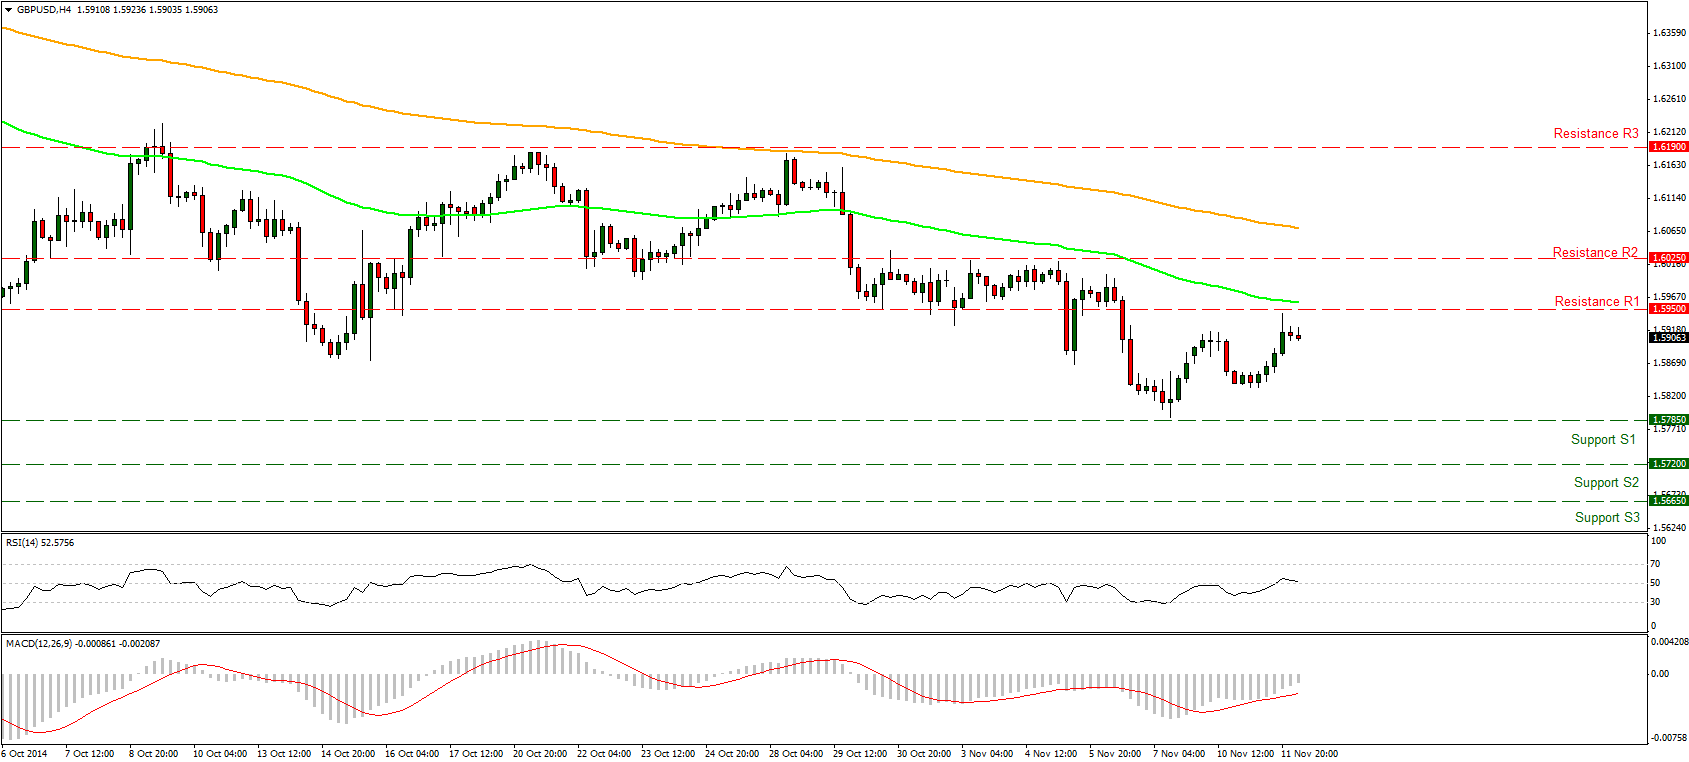
GBP/USD traded in a consolidative range in a calm Tuesday session, reflecting the uncertainty ahead of the job and inflation reports later in the day. Bearing in mind our momentum signs, I prefer to remain neutral as far as the short-term picture is concerned. The RSI is just above its 50 line and is pointing sideways, while the MACD is above its trigger line approaching the zero level. On the daily chart, as long as the pair is trading below the 80-day exponential moving average, the overall path remains negative, in my view. However, I would prefer to see a break below 1.5785 (S1) before getting again confident on the downside. On the other hand, strong employment figures and encouraging inflation report could push Cable above its 1.5950 (R1) resistance hurdle.
• Support: 1.5785 (S1), 1.5720 (S2), 1.5665 (S3).
• Resistance: 1.5950 (R1), 1.6025 (R2), 1.6190 (R3).
USD/JPY break above 115.50
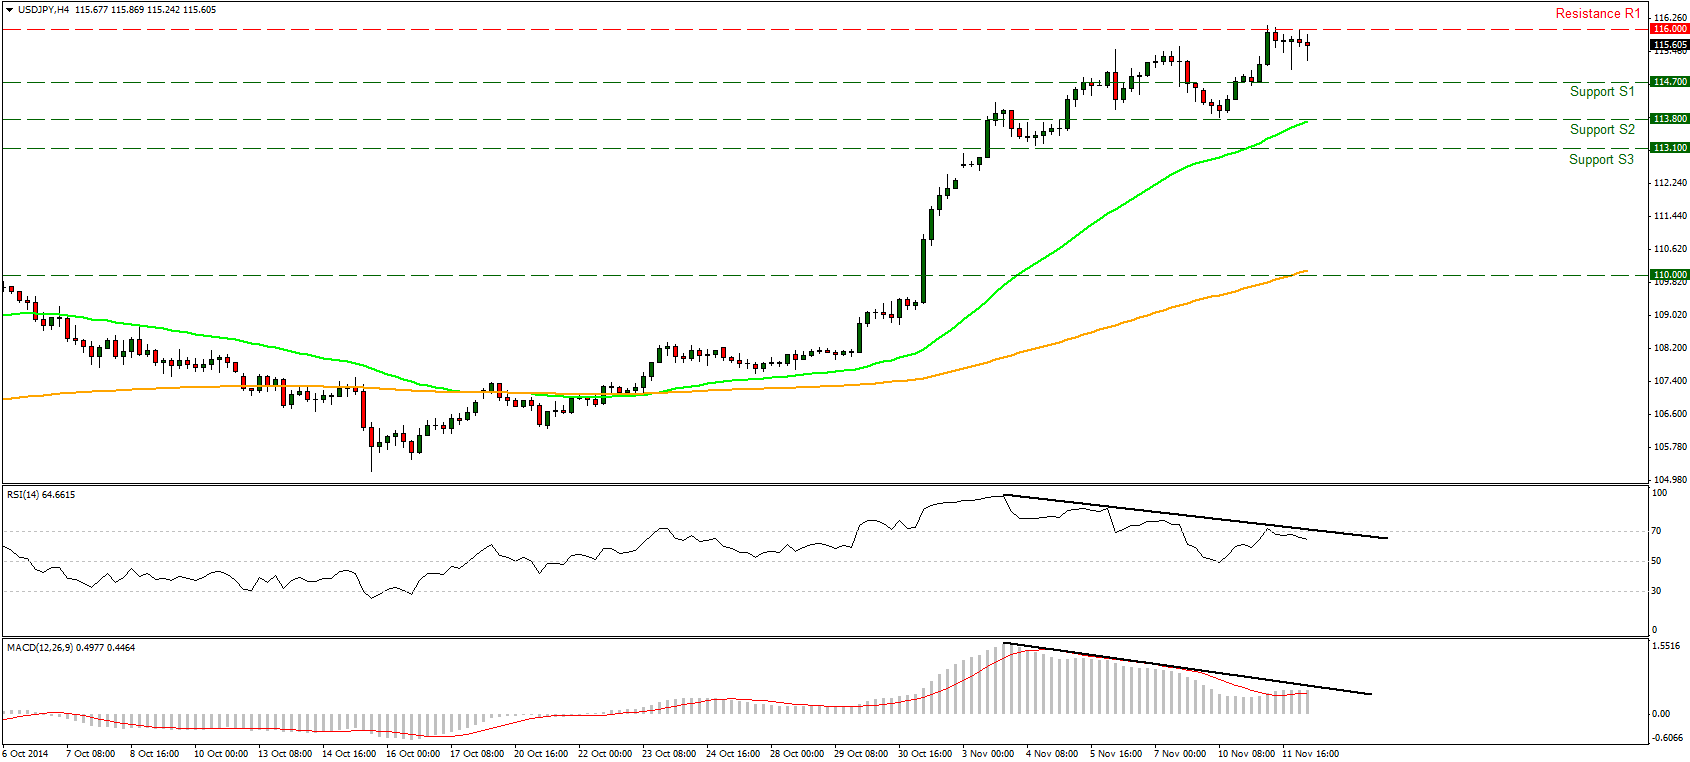
USD/JPY surged on Tuesday, breaking above our 115.50 prior resistance level, but the move was halted at our next obstacle of 116.00 (R1). However, taking into account the negative divergence between both of our near-term momentum studies and the price action, I would stay mindful of a possible pullback in the immediate future, perhaps towards the 114.70 (S1) support line, which stands slightly above the 23.6% retracement level of the 29th of October – 11th of November up leg. As for the broader trend, I believe that the overall outlook remains positive and I would treat any possible pullback as a corrective move before buyers prevail again. Furthermore, the daily MACD is already above its zero and trigger line and shows no signs of topping, while the 14-day RSI remains in its overbought territory. These are bullish momentum signs, which suggest that the rally is likely to continue.
• Support: 114.70 (S1), 113.80 (S2) 113.10 (S3).
• Resistance: 116.00 (R1), 117.00 (R2), 118.00 (R3).
Gold remains elevated near 1167
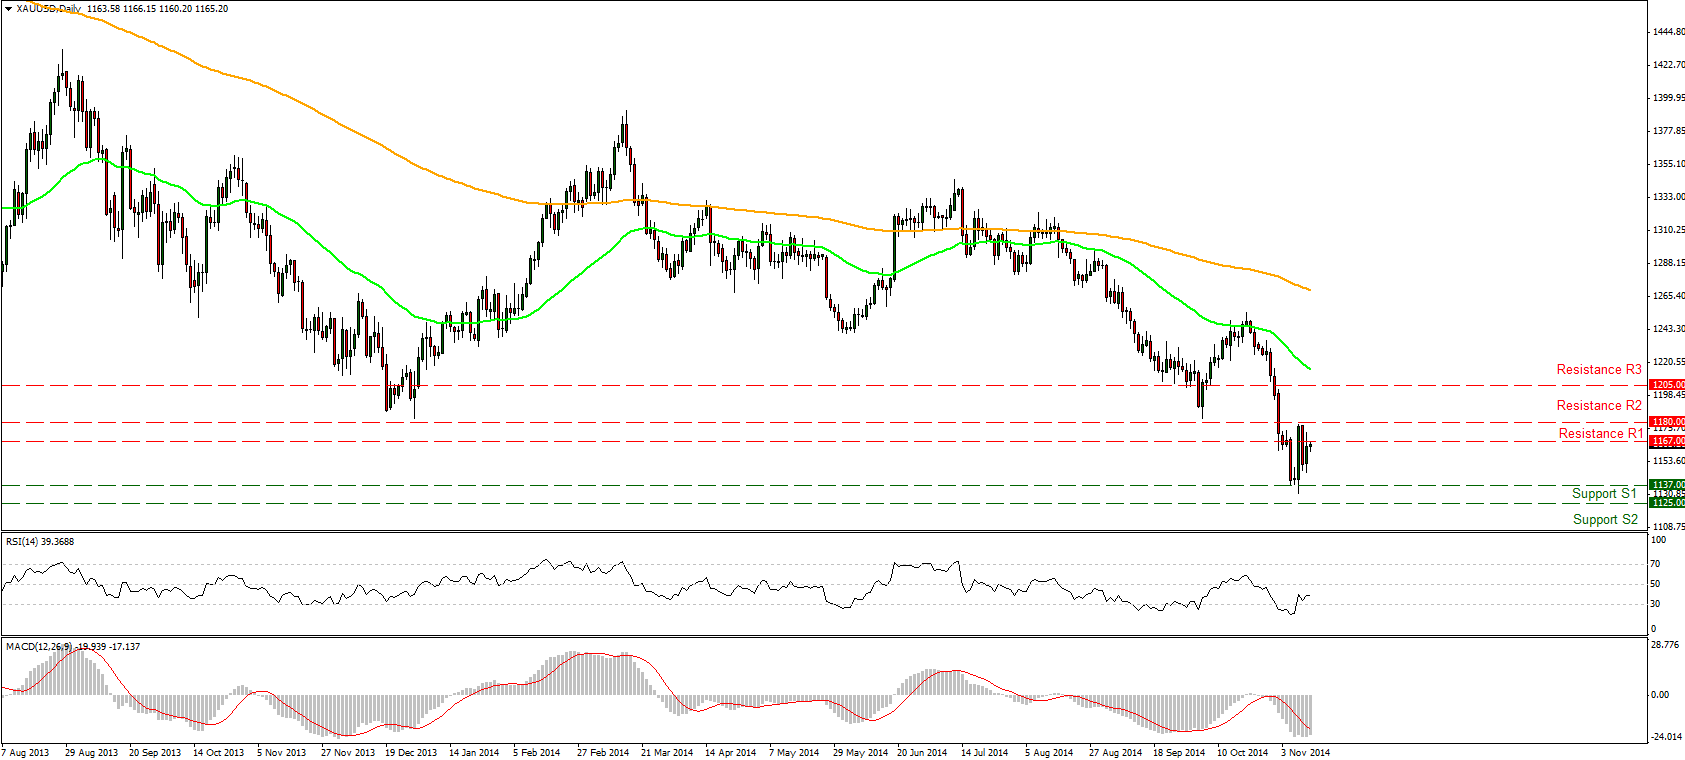
Gold advanced on Tuesday to test our resistance line of 1167 (R1), where it remained elevated during the early European morning Wednesday. Given our momentum studies I would prefer to take to the sidelines again, as far as the short-term picture is concerned. The RSI is marginally above its 50 line and is pointing sideways, while the MACD is above its trigger line and seems willing to cross its zero line. In the bigger picture, the price structure still suggests a downtrend but I would prefer to see a break below the 1137 (S1) zone to get more confident for further extensions.
• Support: 1137 (S1), 1125 (S2), 1100 (S3) .
• Resistance: 1167 (R1), 1180 (R2), 1205 (R3).
WTI moves sideways
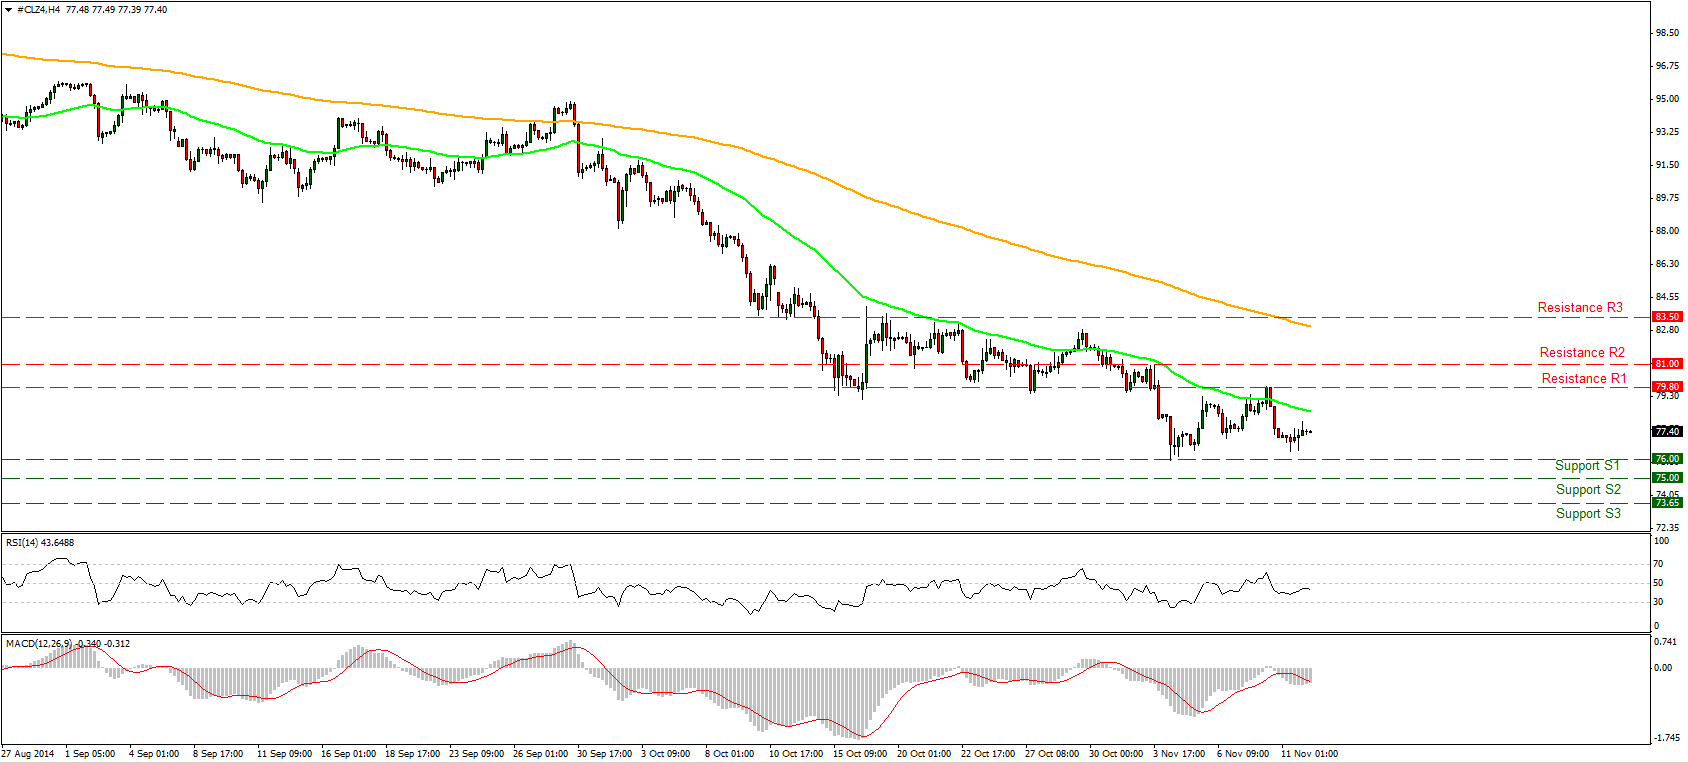
WTI traded sideways between the 76.00 (S1) support area and the resistance of 79.80 (R1). Since the oil price seems to be oscillating between these two lines, I would prefer remain flat. A clear and decisive break of 76.00 (S1) is necessary for further declines, perhaps towards the psychological zone of 75.00 (S2), defined by the lows of October 2010. On the other hand, a break above 79.80 (R1) could trigger further extensions towards 81.00 (R2). On the daily chart, the price structure remains lower peaks and lower troughs below both the 50- and the 200- day moving averages, keeping the overall trend to the downside.
• Support: 76.00 (S1), 75.00 (S2), 73.65 (S3) .
• Resistance: 79.80 (R1), 81.00 (R2), 83.50 (R3).
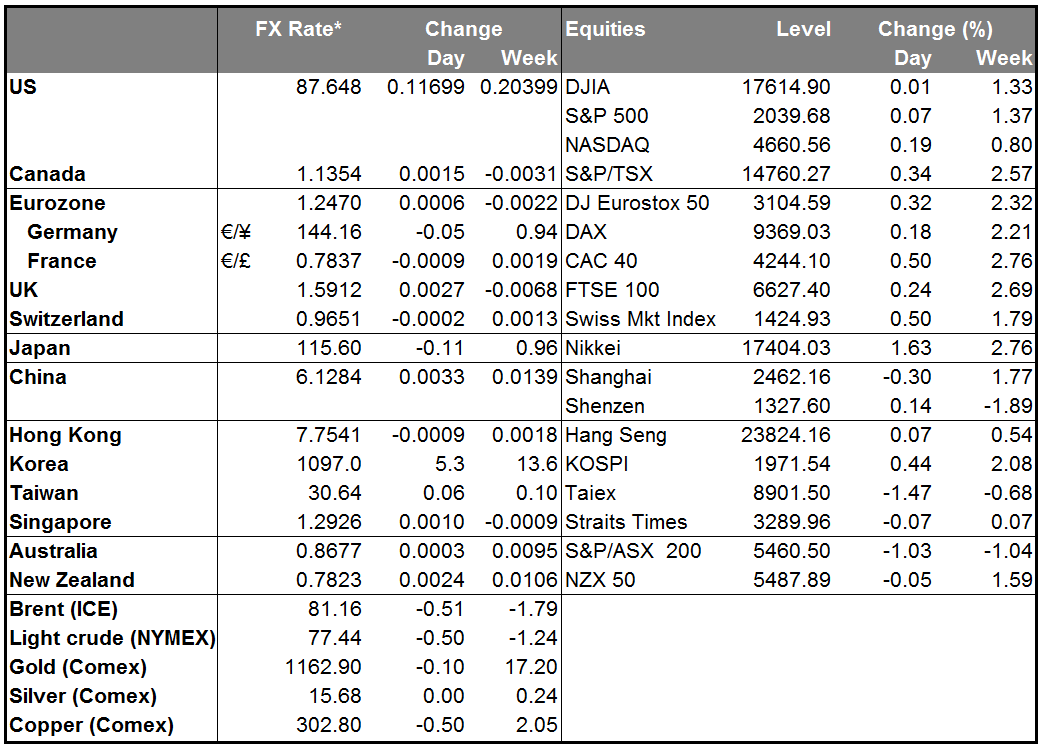
BENCHMARK CURRENCY RATES - DAILY GAINERS AND LOSERS
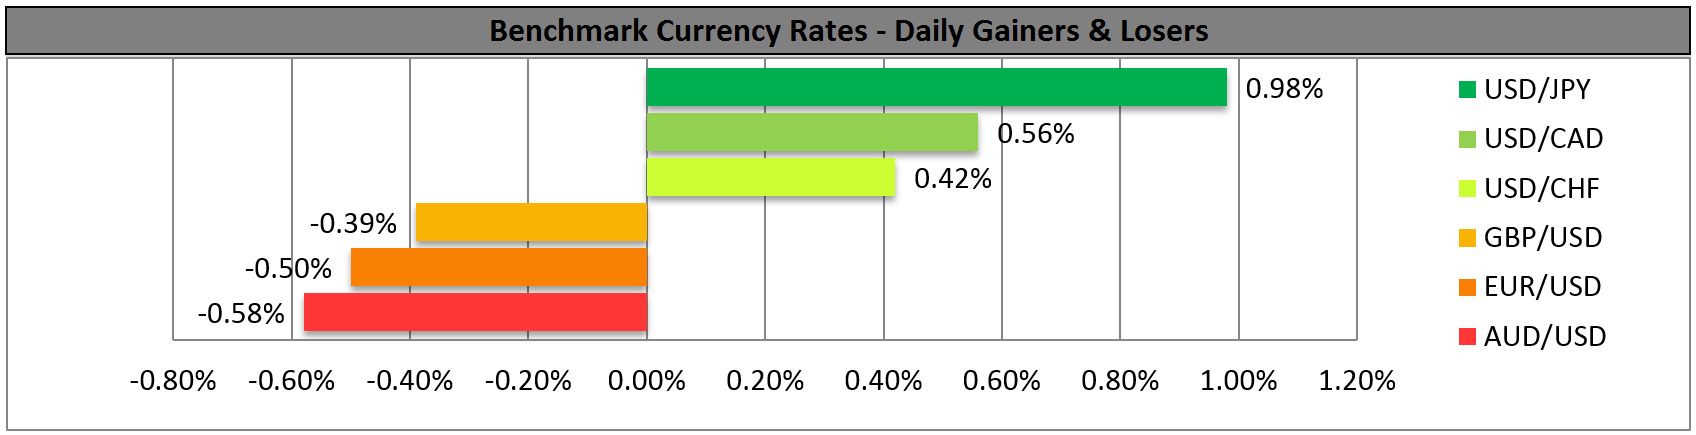
MARKETS SUMMARY