EUR/USD in a consolidative mode
EUR/USD declined after touching the 50-period moving average, but it remained elevated above our 1.2360 (S1) support line. The RSI found resistance near its 50 line and is pointing down somewhat, while the MACD is already in negative territory and likely to cross below its trigger line. On the daily chart, the price structure remains lower highs and lower lows below both the 50- and the 200-day moving averages. Hence, I consider the overall outlook of EUR/USD remains negative. Looking at our daily momentum indicators, the RSI moved higher after finding support at its 30 line and is pointing up, while the daily MACD remains below both its zero and signal lines. I also observe positive divergence between both oscillators and the price action, which favor a correction. As a result, EUR/USD could rebound somewhat today, at least until hitting the first resistance at 1.2535 (R1).
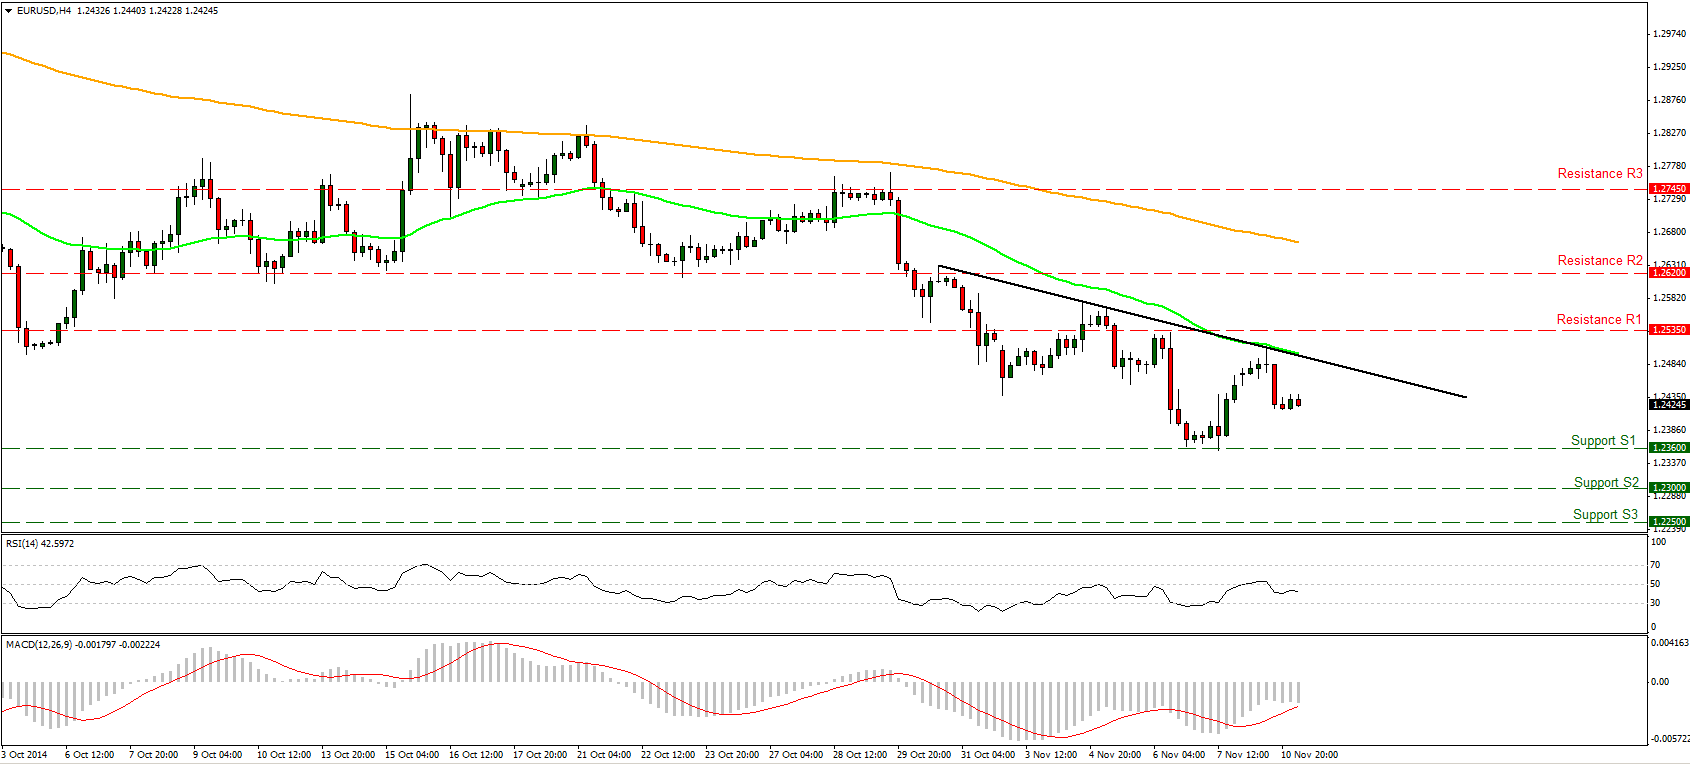
• Support: 1.2360 (S1), 1.2300 (S2), 1.2250 (S3)
• Resistance: 1.2535 (R1), 1.2620 (R2), 1.2745 (R3)
GBP/USD stable ahead of the inflation report

GBP/USD moved sideways in a quiet Monday session, reflecting the restrained mood of investors ahead of the job and inflation reports on Wednesday. Bearing in mind our momentum signs, I maintain my wait-and-see stance as far as the short-term picture is concerned. The RSI seemed to find resistance at its 50-line and moved lower, while the MACD, already in negative territory, is pointing down. As for the broader trend, I still think that as long as Cable is trading below the 80-day exponential moving average, the overall path remains negative. Nevertheless, I would prefer to see a break below 1.5785 (S1) before getting again confident on the downside. Such a dip would signal a forthcoming lower low on the daily chart and could trigger extensions towards the next support barrier of 1.5720 (S2), defined by the high of the 21st of August 2013. Moreover, I still see positive divergence between our daily oscillators and the price action. This confirms my view to wait for a move below 1.5785 (S1) to signal the continuation of the downward path.
• Support: 1.5785 (S1), 1.5720 (S2), 1.5665 (S3)
• Resistance: 1.5950 (R1), 1.6025 (R2), 1.6190 (R3)
USD/JPY heading towards 115.50

USD/JPY advanced after finding support at 113.80 (S1) zone and during the early European hours the pair is heading towards our 115.50 (R1) resistance level. A break above that level could pave the way to our next resistance of 116.00 (R2). On the daily chart, the rally above the psychological line of 110.00 confirmed a forthcoming higher peak, something that keeps the overall path of USD/JPY to the upside. Furthermore, the daily MACD is already above its zero and trigger line and shows no signs of topping, while the 14-day RSI moved further into its overbought territory. These are bullish momentum signs, which suggest that the rally is likely to continue.
• Support: 113.80 (S1) 113.10 (S2), 112.50 (S3)
• Resistance: 115.50 (R1), 116.00 (R2), 117.00 (R3)
Gold dips below 1165
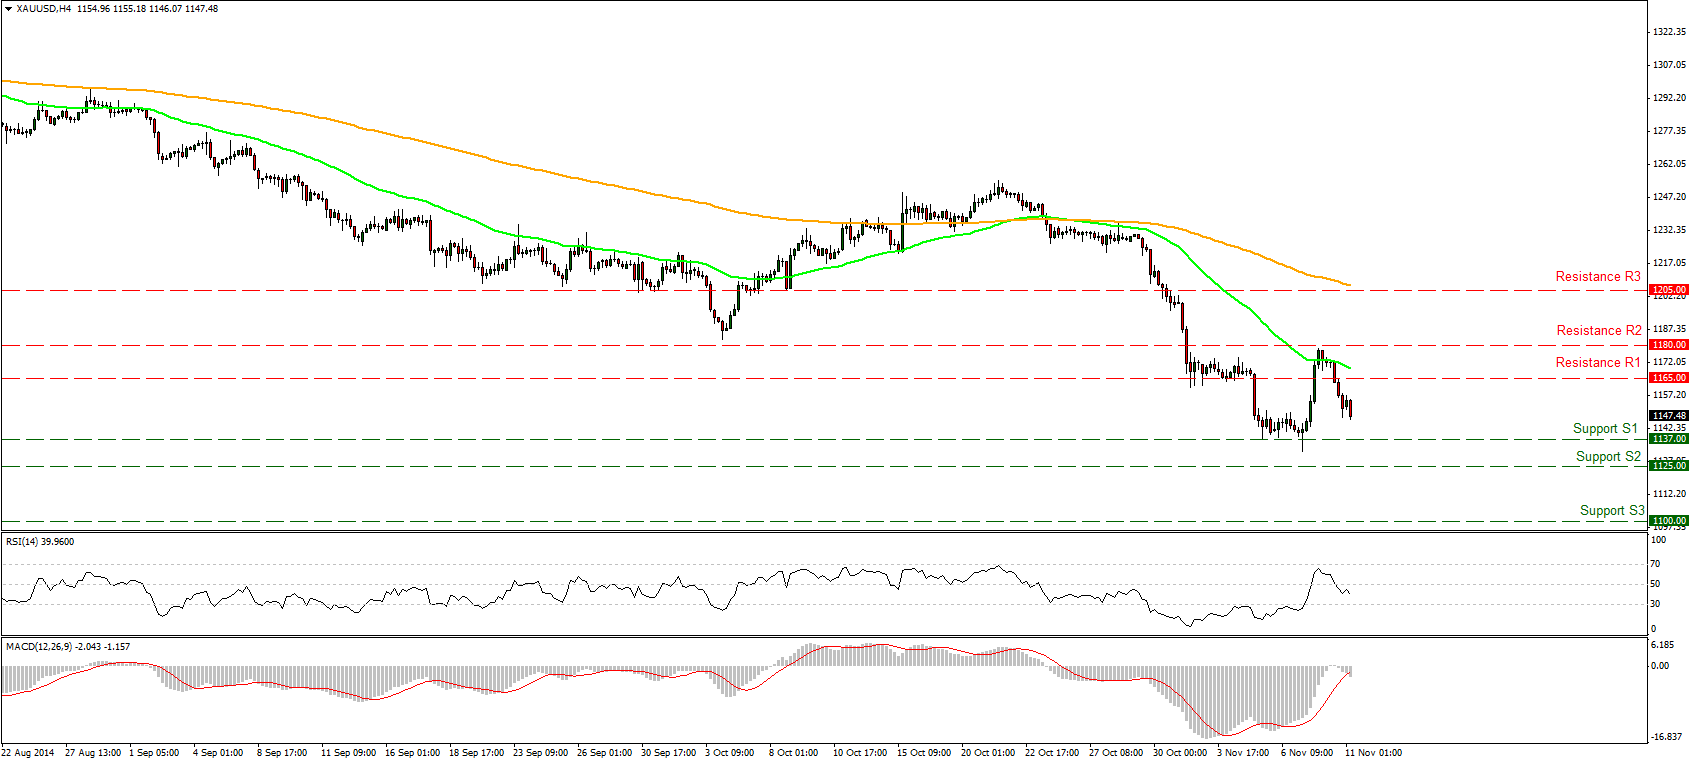
Gold plunged after staying fractionally below the strong level of 1180, breaking our support-turned-into-resistance line of 1165 (R1). The price structure suggests a downtrend but I would prefer to see a break below the 1137 (S1) zone to get more confident for further extensions. In the bigger picture, our daily RSI marginally above its 30 line is pointing down, while the daily MACD remains below its zero and trigger lines, indicating that the downward momentum continues.
• Support: 1137 (S1), 1125 (S2), 1100 (S3)
• Resistance: 1165 (R1), 1180 (R2), 1205 (R3)
WTI declines after testing the 79.80 line
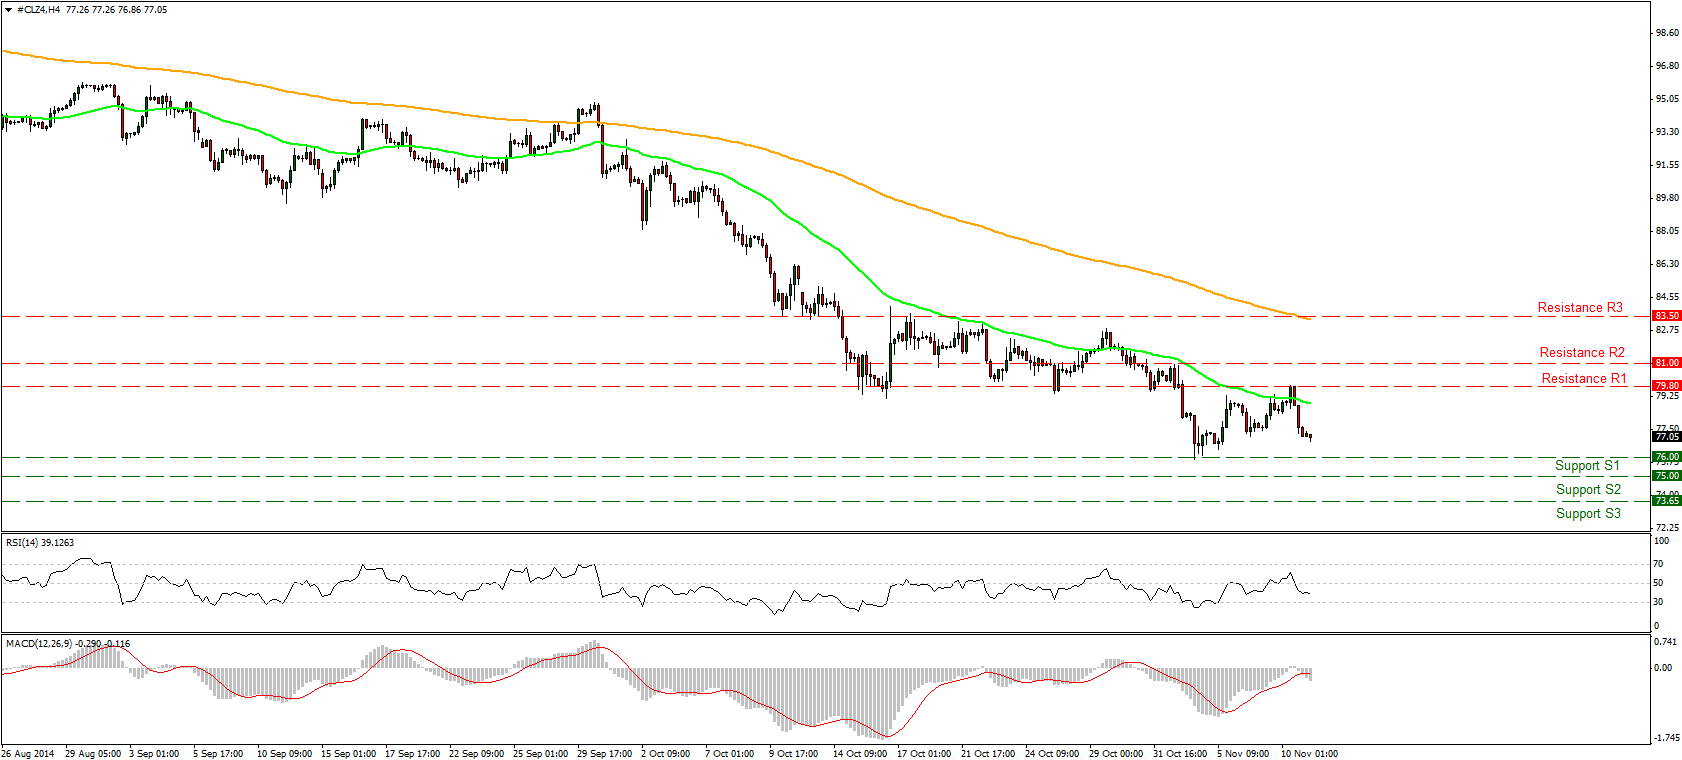
WTI tumbled after failing to break the 79.80 (R1) resistance line and during early European morning is heading towards our 76.00 (S1) support hurdle. A clear and decisive break of that level could challenge the psychological zone of 75.00 (S2), defined by the lows of October 2010. On the daily chart, the price structure remains lower peaks and lower troughs below both the 50- and the 200- day moving averages, keeping the overall trend to the downside.
• Support: 76.00 (S1), 75.00 (S2), 73.65 (S3)
• Resistance: 79.80 (R1), 81.00 (R2), 83.50 (R3)
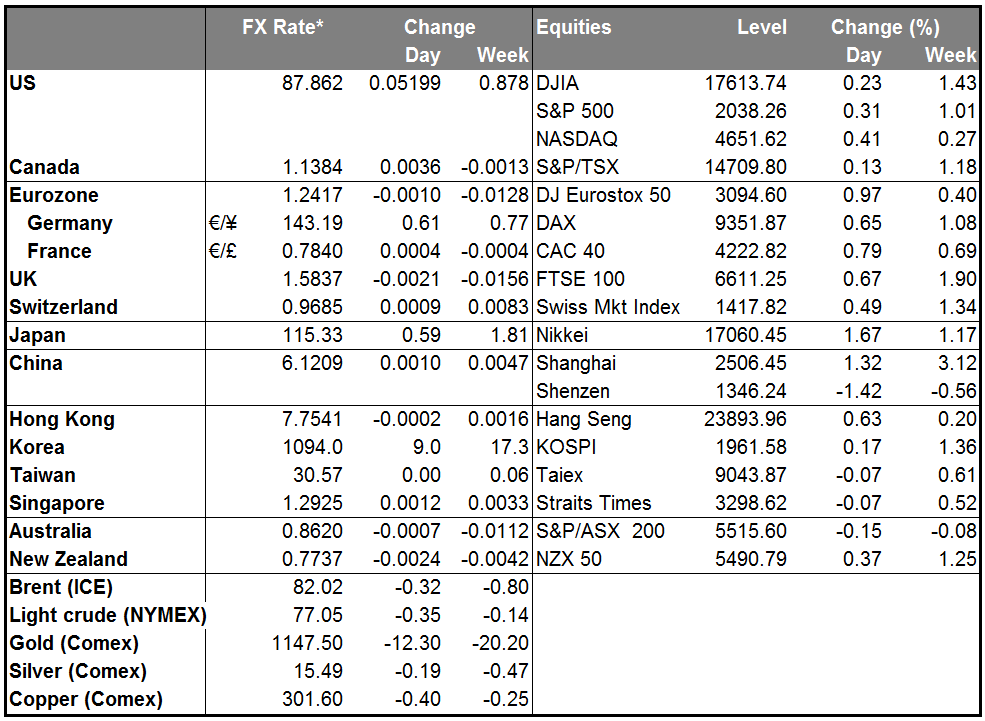
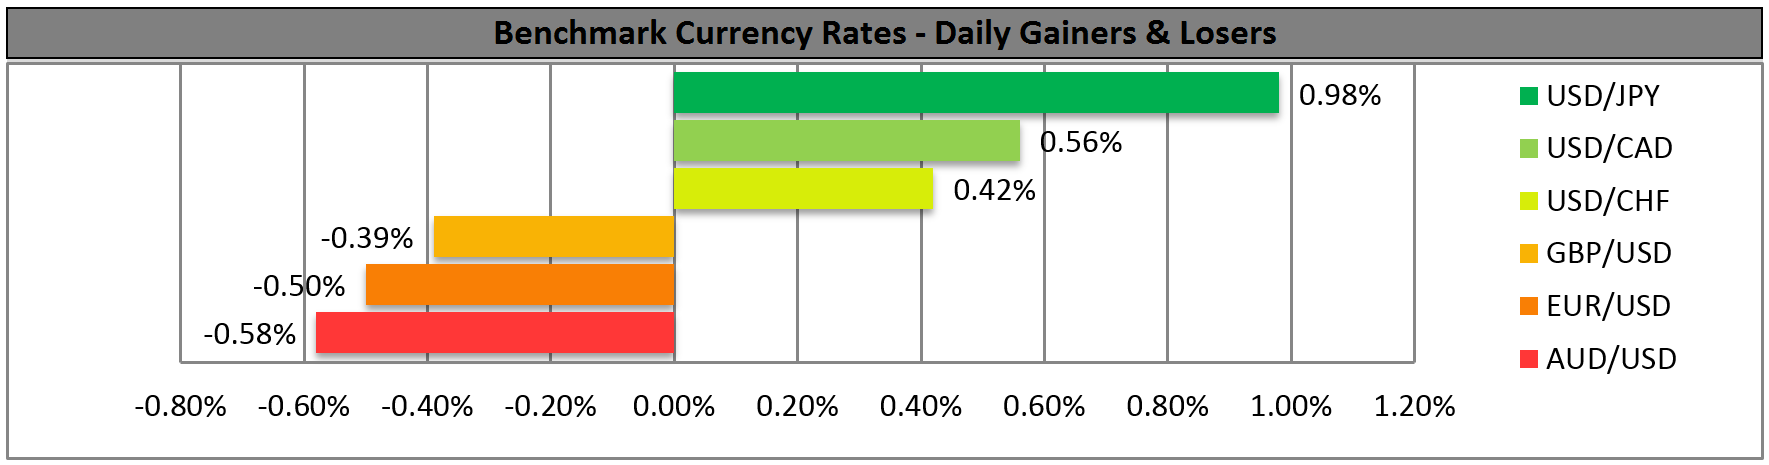
BENCHMARK CURRENCY RATES - DAILY GAINERS AND LOSERS
MARKETS SUMMARY