EUR/USD lower after hitting 1.2790
EUR/USD declined yesterday after finding resistance at 1.2790 (R1). However, the decline was halted by the 50-period moving average and the 1.2675 (S1) line. In my opinion, as long as the support line of 1.2600 (S2) holds, I still see the likelihood of a higher low. A clear move above the 1.2790 (R1) barrier could perhaps target the next resistance line at 1.2900 (R2). On the daily chart, our momentum studies support the notion. The positive divergence between the RSI and the price action is still in effect, while the MACD, although negative, remains above its trigger line. Nevertheless, the broader trend remains to the downside since the price structure remains lower peaks and lower troughs below the 50- and the 200-day moving averages. As a result I will treat this week’s up wave or any extensions of it as a corrective phase for now.
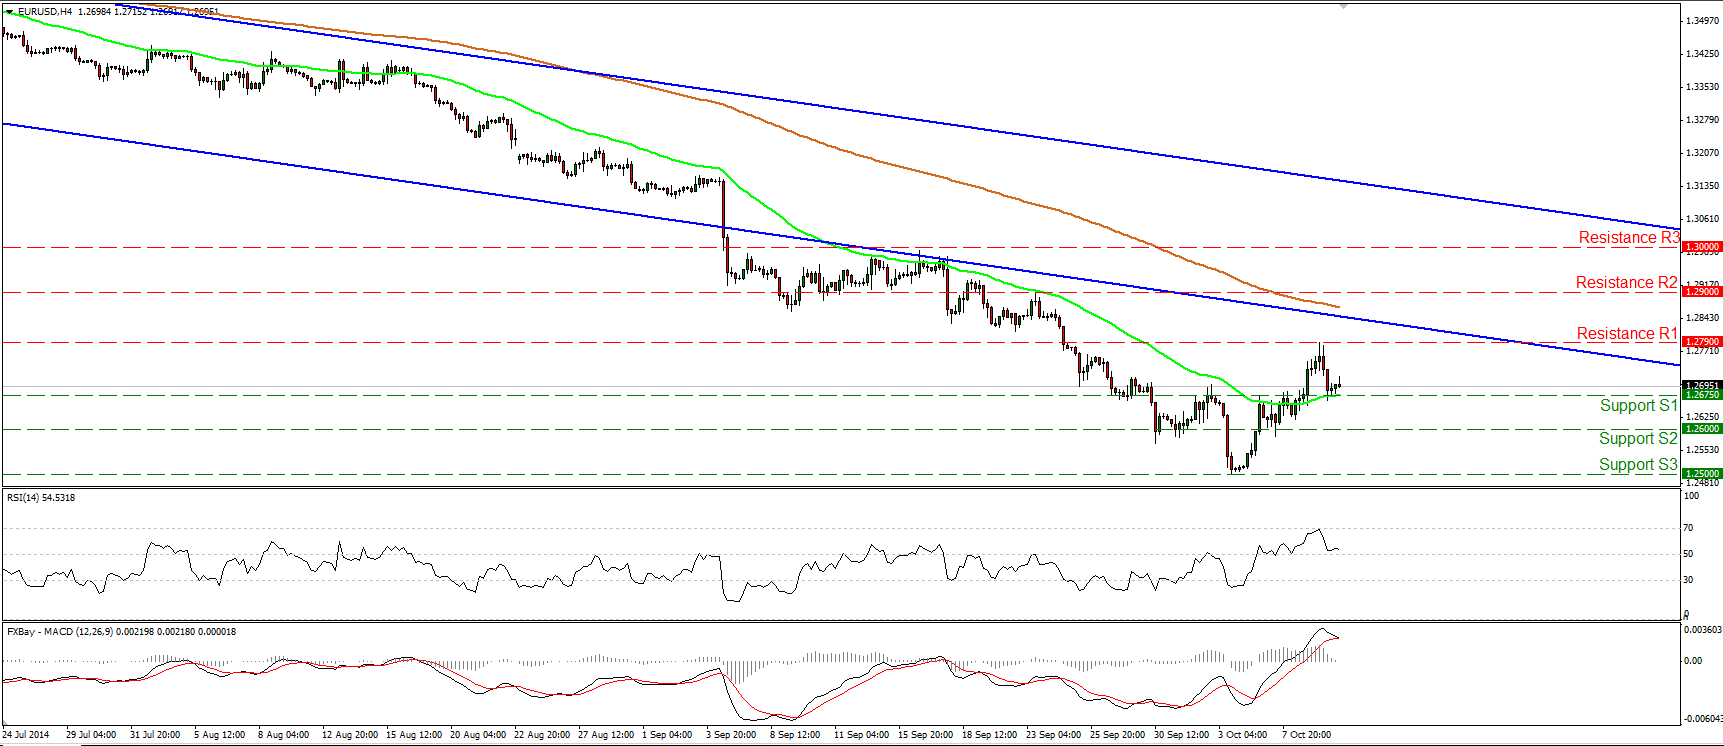
• Support: 1.2675 (S1), 1.2600 (S2), 1.2500 (S3)
• Resistance: 1.2790 (R1), 1.2900 (R2), 1.3000 (R3)
GBP/JPY within a near-term range
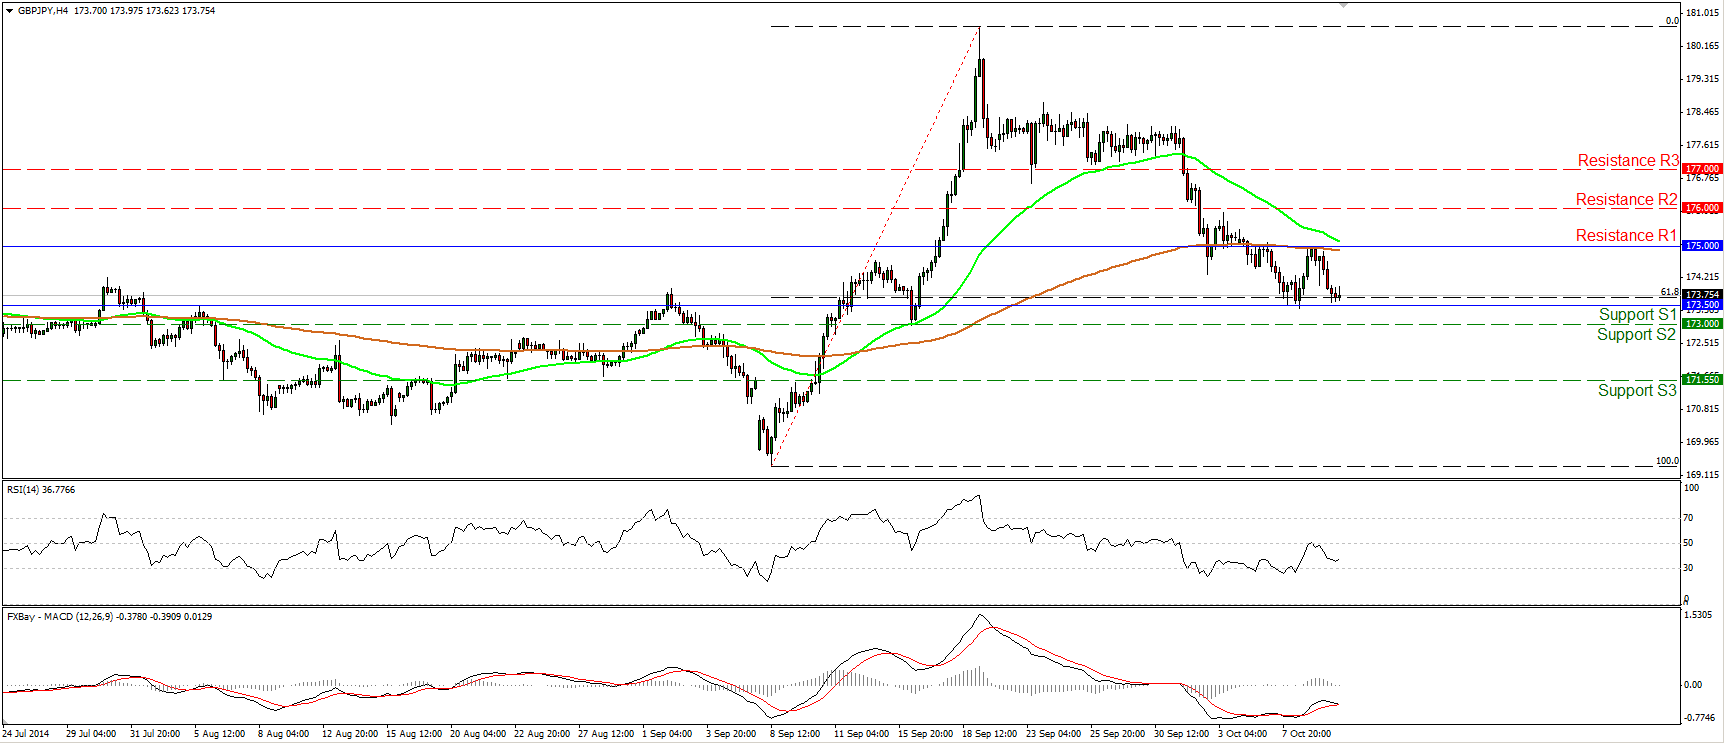
GBP/JPY moved lower after finding resistance at the 175.00 (R1) line and the 200-period moving average, but the down move was stopped near the 173.50(S1) line, which lies marginally below the 61.8% retracement level of the 8th – 19th of September up move. As long as the rate oscillates between these two lines I would adopt a neutral stance as far as the near-term picture is concerned. In the bigger picture, the rate remains above the upper bound of the broadening formation, completed on the 11th of September, and above the 200-day moving average. Thus, in the absence of any major bearish trend reversal signals, I would see a cautiously positive overall picture and I would treat the 19th Sep. - 8th Oct. down wave or any extensions of it as a corrective move.
• Support: 173.50 (S1), 173.00 (S2), 171.55 (S3)
• Resistance: 175.00 (R1), 176.00 (R2), 177.00 (R3)
AUD/USD finds resistance at 0.8900
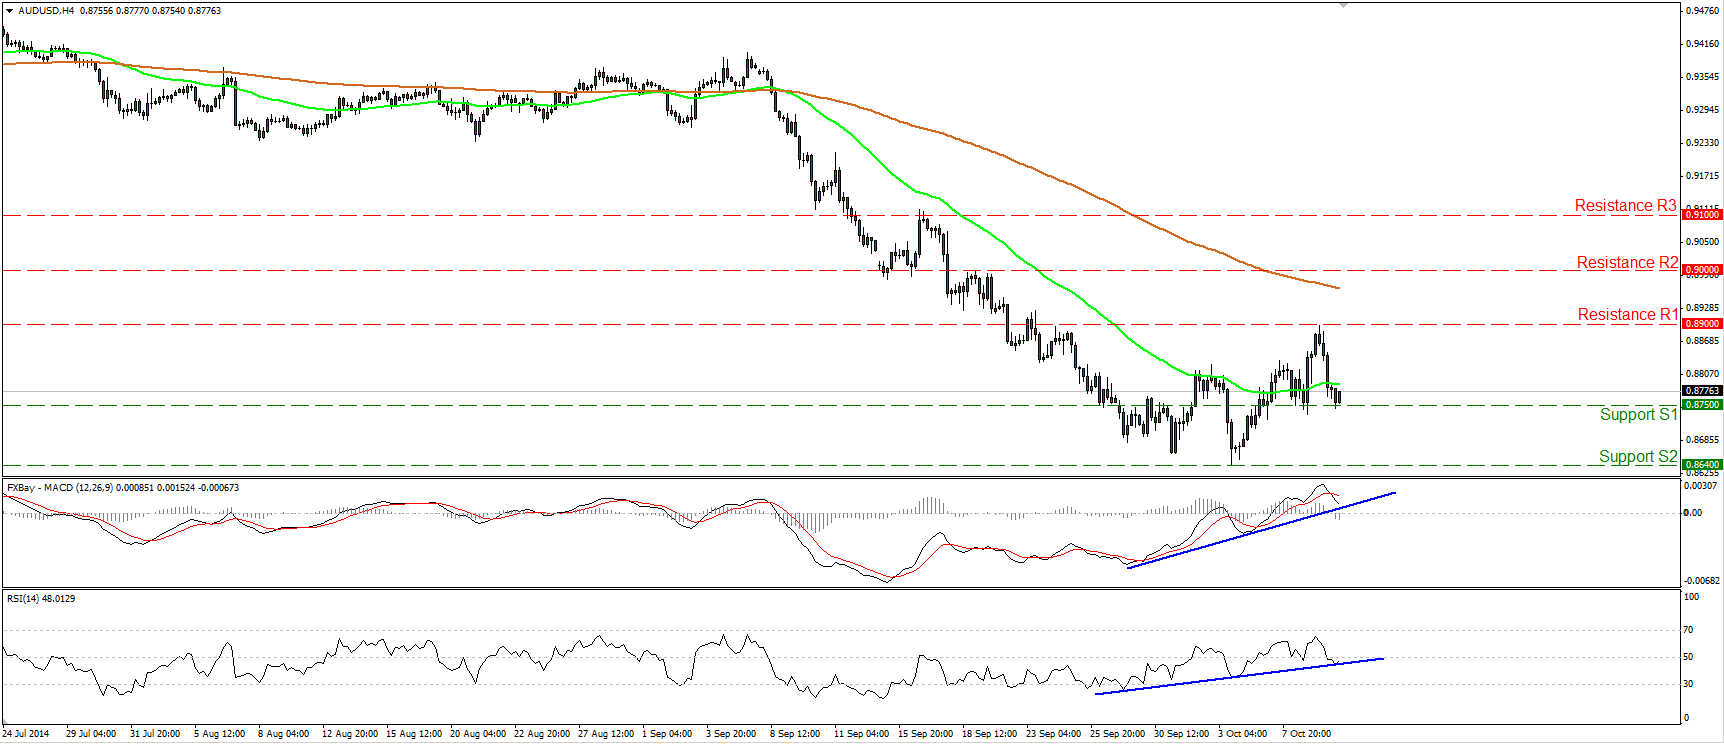
AUD/USD tumbled after hitting the 0.8900 (R1) line to find support at 0.8750 (S1). Although I still consider the overall trend of this pair to the downside, since the positive divergence between our oscillators and the price action is still in effect, the upside correction may have further to go. Our daily momentum studies also support the notion. The 14-day RSI moved higher after exiting its oversold territory, while the MACD has bottomed and moved above its signal line. As a result, I would take the sidelines for now and I would wait for the bears to give more actionable signs that the downtrend is back in force.
• Support: 0.8750 (S1), 0.8640 (S2), 0.8565 (S3)
• Resistance: 0.8900 (R1), 0.9000 (R2), 0.9100 (R3)
Gold finds resistance marginally below 1235
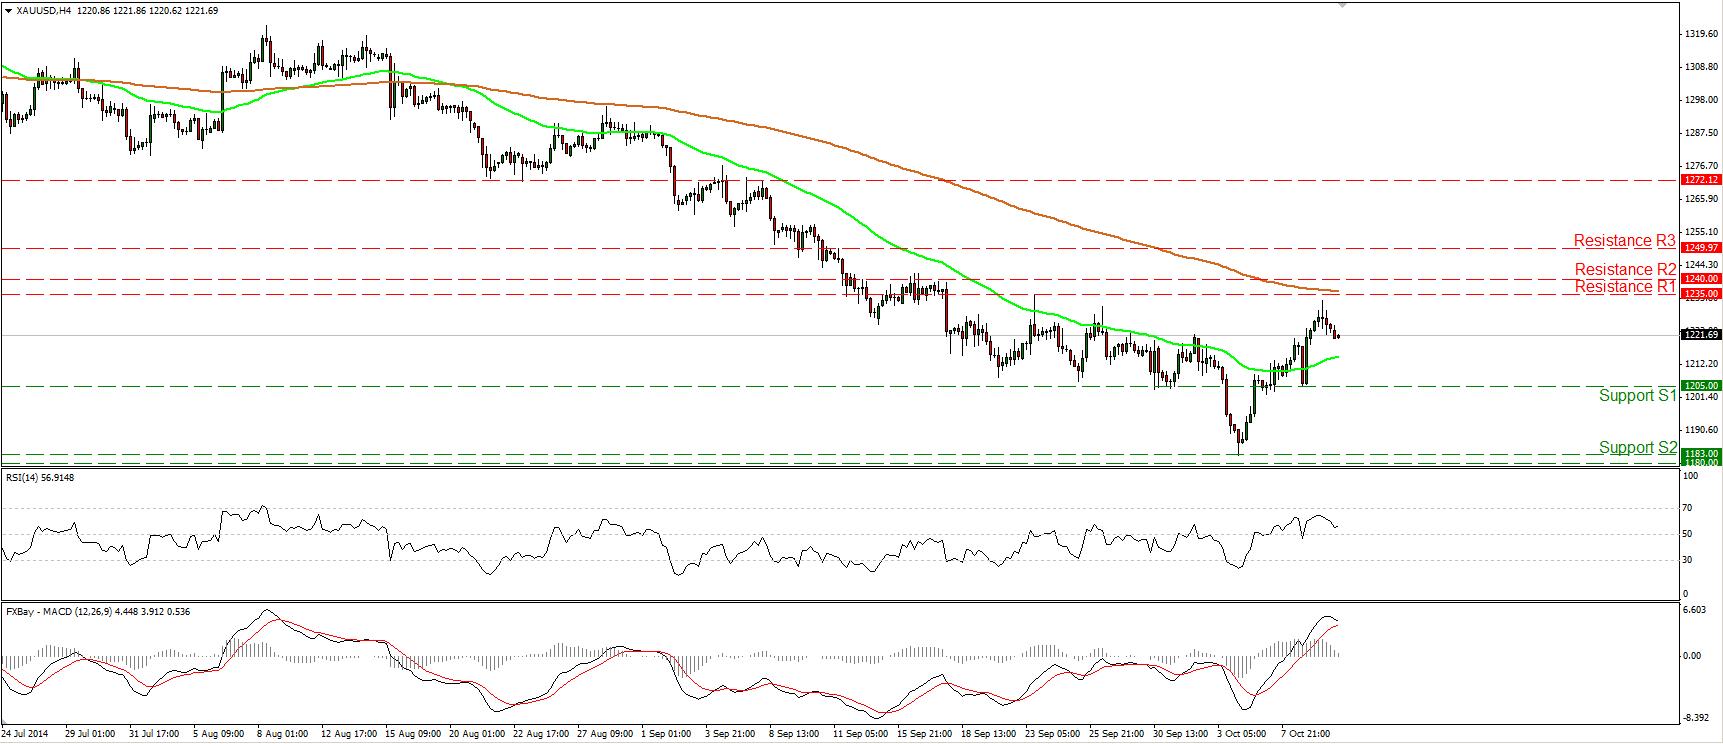
Gold continued higher on Thursday, but after finding resistance a couple of dollars below our resistance line of 1235 (R1), it pulled back. The RSI moved lower after finding resistance below its 70 line, while the MACD has topped and appears ready to cross below its signal in the close future. Taking these signs into account, I would be cautious of further pullback. However, as long as the support line of 1205 holds, the possibility for a higher low still exists, thus I would see a mildly positive near-term picture. As far as the broader trend is concerned, I would maintain my “wait and see” stance for the same reasons I mentioned in my previous comments. On Monday, the metal rebounded strongly from the critical support zone of 1180/83, defined by the lows of June and December 2013, but the absence of any bullish trend reversal signals makes it too early to argue about any uptrend scenarios, in my view.
• Support: 1205(S1), 1183 (S2), 1180 (S3)
• Resistance: 1235 (R1), 1240 (R2), 1250 (R3)
WTI continues plunging

WTI collapsed on Thursday, reaching and breaking below our support line (turned into resistance) of 86.00. The decline was halted by our next hurdle at 84.15 (S1). Another break here could pull the trigger for extensions towards the 82.00 zone, defined by the low of the 2nd of July 2012. The RSI lies within its oversold territory but is pointing down, while the MACD remains below both its trigger and signal lines. These designate accelerating bearish momentum and amplify the case for further declines in the near future. On the daily chart, as long as the price structure remains lower highs and lower lows below both the 50- and the 200-day moving averages, the overall trend remains to the downside.
• Support: 84.15 (S1), 82.00 (S2), 80.00 (S3)
• Resistance: 86.00 (R1), 88.15 (R2), 90.75 (R3)
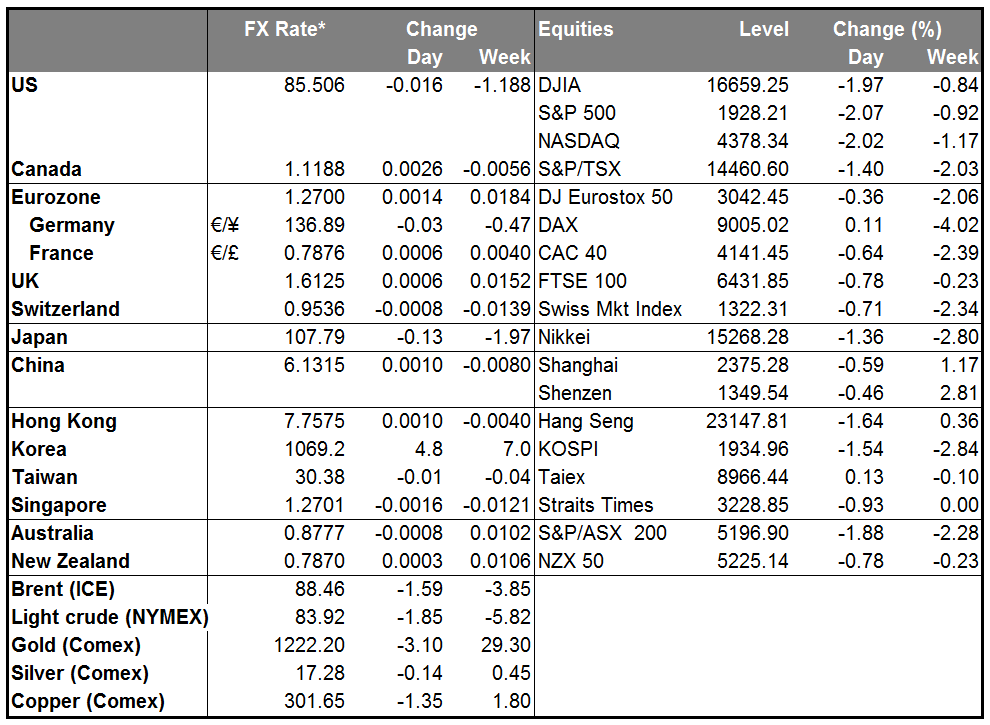
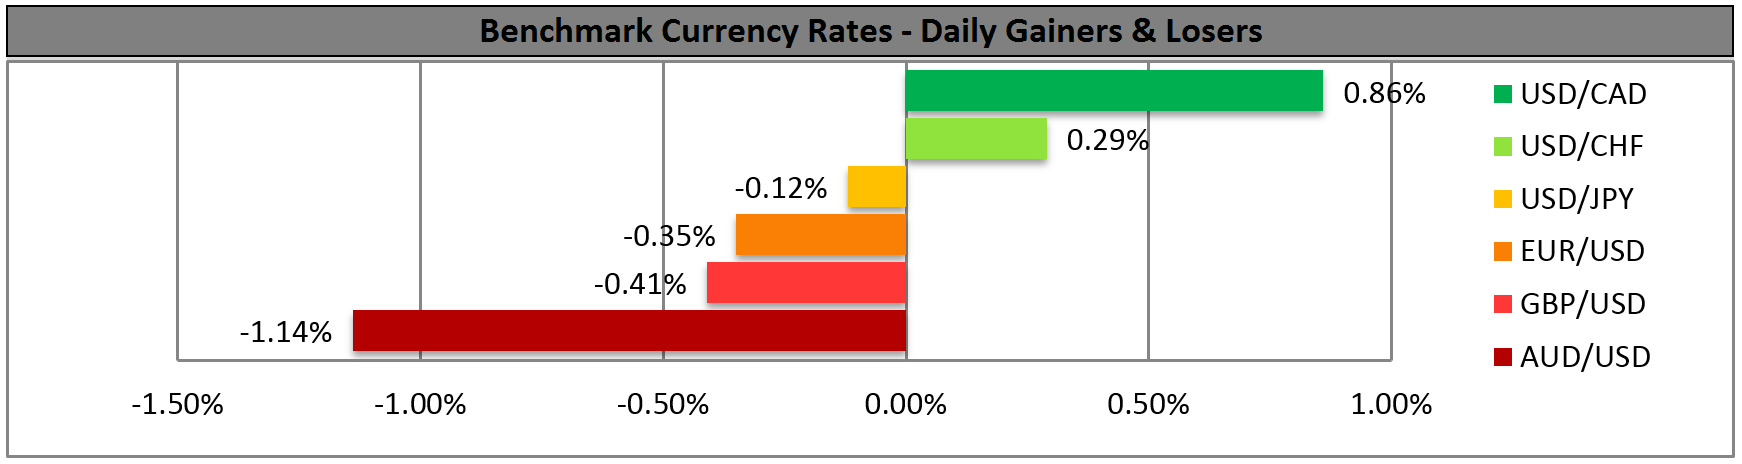
BENCHMARK CURRENCY RATES - DAILY GAINERS AND LOSERS
MARKETS SUMMARY