EUR/USD back above 1.2900
EUR/USD rebounded from 1.2860 (S1) and moved higher to trade back above the 1.2900 line. The RSI exited its oversold field, while the MACD bottomed and moved above its trigger line. I can also identify positive divergence between the RSI and the price action. Bearing in mind our momentum signs, I would be cautious of further upside in the near future, maybe to test the psychological line of 1.3000 (R1) as a resistance this time. Nevertheless, on the daily chart, the price structure remains lower highs and lower lows below both the 50- and the 200-day moving averages, thus I still see a negative overall picture. A clear move below 1.2860 (S1), is likely to trigger extensions towards the key support zone of 1.2760 (S2), defined by the lows of March and July 2013.
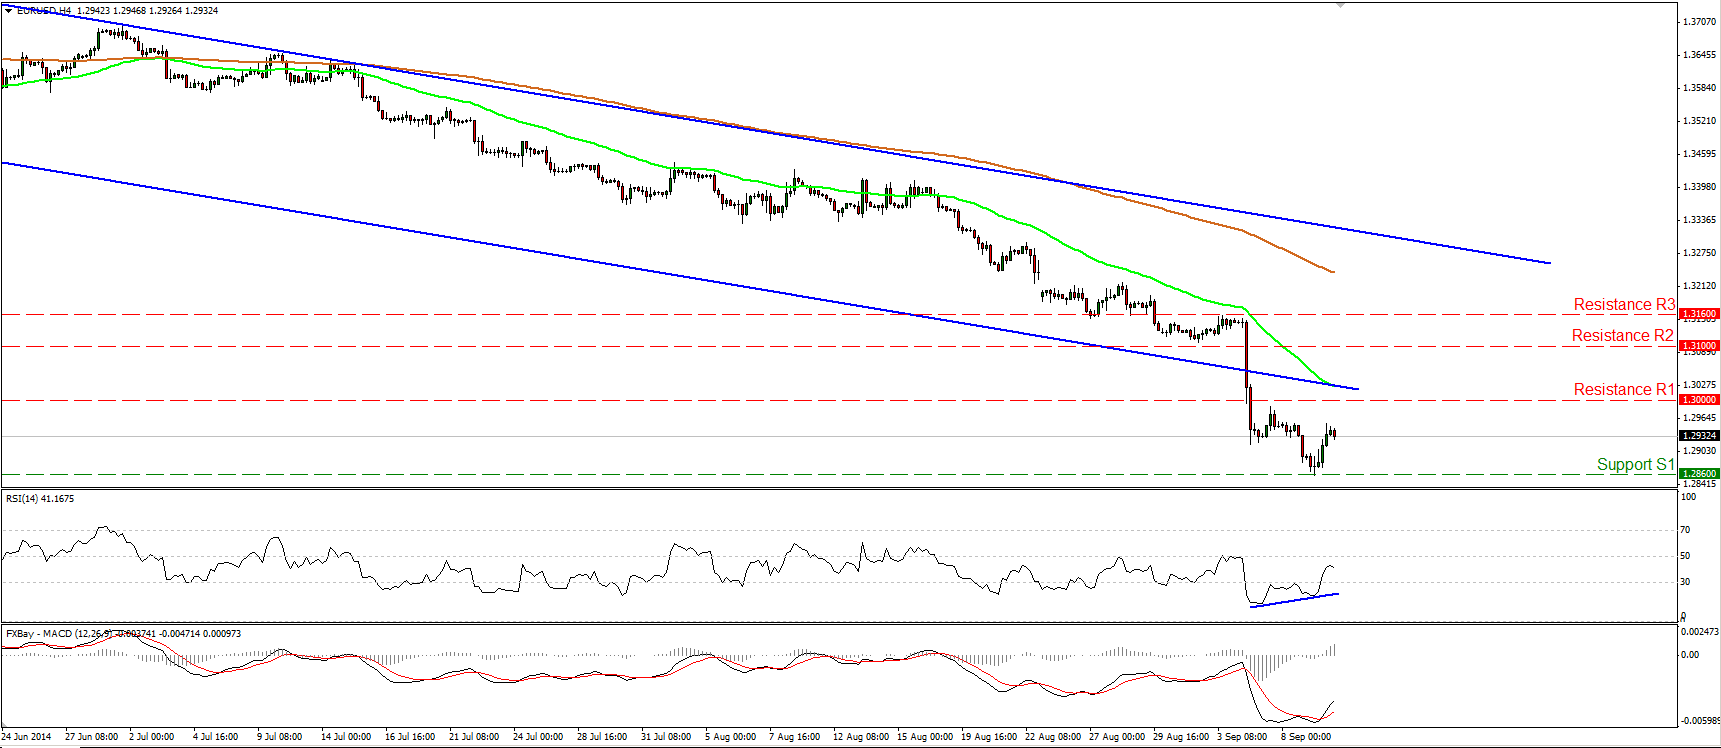
• Support: 1.2860 (S1), 1.2760 (S2), 1.2660 (S3).
• Resistance: 1.3000 (R1), 1.3100 (R2), 1.3160 (R3).
GBP/USD finds support at 1.6070
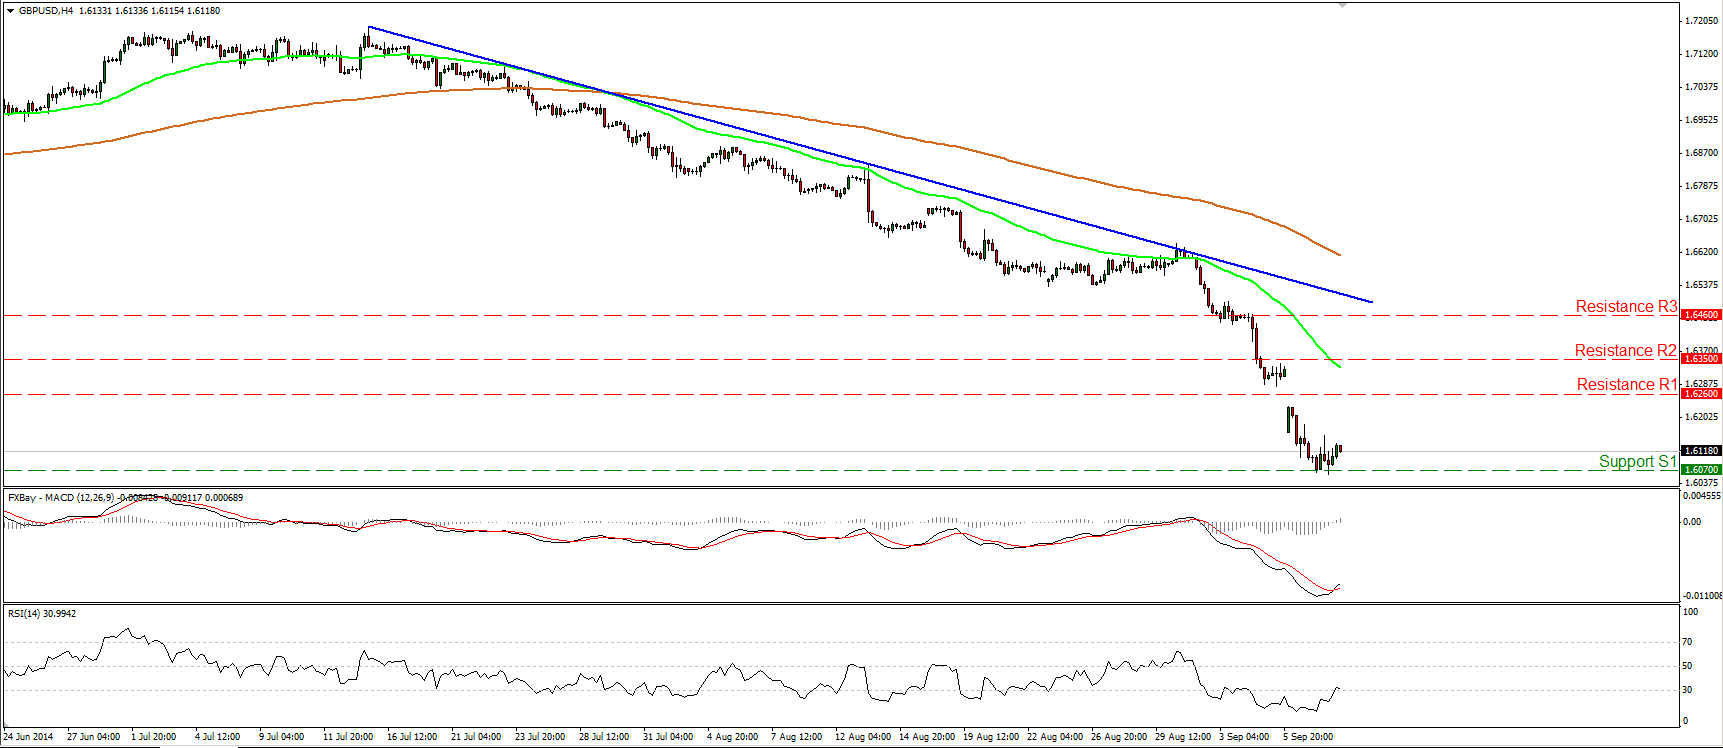
GBP/USD continued declining after Monday’s bearish gap, reaching and falling below 1.6120 (a level mentioned in previous comments). However, the pair found support at 1.6070 (S1) and rebounded to trade back above 1.6120. After an extended period within its oversold field, the RSI moved above its 30 line, while the MACD has bottomed and crossed above its signal line. Taking these indicators into account, I cannot rule out the continuation of the rebound, perhaps to test the 1.6260 (R1) zone as a resistance. Nevertheless, taking a look on the daily chart, I will repeat that since Cable is printing lower lows and lower highs below the 80-day exponential moving average, the overall path remains to the downside and I would expect a possible dip below 1.6070 (S1) to pull the trigger for the psychological zone of 1.6000 (S2). I would see any extensions of yesterday’s rebound as a corrective move before sellers take the reins again.
• Support: 1.6070 (S1), 1.6000 (S2), 1.5870 (S3).
• Resistance: 1.6260 (R1), 1.6350 (R2), 1.6460 (R3).
EUR/JPY recovers and moves back above 1.3700

EUR/JPY started recovering on Monday, and yesterday managed to break above 137.00 (resistance turned into support). At the time of writing, the rate is heading towards the resistance line of 137.65 (R1), where an upside break is likely to pave the way towards the 138.25 (R2) barrier. Shifting our attention to our momentum studies, the RSI lies above 50 and is pointing up, while the MACD, already above its signal line, obtained a positive sign. This confirms the recent positive momentum and magnifies the case that the upside leg is likely to continue. However, although I would expect the positive wave to continue, on the daily chart, the rate is still trading within a downside channel, drawn from back the beginning of April. Thus I see the pair in a retracing mode for now. I will reconsider my analysis if buyers are strong enough to exit the channel.
• Support: 137.00 (S1), 136.65 (S2), 136.30 (S3).
• Resistance: 137.65 (R1), 138.25 (R2), 138.45 (R3).
Gold rebounds from slightly below 1250
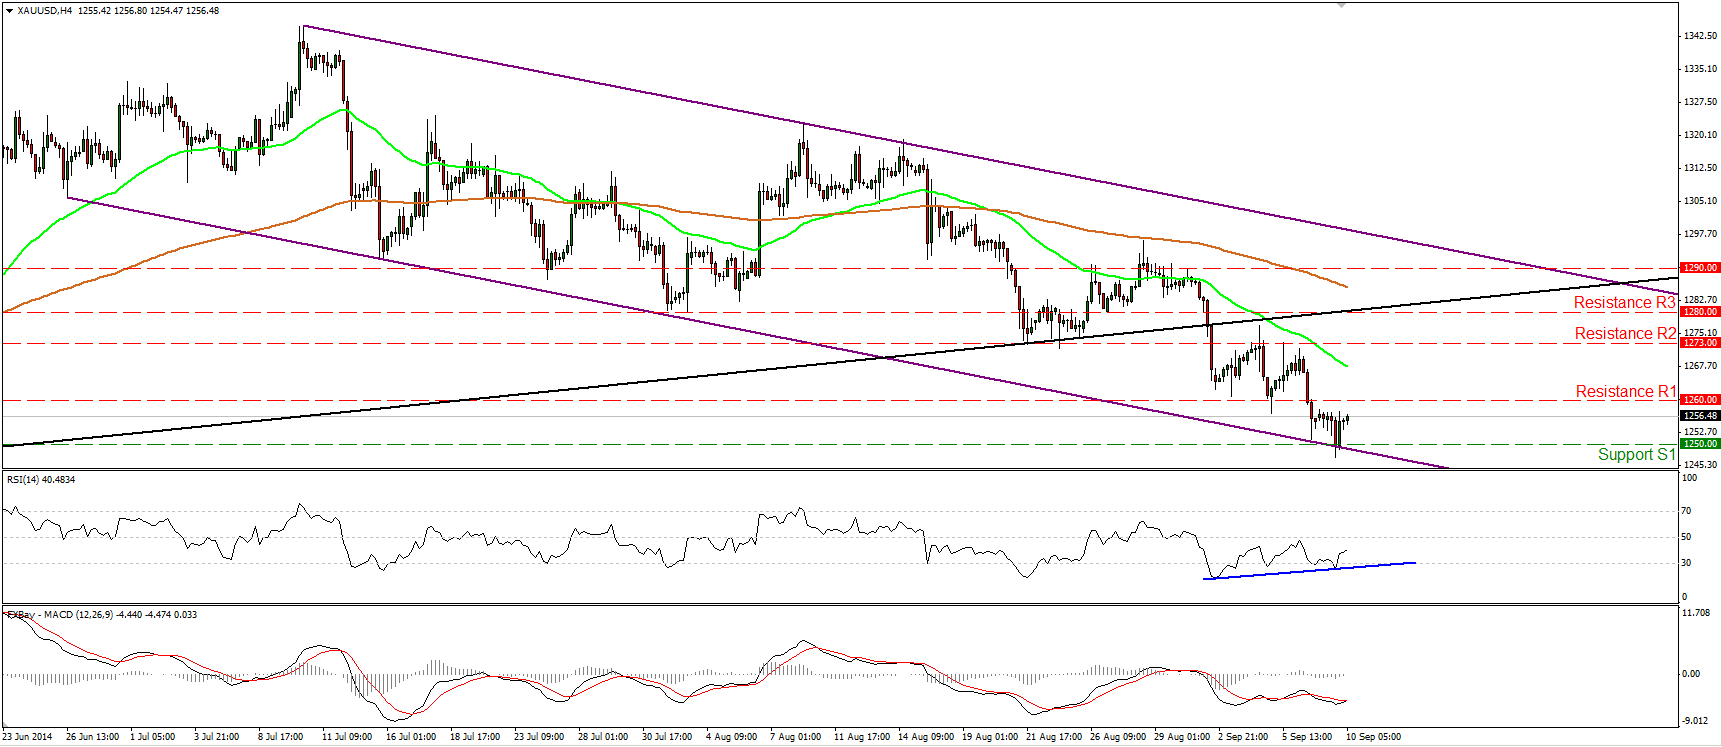
Gold declined somewhat yesterday, triggering some buy orders marginally below our support line of 1250 (S1) and the lower boundary of the purple downside channel. During the early European morning Wednesday, the precious metal is trading back slightly below the resistance line of 1260 (R1). Given the minor rebound near the lower line of the channel and the fact that I see positive divergence between the RSI and the price action, I would be cautious of a possible upside corrective move in the near future. Nevertheless, as long as the metal is trading within the aforementioned downside channel and below the black line drawn from back at the low of the 30th of December, I consider the overall path to be to the downside.
• Support: 1250 (S1), 1240 (S2), 1230 (S3).
• Resistance: 1260 (R1), 1273 (R2), 1280 (R3).
WTI in a consolidative mode
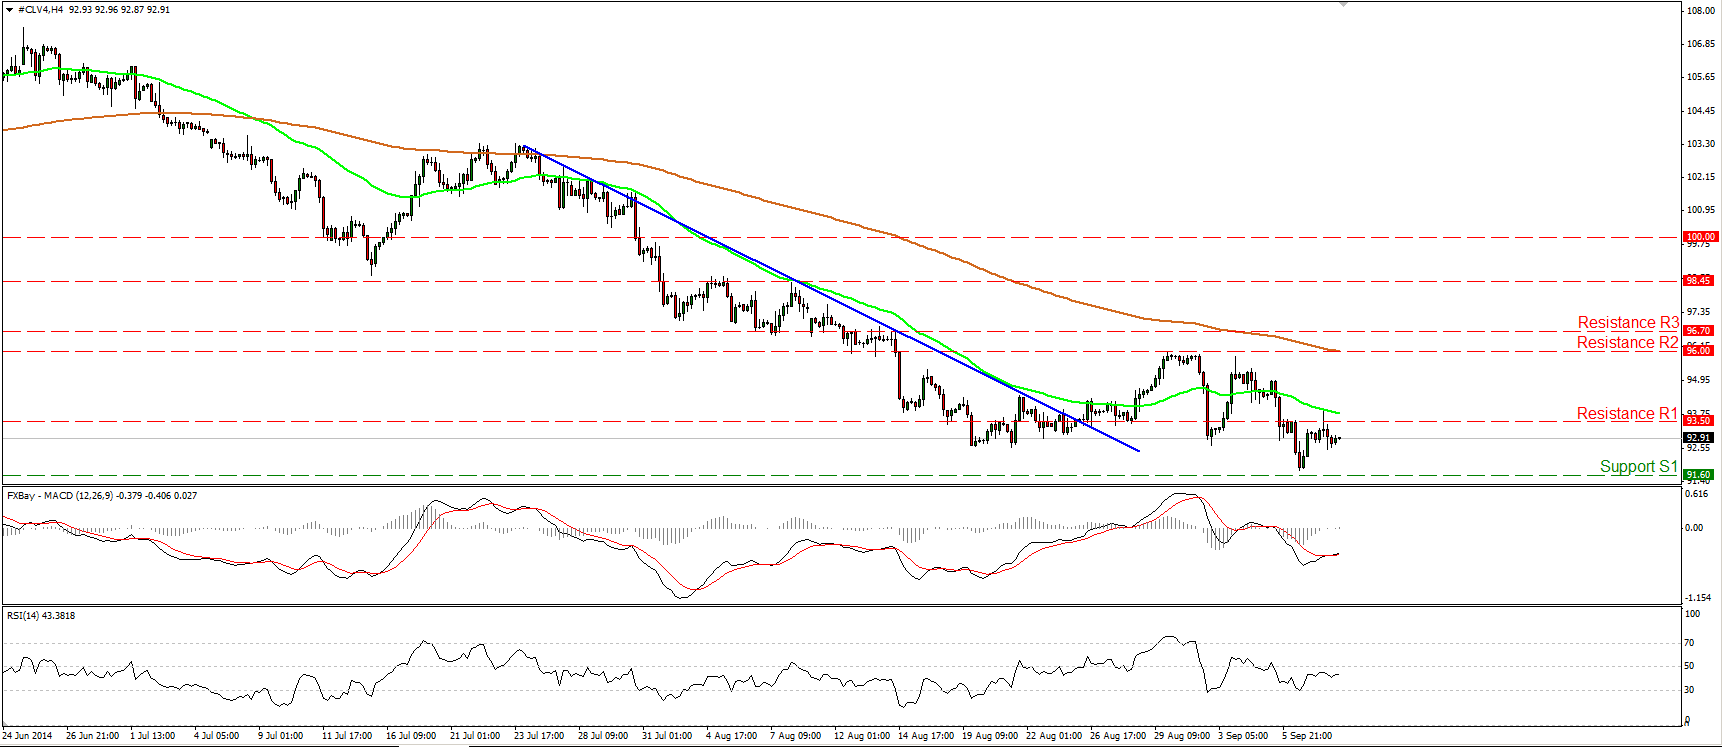
WTI moved in a consolidative mode yesterday, remaining slightly below our resistance line of 93.50 (R1). I still see a mildly negative outlook, but I believe that a decisive downside violation of 91.60 (S1) is the move that could carry larger bearish extensions. Such a break is likely to open the way for the psychological line of 90.00 (S2). On the daily chart, the price structure remains lower peaks and lower troughs below both the 50- and the 200- day moving averages, but I see positive divergence between the RSI and the price action, while the MACD remains above its trigger line. This supports my view to wait for a clear move below 91.60 (S1) before getting more confident on the downside.
• Support: 91.60 (S1), 90.00 (S2), 87.75 (S3).
• Resistance: 93.50 (R1), 96.00 (R2), 96.70 (R3) .
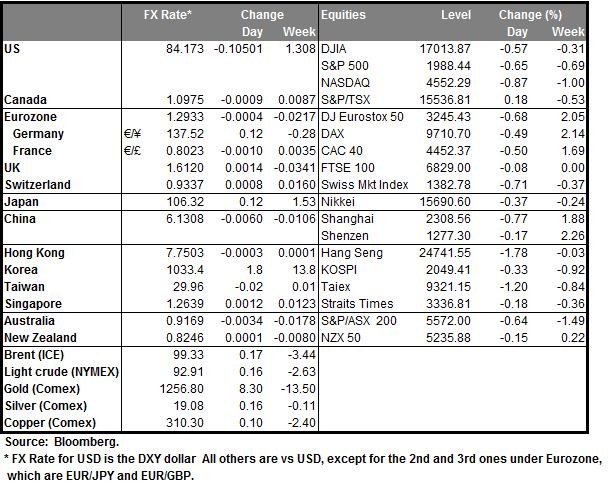
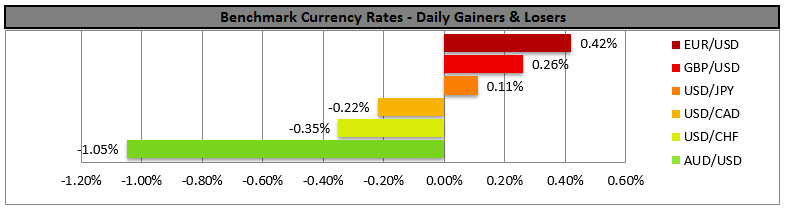
BENCHMARK CURRENCY RATES - DAILY GAINERS AND LOSERS
MARKETS SUMMARY