EUR/USD dips below 1.2900
EUR/USD tumbled on Monday, breaking below the 1.2900 line (support turned into resistance). As I mentioned in previous comments, I would expect such a dip to set the stage for larger bearish extensions and to pave the way for the next key support zone of 1.2760 (S1), defined by the lows of March and July 2013. Looking on our momentum studies, the RSI, already within its oversold field, found resistance at its 30 line and moved lower, while the MACD, despite signs of bottoming, remained below its trigger line and turned down. This designates strong bearish momentum and amplifies the case for further declines. In the bigger picture, the pair is still forming lower highs and lower lows below both the 50- and the 200-day moving averages, thus the overall path of the rate remains to the downside.

• Support: 1.2760 (S1), 1.2660 (S2), 1.2500 (S3).
• Resistance: 1.2900 (R1), 1.3000 (R2), 1.3100 (R3).
GBP/JPY rebounds from near the 200-day EMA
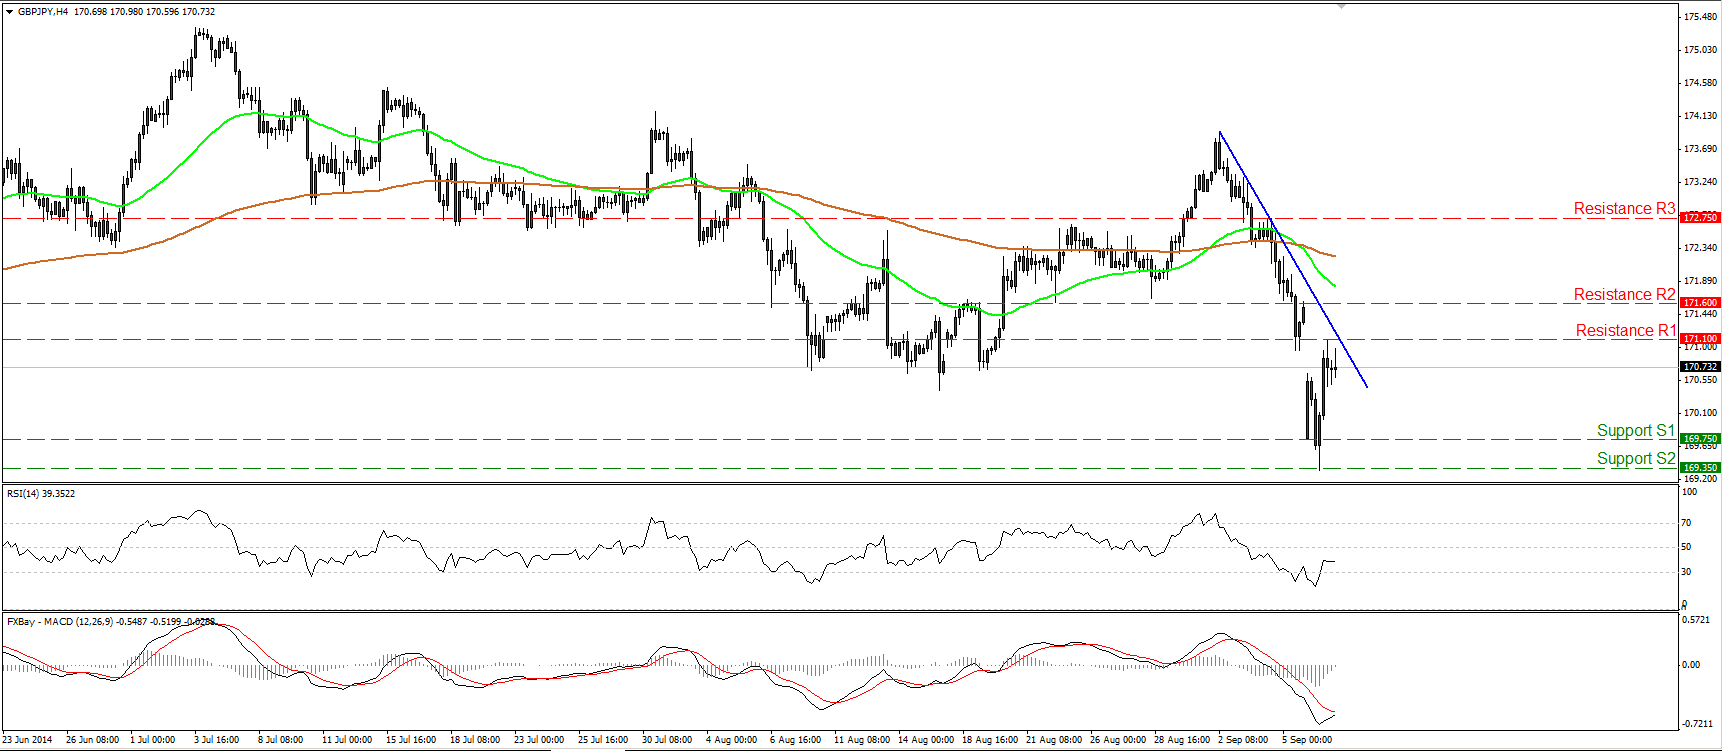
GBP/JPY fell sharply after forming a shooting star candlestick on the 2nd of September (see daily chart). However, yesterday, the pair found support at 169.35 (S2), near the 200-day moving average and rebounded strongly. As long as the rate is trading below the blue near-term downtrend line, I still see a cautiously negative picture, but I would wait for a dip below the 200-day moving average to carry larger bearish implications. The pair has been trading above that moving average since October 2012, thus I would expect a possible dip below it in the future to be critical.
• Support: 169.75 (S1), 169.35 (S2), 168.60 (S3).
• Resistance: 171.10 (R1), 171.60 (R2), 172.75 (R3).
AUD/USD plunges but still within a range
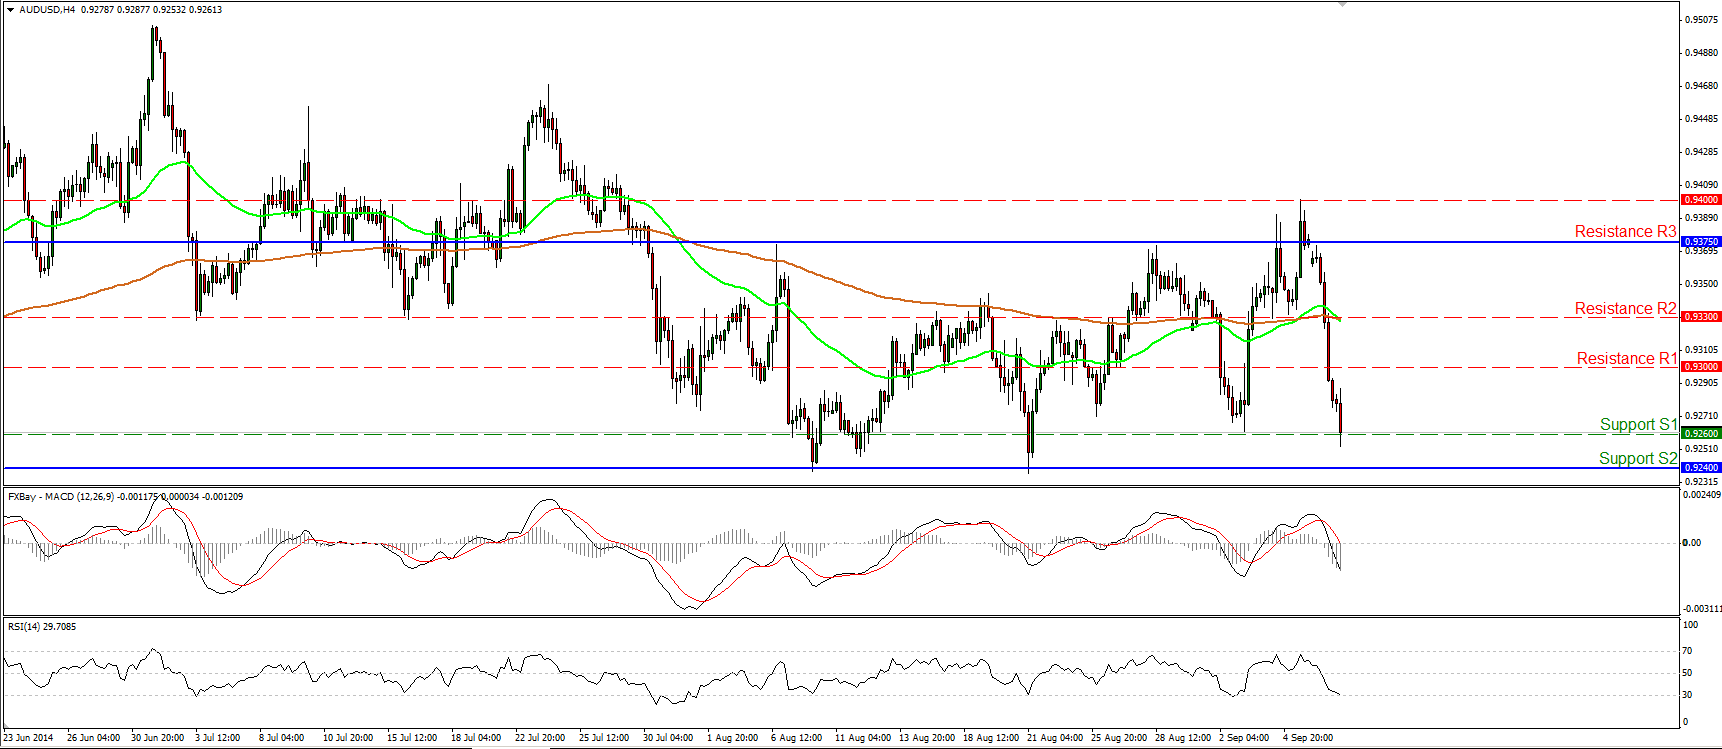
AUD/USD plunged yesterday, violating two support lines (turned into resistance) in a row. However, the fall was halted by 0.9260 (S1), where a break is likely to see support at 0.9240 (S2). Taking a look at the broader picture, the pair is still trading within a sideways path, between the support zone of 0.9240 (S2) and the resistance of 0.9375 (R3). As a result, I would expect a clear and decisive close below 0.9240 (S2) to signal the downside exit of the range. Such a move is likely to challenge the key line of 0.9200 (S3). The 50-and the 200-day moving averages are pointing sideways, confirming the trendless mode of the currency pair.
• Support: 0.9260 (S1), 0.9240 (S2), 0.9200 (S3).
• Resistance: 0.9300 (R1), 0.9330 (R2), 0.9375 (R3).
Gold falls below 1260

Gold declined yesterday, after finding resistance slightly below the 1273 (R2) line. The precious metal violated the 1260 barrier (support turned into resistance), but the decline was halted one dollar above our next support of 1250 (S1), near the lower boundary of the purple downside channel. Given our proximity to the lower line of the channel, I would be cautious of a possible upside corrective move in the near future. Nevertheless, as long as the metal is trading within the aforementioned downside channel and below the black line drawn from back at the low of the 30th of December, I consider the overall path to be to the downside.
• Support: 1250 (S1), 1240 (S2), 1230 (S3).
• Resistance: 1260 (R1), 1273 (R2), 1280 (R3).
WTI find support slightly above 91.60
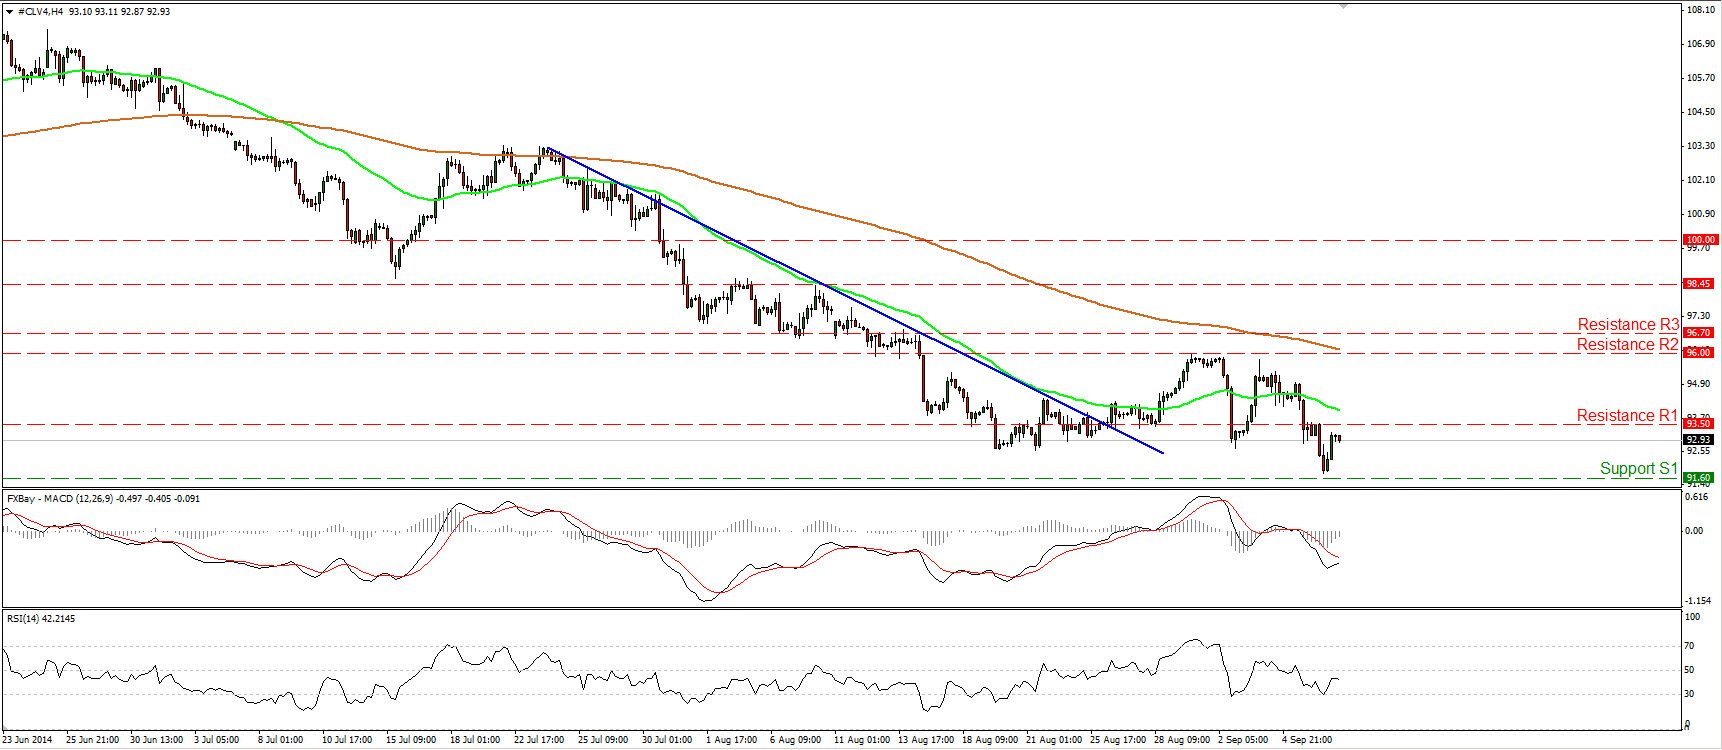
WTI continued declining yesterday, but it rebounded somewhat after finding support marginally above our barrier of 91.60 (S1). Yesterday’s move confirmed a lower low and turned the outlook mildly to the downside. Nevertheless, I believe that a decisive downside violation of 91.60 (S1) is the move that could carry larger bearish extensions. Such a break is likely to open the way for the psychological line of 90.00 (S2). On the daily chart, the price structure remains lower peaks and lower troughs below both the 50- and the 200- day moving averages, but I see positive divergence between the RSI and the price action, while the MACD remains above its trigger line. This supports my view to wait for a clear move below 91.60 (S1) before getting more confident on the downside.
• Support: 91.60 (S1), 90.00 (S2), 87.75 (S3).
• Resistance: 93.50 (R1), 96.00 (R2), 96.70 (R3) .
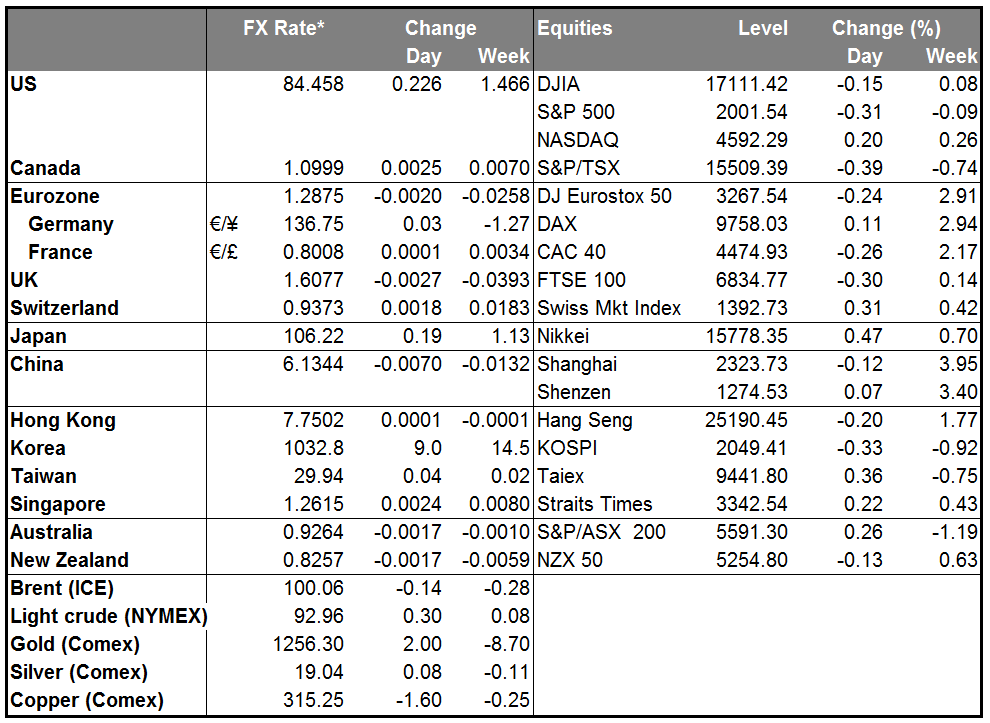
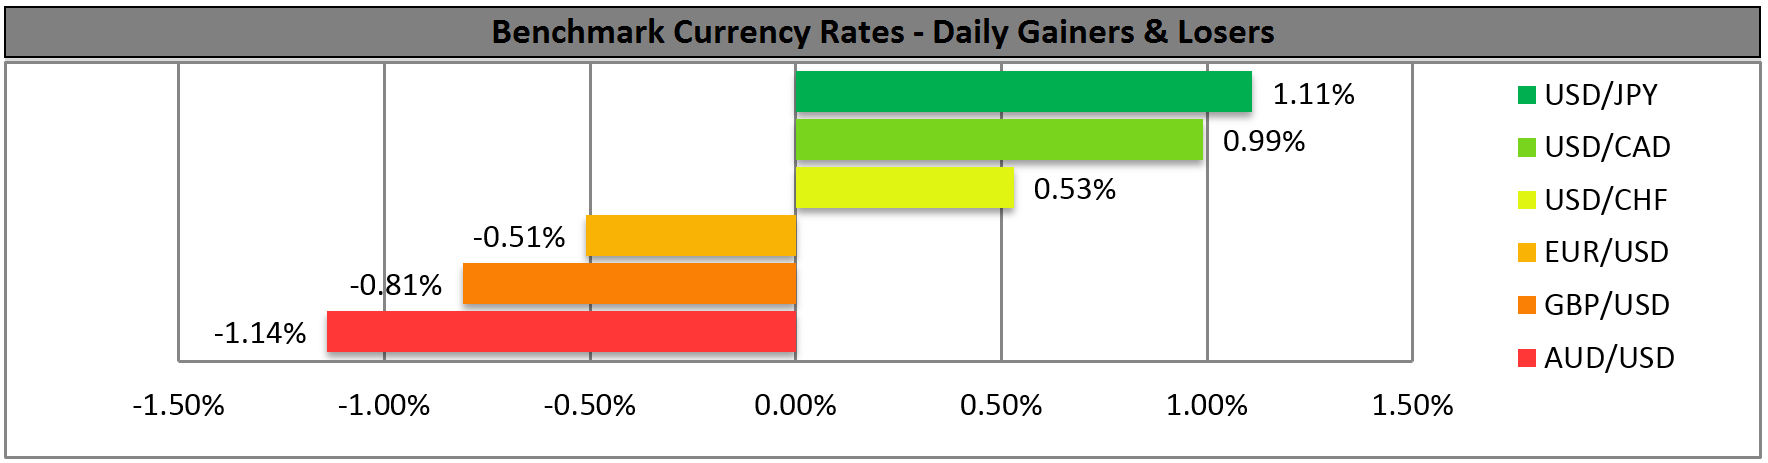
BENCHMARK CURRENCY RATES - DAILY GAINERS AND LOSERS
MARKETS SUMMARY