EUR/USD rebounds from 1.2500
EUR/USD pushed higher on Monday after finding strong support at the psychological line of 1.2500 (S1) as the greenback paused after Friday’s strong rally. The pair found some buy orders near a psychological zone, plus I see positive divergence between the price action and both our short-term momentum indicators. I therefore switch my short-term view to neutral for now. Moreover, the RSI moved above its 50-line while the MACD, although negative, crossed above its trigger line, giving me more reasons to stand aside and wait. However, on the daily chart, the price structure remains lower peaks and lower troughs below both the 50- and the 200-day moving averages, thus I will retain the view that the overall path remains to the downside and I will treat the recent advance or any extensions of it as a corrective phase before the bears prevail again.
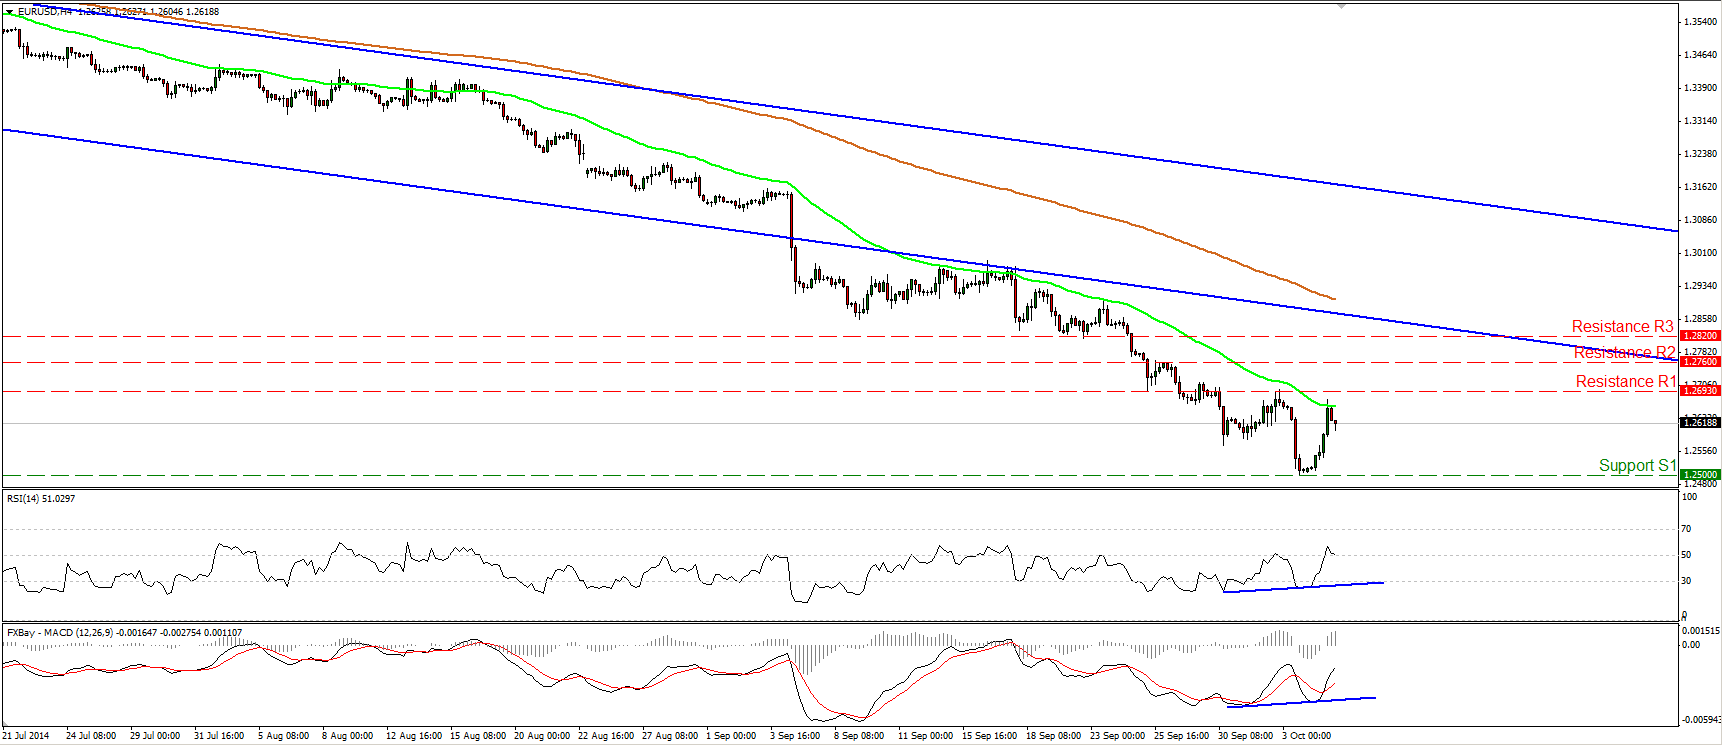
• Support: 1.2500 (S1), 1.2465 (S2), 1.2385 (S3)
• Resistance: 1.2693 (R1), 1.2760 (R2), 1.2820 (R3)
GBP/JPY remains supported by the 174.50 zone
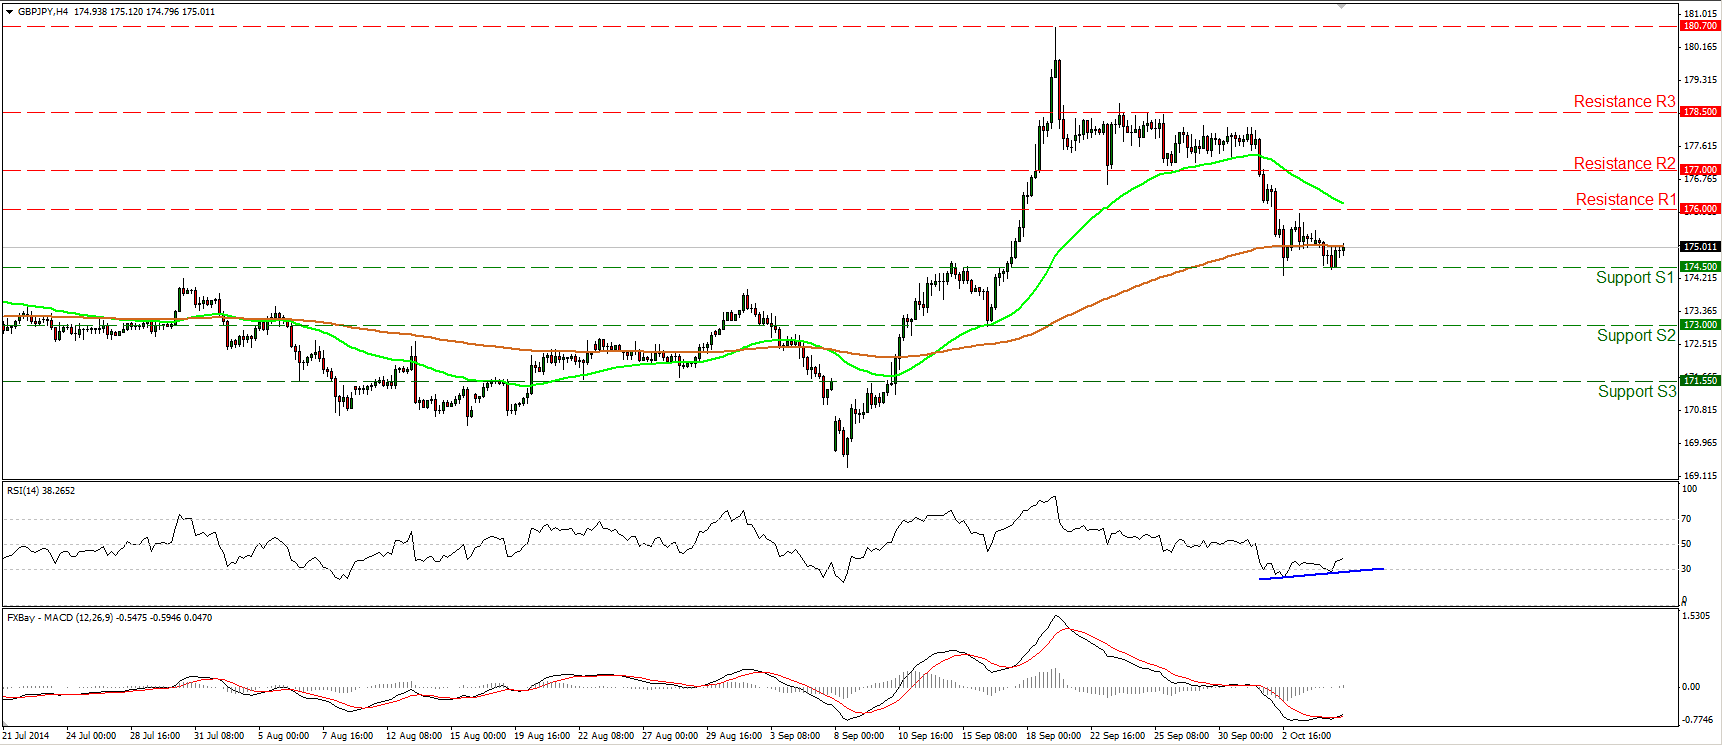
GBP/JPY moved sideways on Monday, remaining supported by the 174.50 (S1) area. With that in mind and given that our momentum studies support a possible rebound, I would take to the sidelines at the moment. The RSI rebounded from near its 30 line and is pointing somewhat up, while the MACD, although negative, moved above its trigger. I also see positive divergence between the RSI and the price action. In the bigger picture, the rate remains above the upper bound of the broadening formation, completed on the 11th of September, and above both the 50- and the 200-day moving averages. Thus, I will consider the overall outlook to be cautiously to the upside and I will see the 19th Sep. - 6th Oct. down wave as corrective move.
• Support: 174.50 (S1), 173.00 (S2), 171.55 (S3)
• Resistance: 176.00 (R1), 177.00 (R2), 178.50 (R3)
AUD/USD
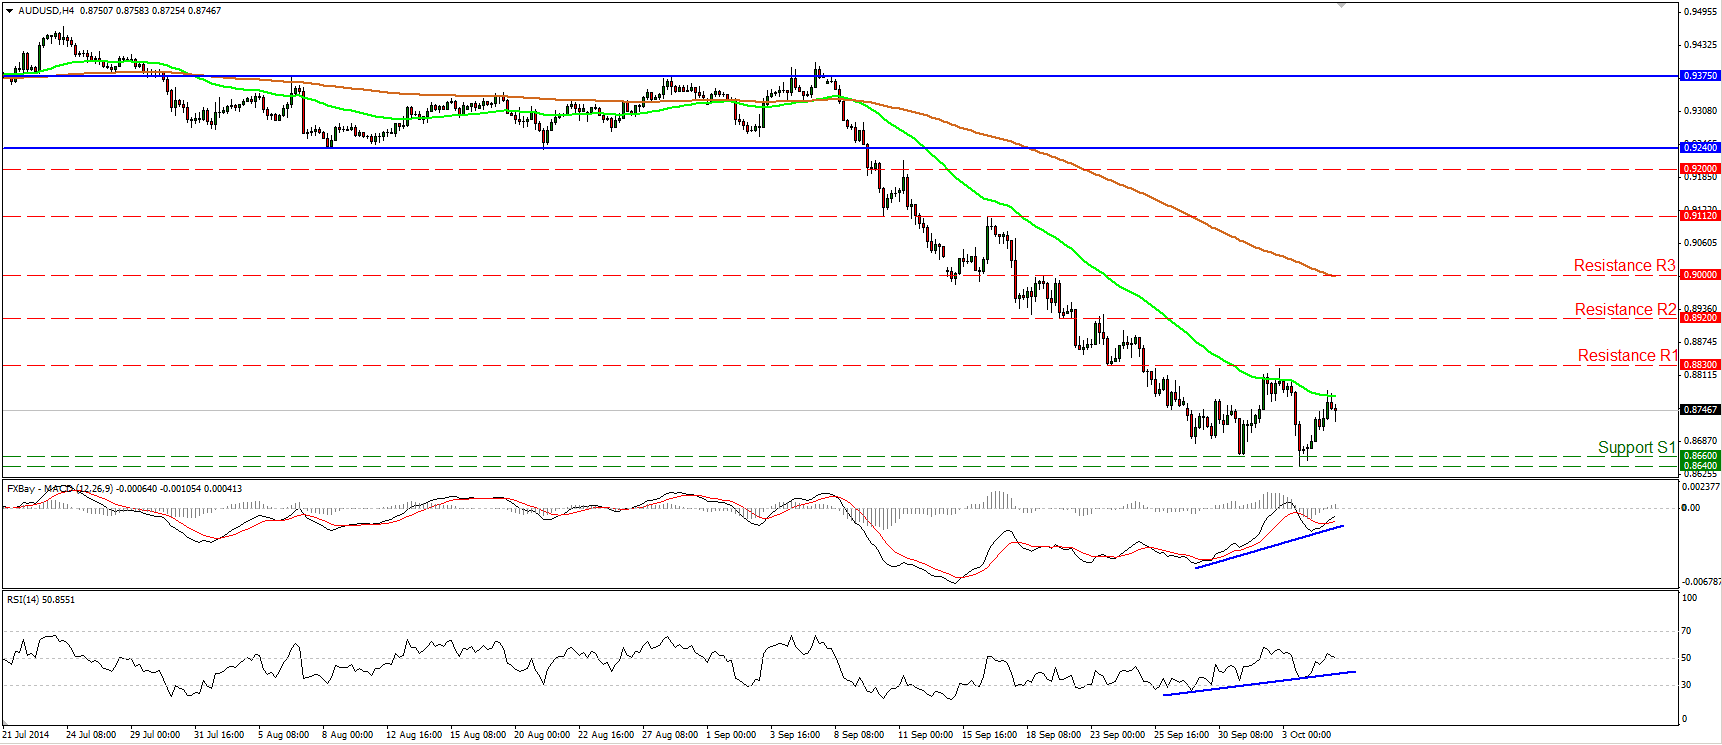
AUD/USD edged higher on Monday after finding support at the 0.8640/60 zone. Today’s RBA policy meeting was not a game changer and the pair remained between that support zone and the resistance of 0.8830 (R1). Given that when the pair rebounded strongly when it reached the 0.8640/60 area back in January and reversed its course, and also given the fact that I still see positive divergence between the pair and our oscillators, I feel there are enough reasons to keep my flat stance as far as the short-term horizon is concerned. In the bigger picture, the overall trend remains to the downside in my view, but I would prefer to wait for a dip below the 0.8640 (S2) line before trusting the down path again. If and when the pair does move lower, I would expect sellers to initially target our next support obstacle at 0.8565 (S3).
• Support: 0.8660 (S1), 0.8640 (S2), 0.8565 (S3)
• Resistance: 0.8830 (R1), 0.8920 (R2), 0.9000 (R3)
Gold find buy orders at 1183
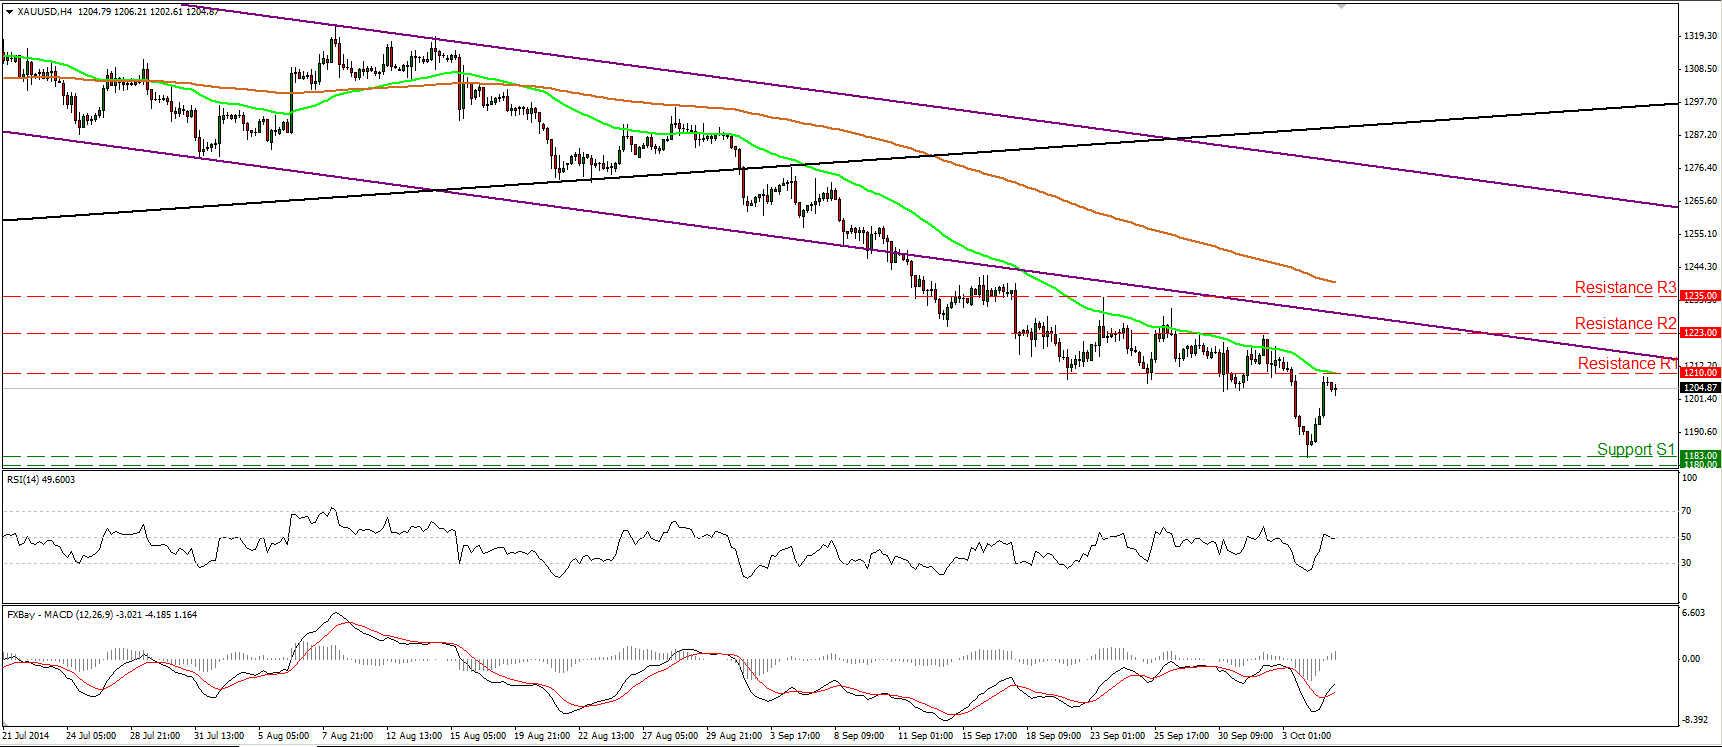
Gold triggered some buy orders at the 1183 (S1) support and rebounded to find resistance marginally below the 1210 (R1) line. On the daily chart the price structure still suggests a downtrend. The last time we saw the metal trading below 1180 (S2), the low of the 28th of June 2013, was back in August 2010. In June and December 2013, when the bears reached the 1180/83 area, the metal rebounded strongly and reversed its course. Bearing that rebound in mind, I would maintain my “wait and see stance”. I believe that only a decisive move below 1180 (S2) would signal the continuation of the down path. In that case, I would expect extensions towards 1156 (S3), the low of the 27th of July 2010. On the upside, the absent of any bullish reversal signs makes it premature to envision any uptrend scenarios, in my view.
• Support: 1183 (S1), 1180 (S2), 1156 (S3)
• Resistance: 1210 (R1), 1223 (R2), 1235 (R3)
WTI slightly above 90.00
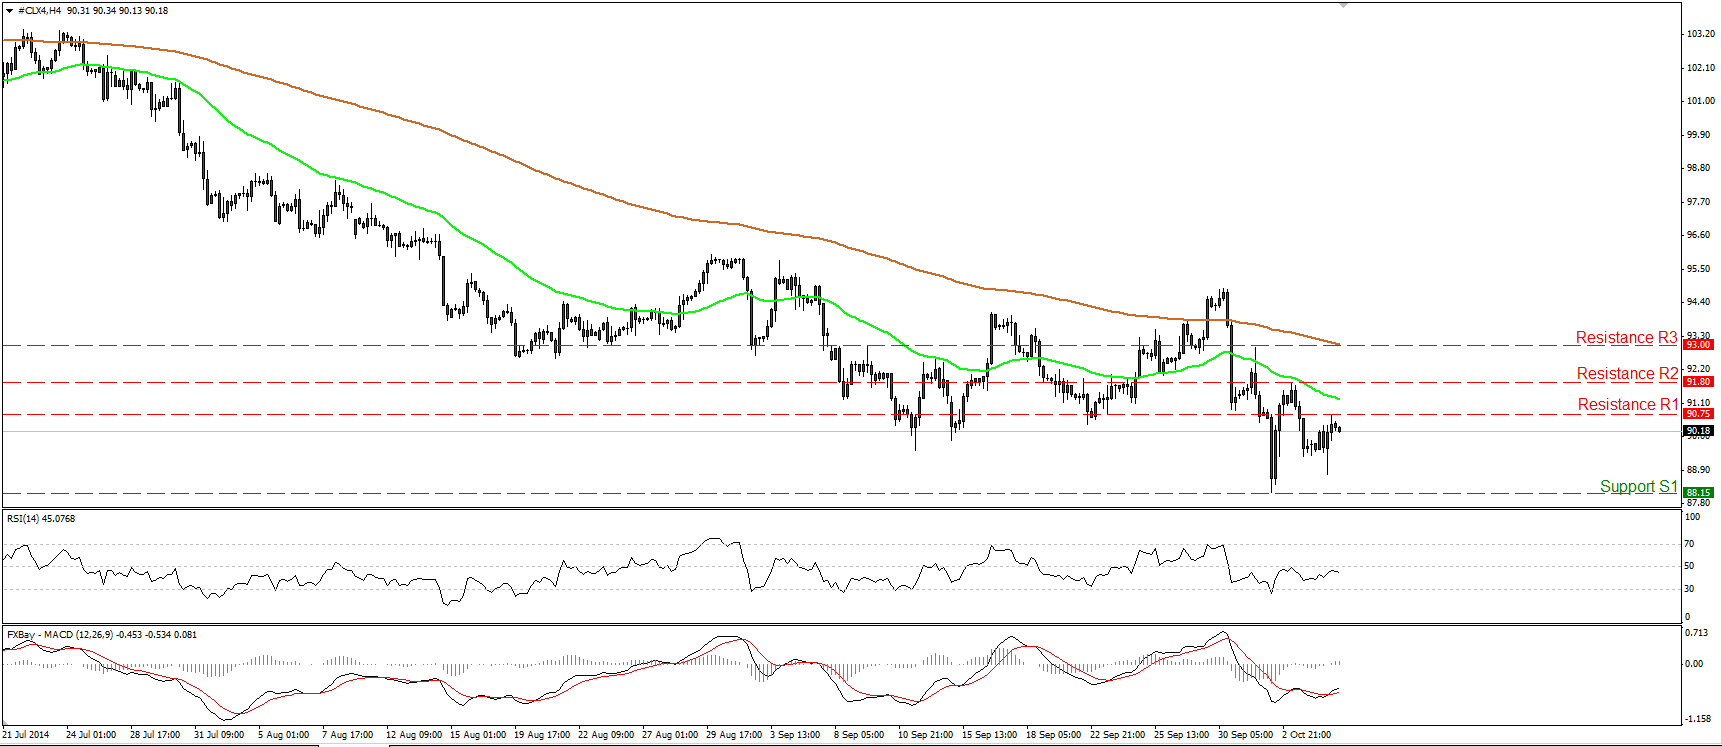
WTI moved marginally higher on Monday, crossing back above 90.00 but finding resistance at 90.75 (R1). The possibility for a lower high near that area still exists, thus I see a cautiously negative overall picture and I still see a likelihood for another test near Thursday’s low of 88.15 (S1). However, only a dip below that line would confirm a forthcoming lower low on the daily chart and signal the continuation of the longer-term downtrend. Such a move could see scope for further declines, perhaps towards our next support at 86.00 (S2). Both of our daily momentum studies indicate bearish momentum. The RSI remains below 50, while the MACD, already negative, moved below its signal line.
• Support: 88.15 (S1), 86.00 (S2), 84.15 (S3)
• Resistance: 90.00 (R1), 91.80 (R2), 93.00 (R3)
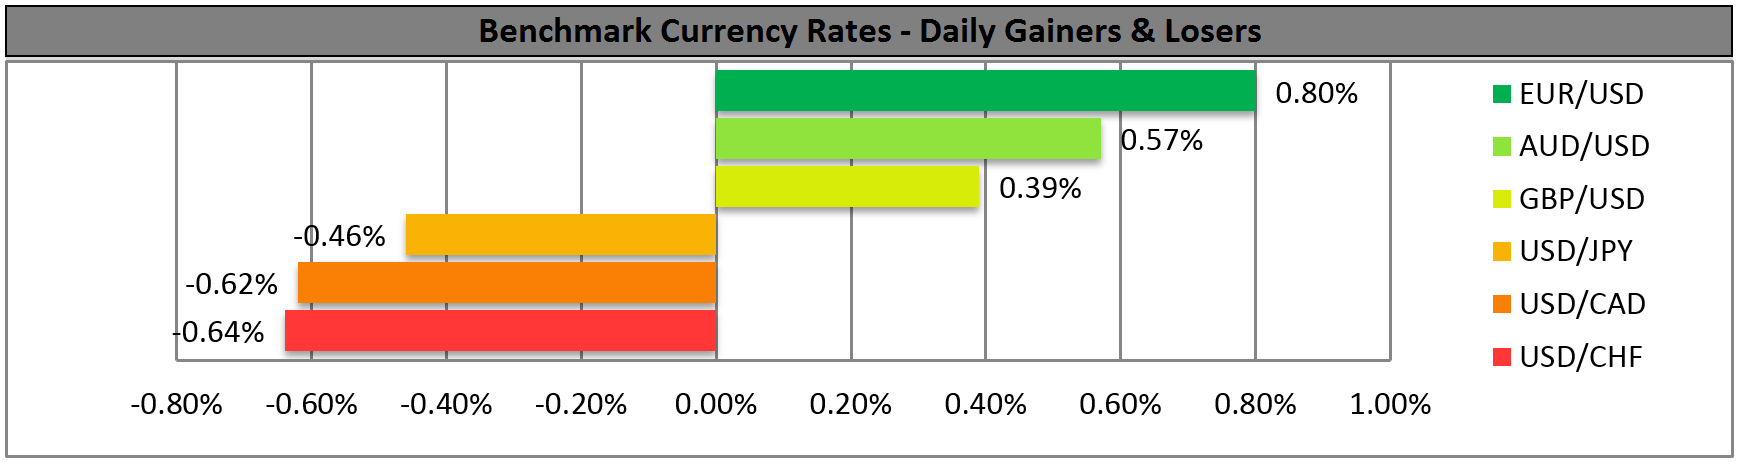
BENCHMARK CURRENCY RATES - DAILY GAINERS AND LOSERS
MARKETS SUMMARY