EUR/USD touches 1.2500
EUR/USD plunged on Friday on the strong US nonfarm payrolls data. The data caused the rate to dip below the support-turned-into-resistance line of 1.2570, defined by the low of the 30th of September, and to touch the psychological barrier of 1.2500 (S1). On the daily chart, as long as the price structure remains lower peaks and lower troughs below both the 50- and the 200-day moving averages I will maintain the view that the overall path remains to the downside. I see the next support at 1.2465 (S2), the low of the 28th of August 2012. In my view, a clear move below that hurdle could see scope for extensions towards the resistance-turned-into-support bar of 1.2385 (S3), the high of the 17th of August 2012. Looking at our daily momentum studies, the RSI remains within its oversold territory, while the MACD lies below both its zero and signal lines. This designates accelerating downside momentum and increases the possibilities for further bearish waves.
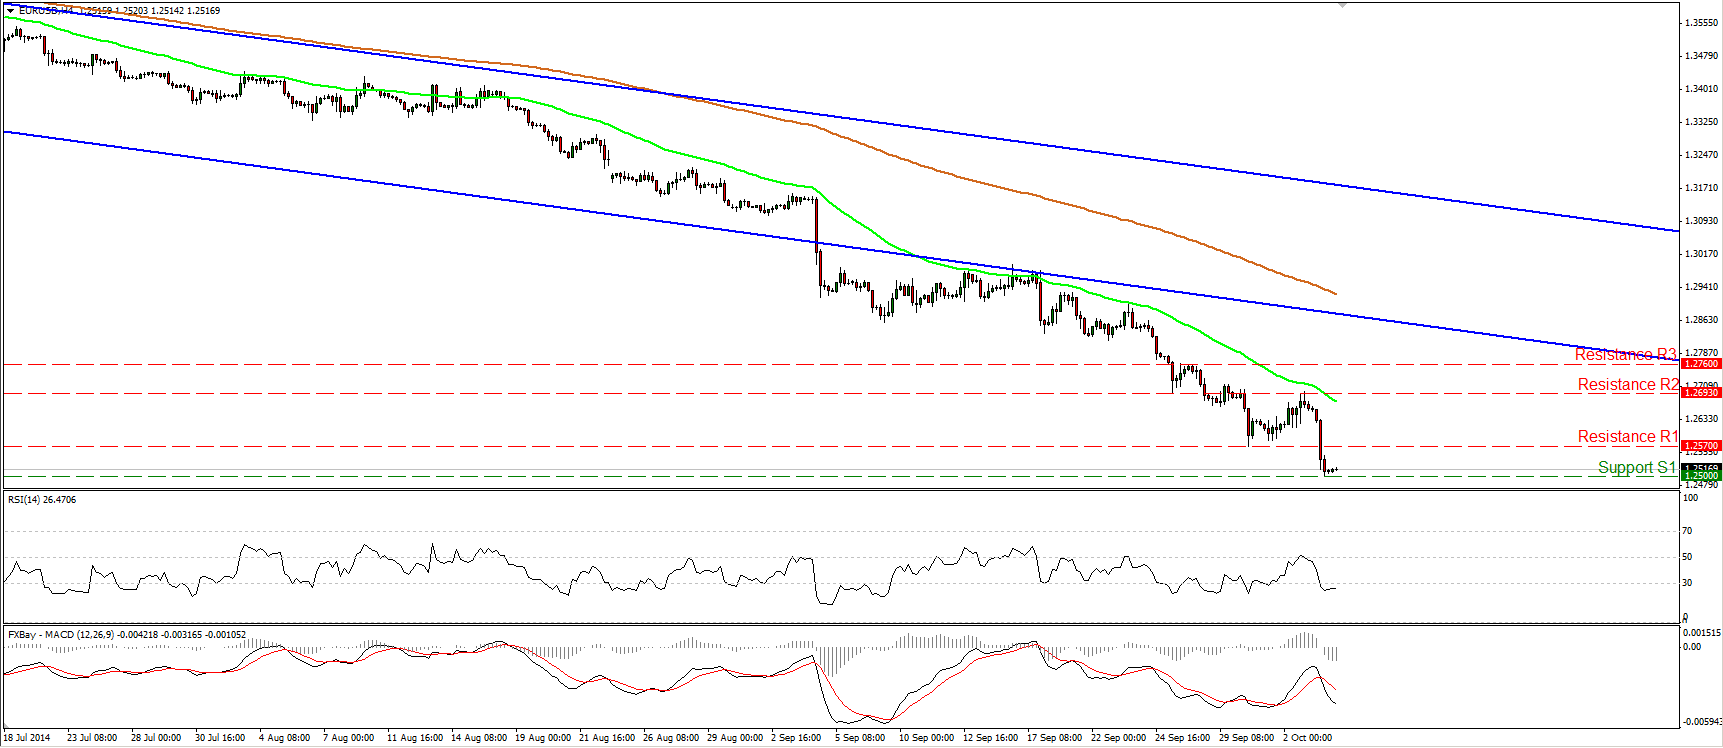
• Support: 1.2500 (S1), 1.2465 (S2), 1.2385 (S3)
• Resistance: 1.2570 (R1), 1.2693 (R2), 1.2760 (R3)
GBP/USD below 1.6000 for the first time since November

GBP/USD accelerated its declines after the strong NFP print to trade below the psychological zone of 1.6000 for the first time since November 2013. The 1.6000 line also coincides with the 50% retracement level of the prior longer-term uptrend, from the 9th of July 2013 until the 15th of July 2014. I believe that this makes Friday’s dip even more significant and keeps the bias to the downside. I would now expect the rate to challenge our support obstacle of 1.5860 (S1) in the near future, marked by the low f the 12th of November 2013. Nevertheless, bearing in mind that on the 4-hour chart the RSI shows signs of bottoming within its oversold field, I would be mindful of a near-term bounce before the next leg down. Zooming out on the daily chart, I will stick to the view that as long as Cable remains below the 80-day exponential moving average, the overall trend is to the downside.
• Support: 1.5860 (S1), 1.5720 (S2), 1.5565 (S3)
• Resistance: 1.6000 (R1), 1.6060 (R2), 1.6160 (R3)
USD/JPY rebounds from 108.00

USD/JPY surged after finding support at the point of intersection between the blue uptrend line and the key line of 108.00 (S1), which happens to lie fractionally below the 23.6% retracement level of the 8th of August – 1st of October up move. During the early European morning Monday, the pair is trading slightly below the psychological line of 110.00 (R1). A decisive break could pull the trigger for our next resistance at 110.70 (R2), the highs of August 2008. On the daily chart, after the exit of a triangle formation, the price structure keeps suggesting an uptrend. Nevertheless, I would prefer to wait for the move above key obstacle of 110.00 (R1) before getting more confident on the upside. Such a move would confirm a forthcoming higher high and signal the continuation of the trend.
• Support: 109.00 (S1), 108.00 (S2), 107.40 (S3)
• Resistance: 110.00 (R1), 110.70 (R2), 111.00 (R3)
Gold dips below 1200 and touches 1183
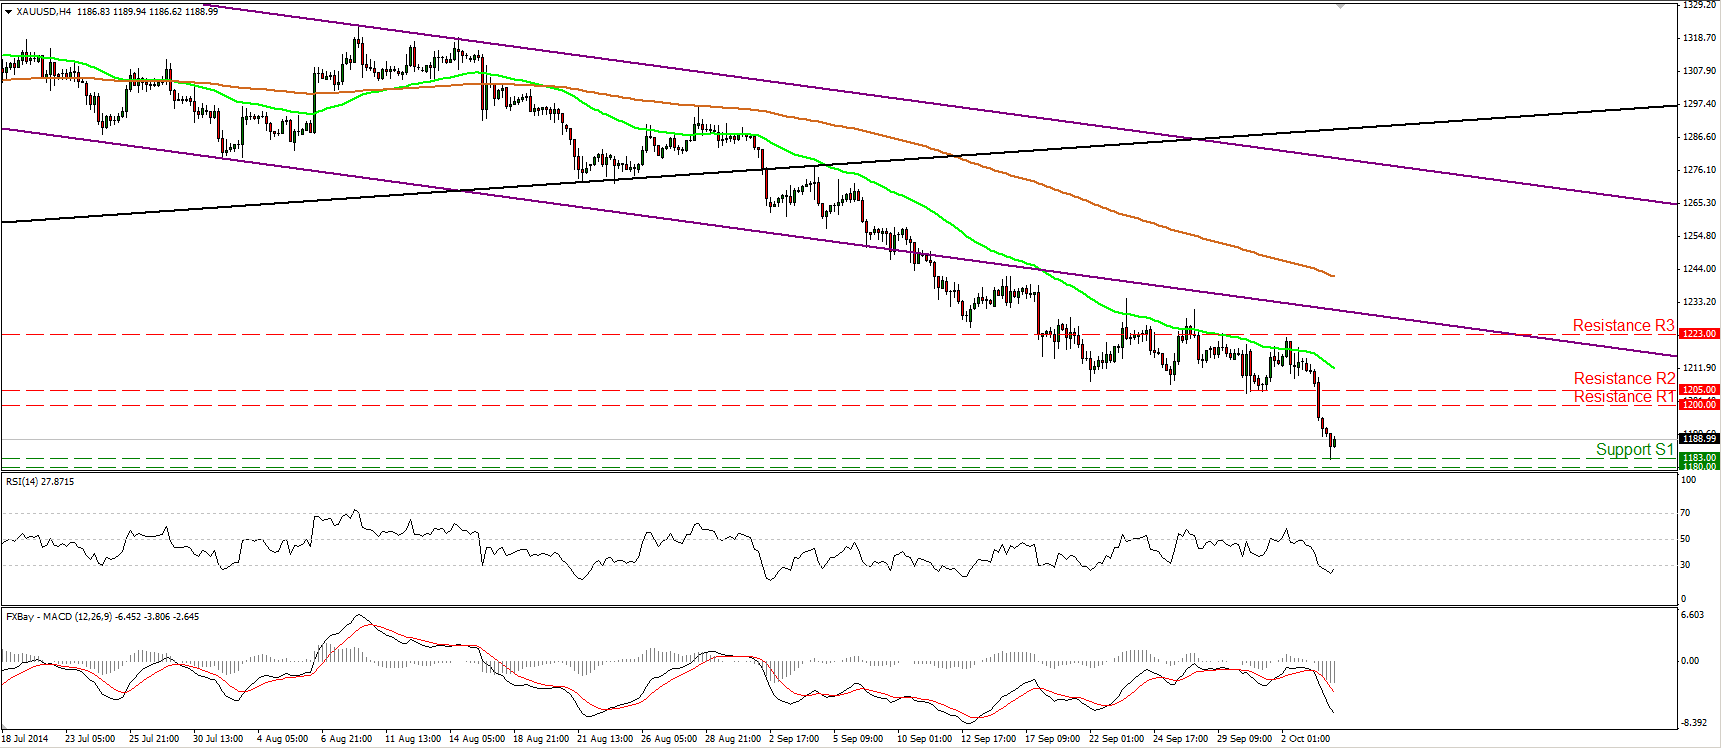
Gold also suffered after the strong US employment data and fell below the critical barrier of 1200. The dip below that psychological line caused larger bearish extensions and during the Asian morning Monday, the metal found support at 1183 (S1), a support level determined by the low of the 31st of December 2013. Although on the daily chart the price structure still suggests a downtrend, given our proximity to the aforementioned barrier and the line of 1180 (S2), the low of the 28th of June 2013, I would prefer to adopt a “wait and see” stance. The last time we saw the metal trading below these levels was back in August 2010, while in June and December 2013, when the bears reached these lines, the metal rebounded strongly reversing its course. In the case of a move below 1180 (S2), I would expect extensions towards 1156 (S3), the low of the 27th of July 2010.
• Support: 1183 (S1), 1180 (S2), 1156 (S3)
• Resistance: 1200 (R1), 1205 (R2), 1223 (R3)
WTI finds support at 92.00
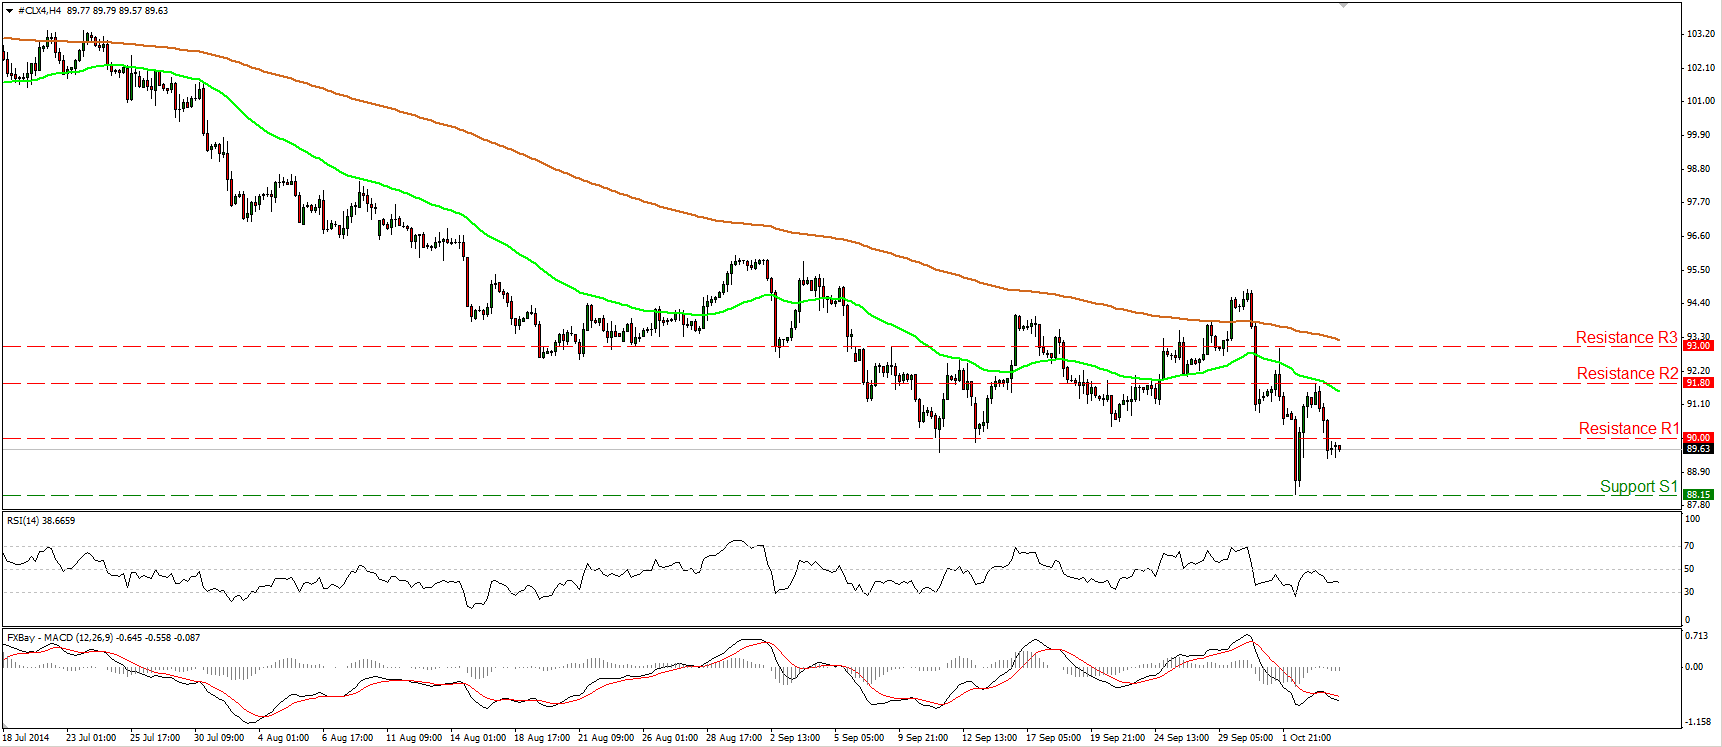
WTI found resistance at 91.80 (R2) forming a lower high, and fell again back below 90.00. If the bears are willing to maintain the rate below 90.00 (R1), I would expect them to challenge again Thursday’s low of 88.15 (S1). However, only a dip below that line would confirm a forthcoming lower low on the daily chart and signal the continuation of the longer-term downtrend. Such a move could see scope for further declines, perhaps towards our next support at 86.00 (S2). Taking a look at our daily momentum studies we see that both of them confirm the recent bearish momentum. The RSI lies below 50, while the MACD, already negative, moved below its signal line.
• Support: 88.15 (S1), 86.00 (S2), 84.15 (S3)
• Resistance: 90.00 (R1), 91.80 (R2), 93.00 (R3)
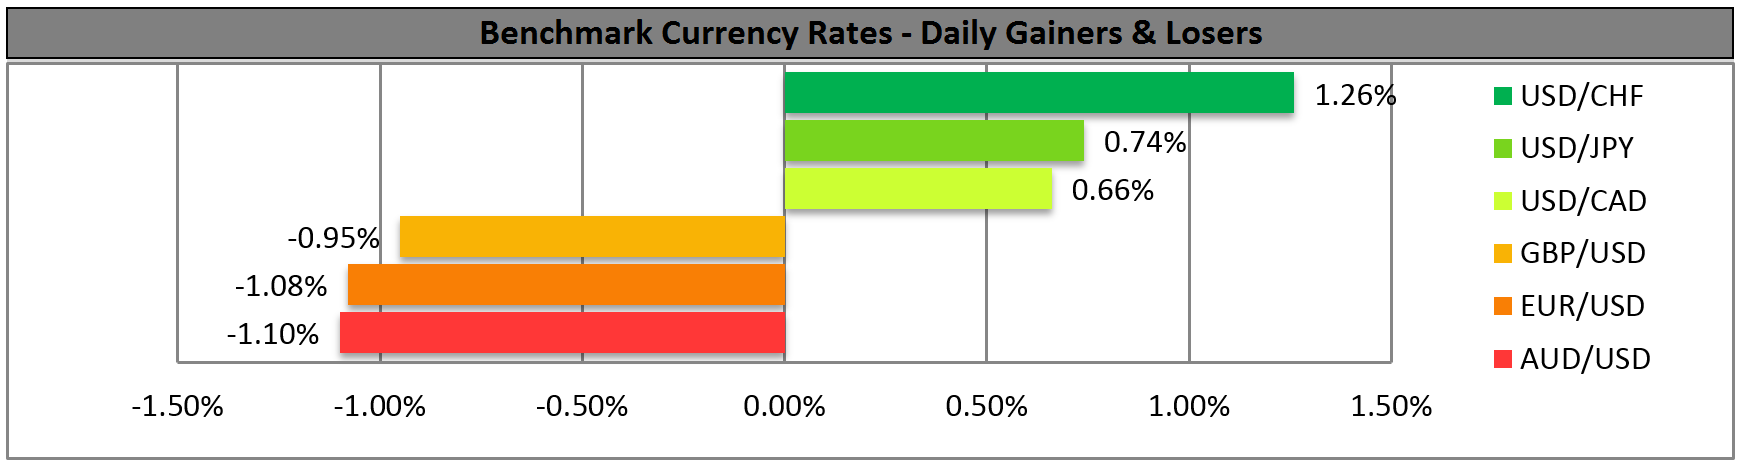
BENCHMARK CURRENCY RATES - DAILY GAINERS AND LOSERS
MARKETS SUMMARY