EUR/USD falls near 1.3365 again
EUR/USD fell on Tuesday to trade back below 1.3400, but the decline was halted near the support zone of 1.3350/65. A decisive break below the 1.3350 (S2) obstacle, is likely to have larger bearish implications and could pave the way towards the 1.3300 (S3) zone. In the bigger picture, the overall path remains to the downside, since on the daily chart, the pair is forming lower peaks and lower troughs within the blue downside channel. Moreover, the rate is trading below both the 50- and 200-day moving averages, with the former lying below the latter one, and pointing down. On the weekly chart, the dip below the psychological zone of 1.3500 has signaled the completion of a possible head and shoulders formation, enhancing my view for further declines in the longer-run.
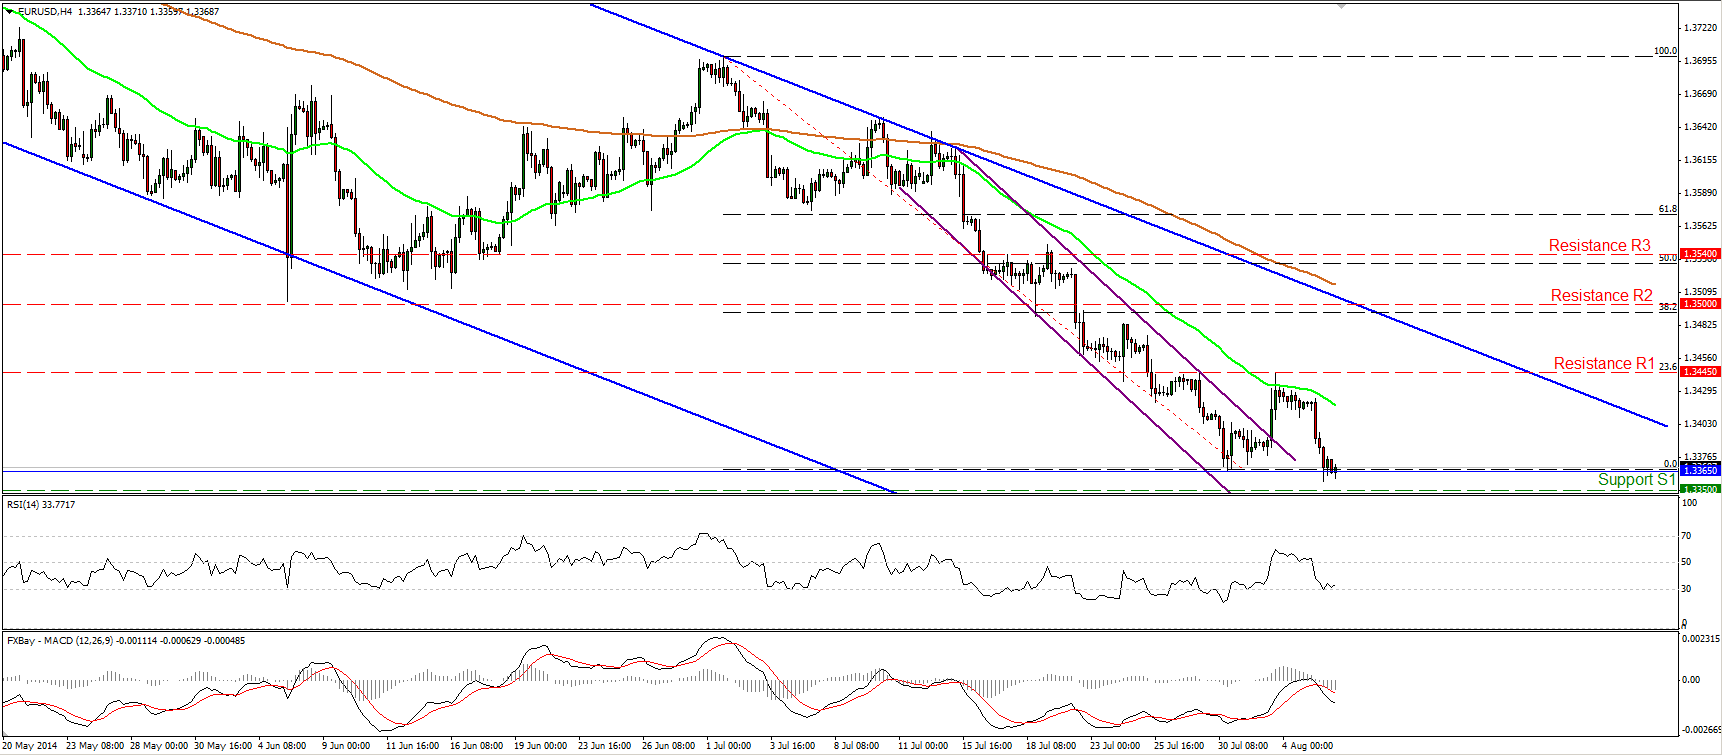
• Support: 1.3365 (S1), 1.3350 (S2), 1.3300 (S3).
• Resistance: 1.3445 (R1), 1.3500 (R2), 1.3540 (R3).
GBP/USD rebounds from 1.6815
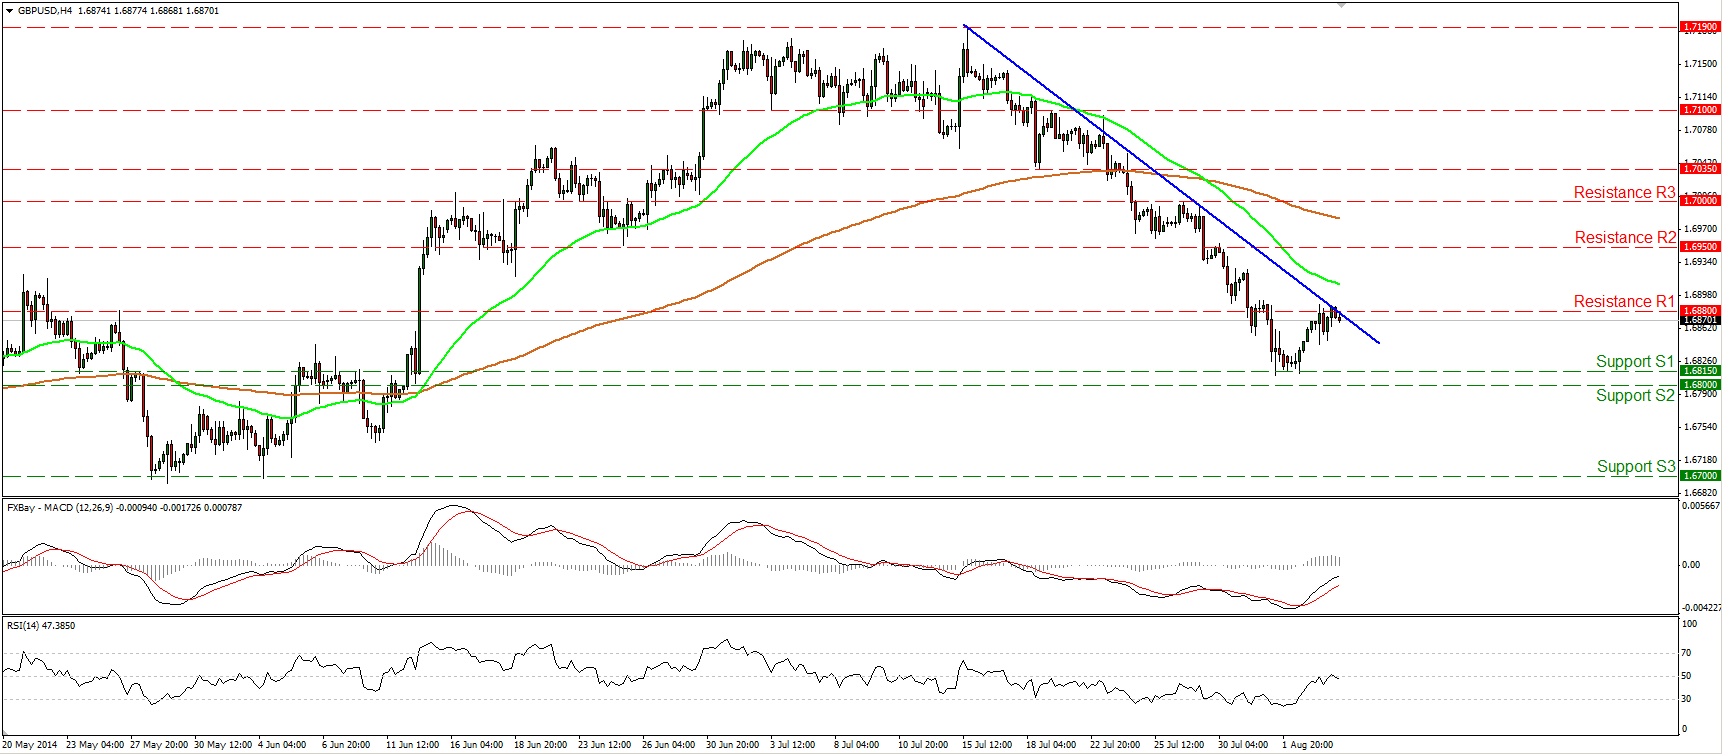
GBP/USD rebounded from 1.6815 (S1) and reached the blue downtrend line and our resistance zone of 1.6880 (R1). The price structure remains lower highs and lower lows below the trend line and below both the moving averages, and this keeps the short-term downside path intact. However, taking into account that today we get the UK industrial production for June, which is expected to have risen after falling in May, I would stay aside to see how the market reaction on the release will affect the technical picture of Cable. A positive figure could cause the rate to break the blue trend line and move above the resistance of 1.6880 (R1), while a disappointing release could be a good reason for the bears to target again the support zone of 1.6800/15.
• Support: 1.6815 (S1), 1.6800 (S2), 1.6700 (S3).
• Resistance: 1.6880 (R1), 1.6950 (R2), 1.7000 (R3).
EUR/JPY falls and finds support at 137.10
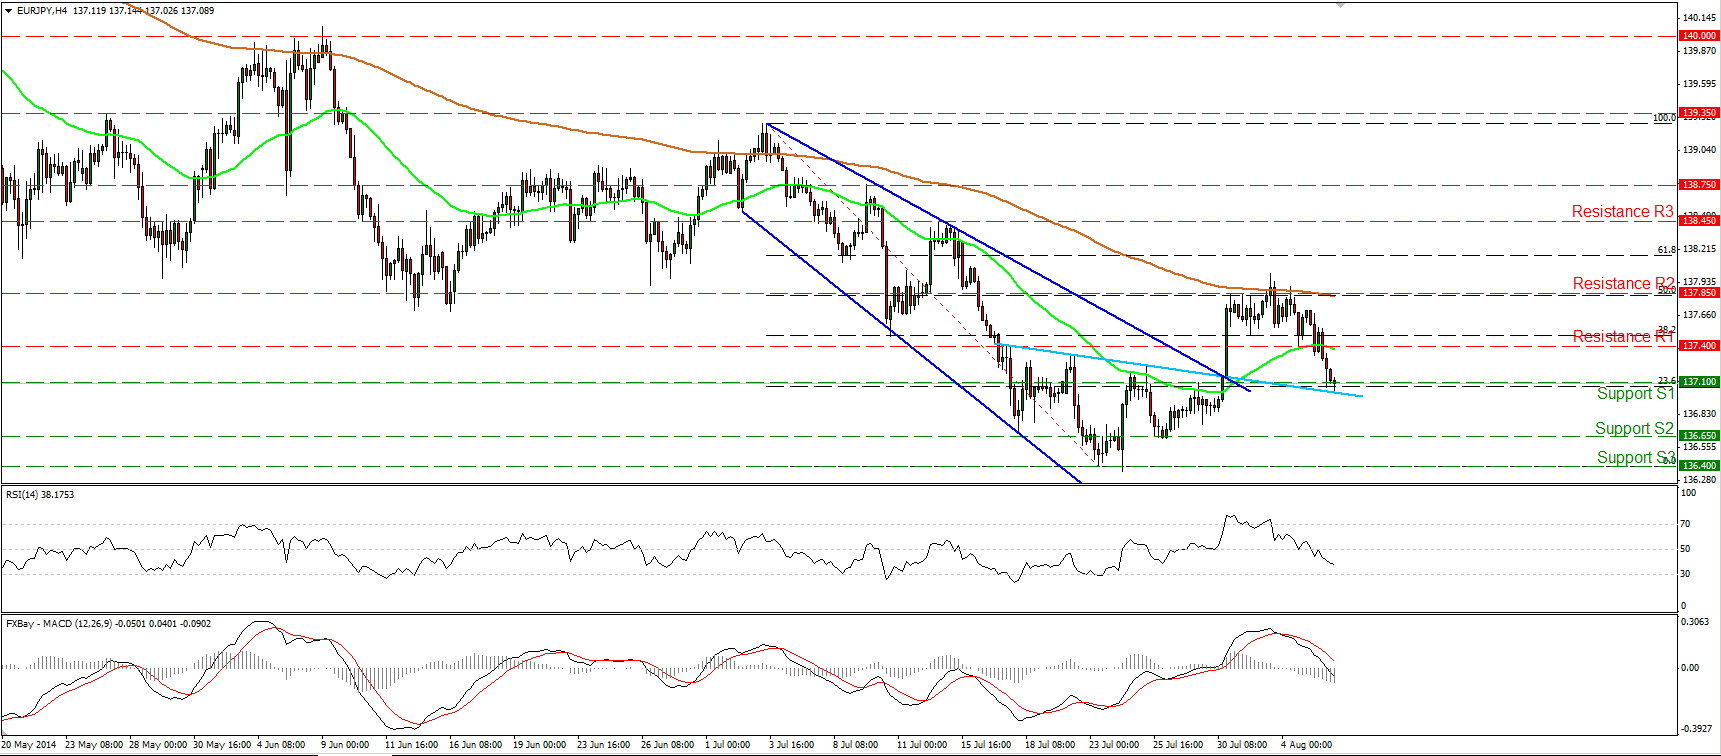
EUR/JPY fell sharply yesterday to reach the support barrier of 137.10 (S1) and the neckline of the possible inverted head and shoulders formation completed on the 30th of June. The possibility of a higher low still exist and a rebound near the neckline will confirm the validity of the formation and could set the stage for a leg higher towards the 137.85 (R2) zone, which coincides with the 200-periond moving average. On the other hand, a dip below 137.10 (S1) would be a first signal that the recent advance was just a 50% retracement of the 3rd – 24th July downtrend.
• Support: 137.10 (S1), 136.65 (S2), 136.40 (S3).
• Resistance: 137.40 (R1), 137.85 (R2), 138.45 (R3).
Gold remains neutral
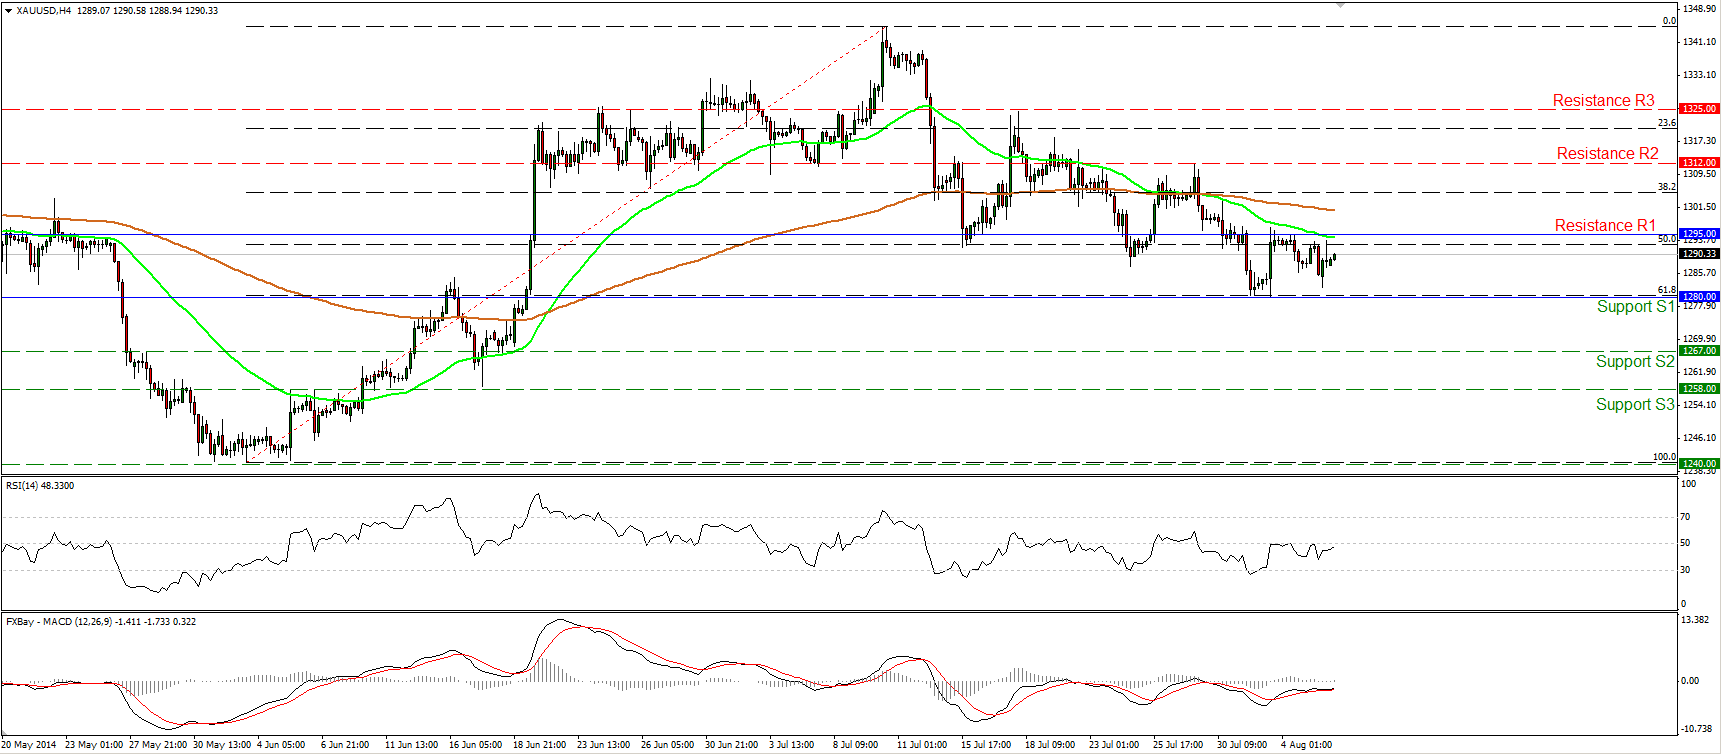
Gold continued trading within the range between the support of 1280 (S1), which coincides with the 61.8% retracement level of the 3rd June – 10th July uptrend, and the resistance of 1295 (R1), which lies near the 50-period moving average. Having that in mind and that our daily moving averages are still pointing sideways, I will keep my neutral stance. A decisive dip below the 1280 (S1) barrier is needed to signal further declines and could probably target the next support zone at 1265 (S2), while a move above the high of 1312 (R2) could be a sign that the 10th- 31st July decline was just a 61.8% correction of the 3rd June – 10th July uptrend.
• Support: 1280 (S1), 1265 (S2), 1258 (S3).
• Resistance: 1295 (R1), 1312 (R2), 1325 (R3) .
WTI finds support at 97.00 again
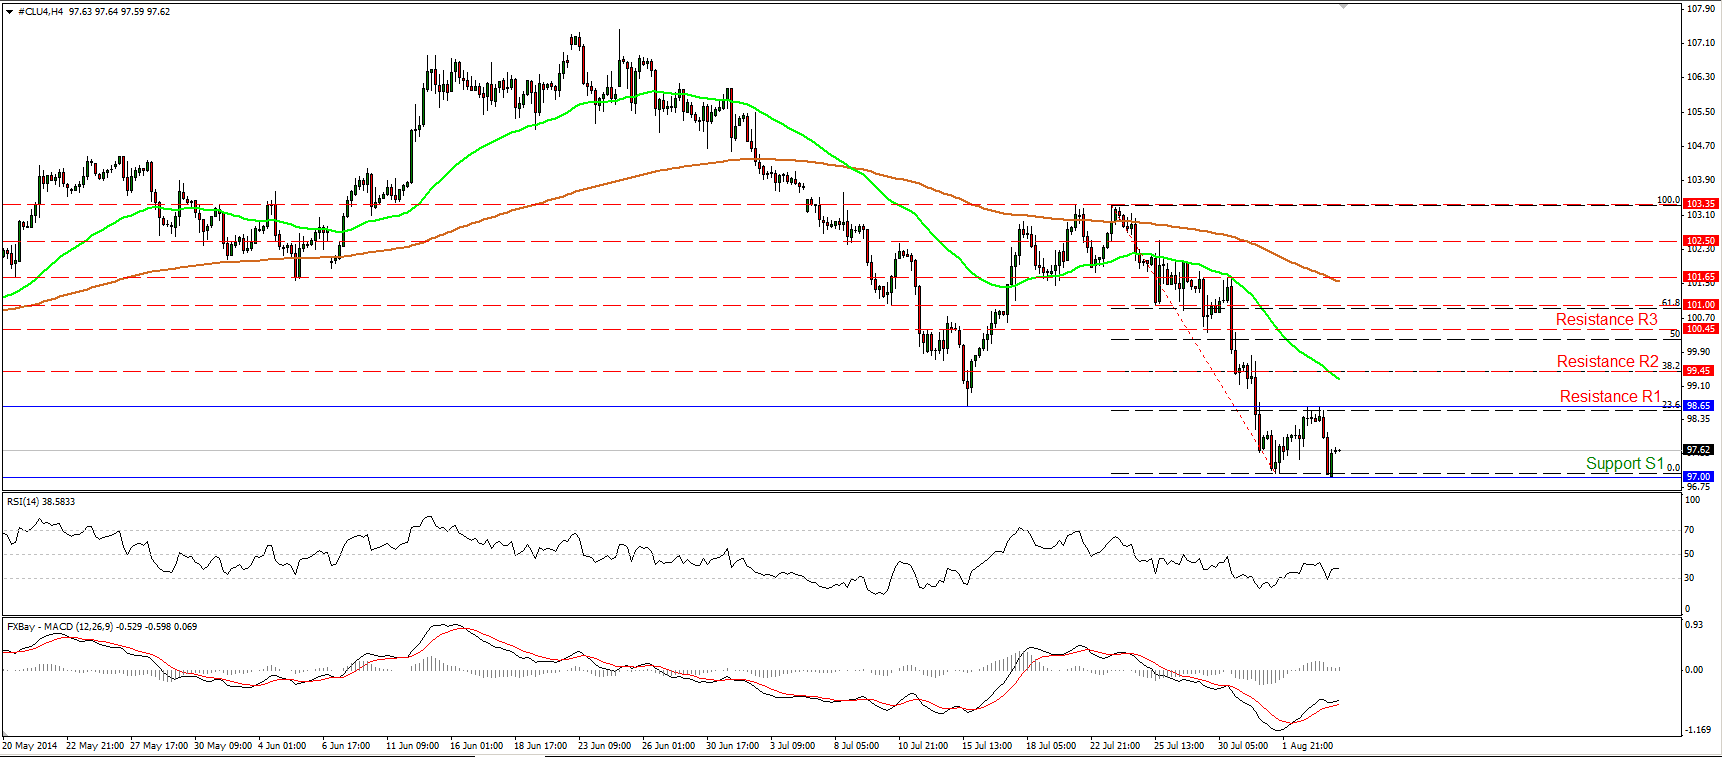
WTI tumbled after finding resistance at 98.65 (R1), which coincides with the 23.6% retracement level of the 23rd of July – 1st of August decline. Nonetheless, the decline was halted by the 97.00 (S1) support zone again. Although the price has formed a lower high and remained below both the moving averages, I would stay flat for now and I will maintain my view that it would be better to wait for a dip below the 97.00 (S1) hurdle, before regaining confidence on the downtrend. A clear move below 97.00 (S1) would signal a forthcoming lower low and could set the stage for extensions towards the zone of 95.85 (S2), which coincides with the 161.8% extension level of the 15th – 23rd July upside wave. Zooming on the 1-hour chart, I see positive divergence between the price action and both our hourly momentum studies, giving me another reason to remain on the sidelines at the moment.
• Support: 97.00 (S1), 95.85 (S2), 94.00 (S3).
• Resistance: 98.65 (R1), 100.45 (R2), 101.00 (R3).
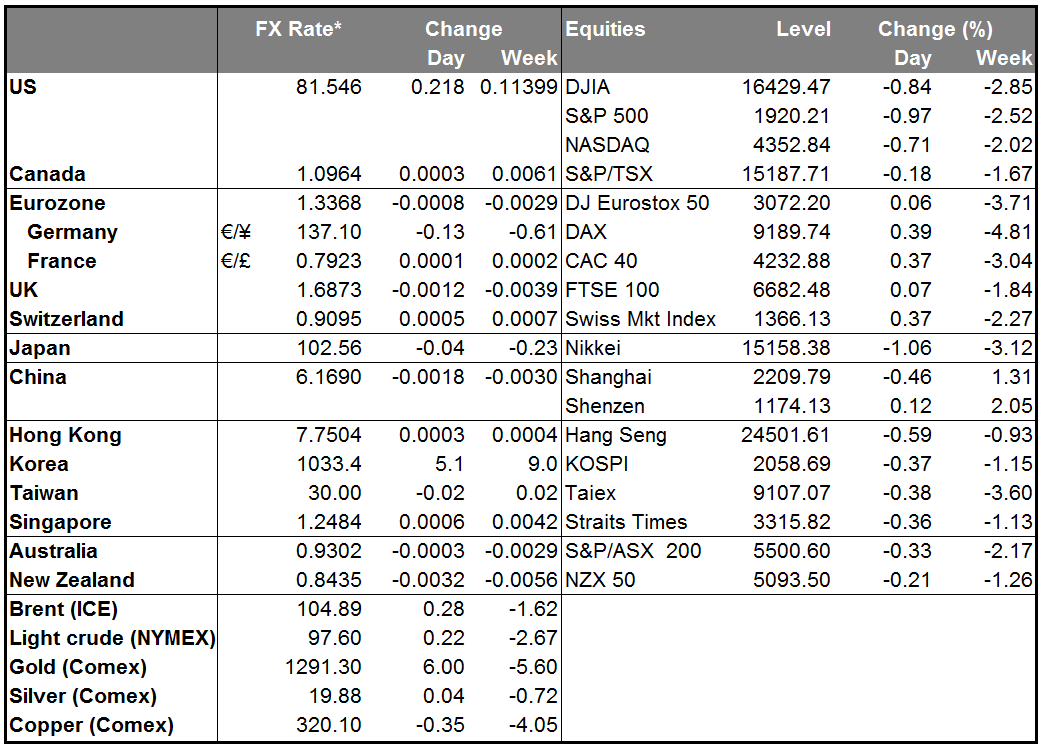
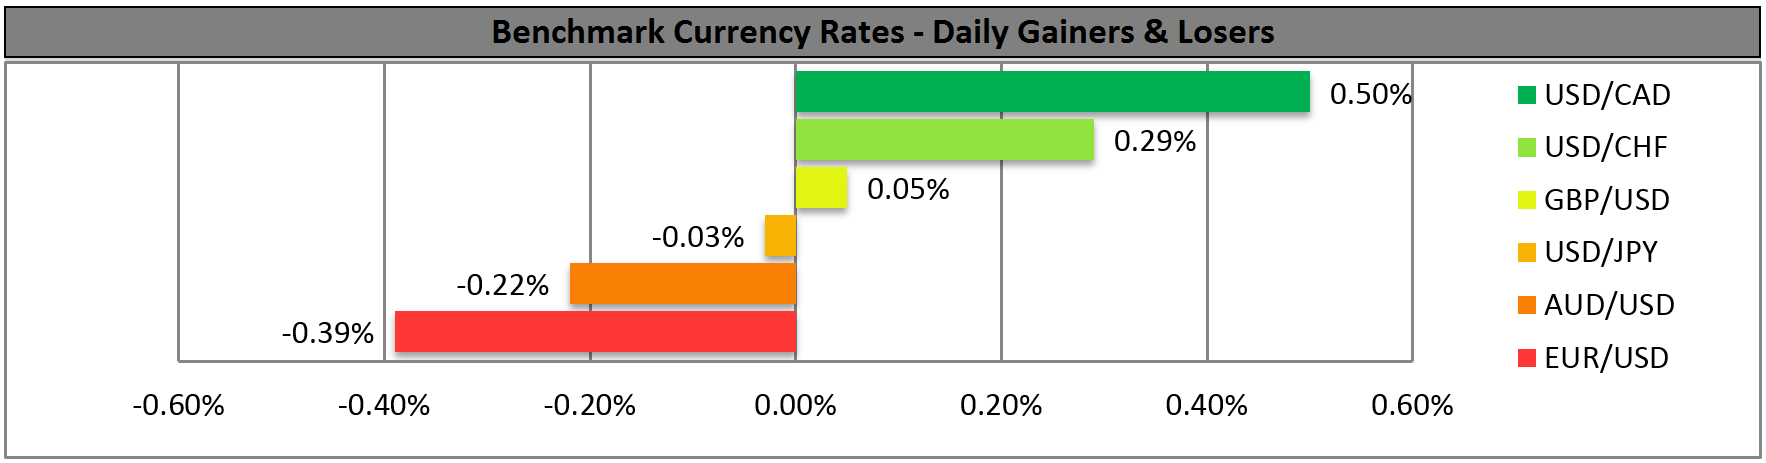
BENCHMARK CURRENCY RATES - DAILY GAINERS AND LOSERS
MARKETS SUMMARY