EUR/USD continues higher
EUR/USD continued higher on Tuesday, confirming my concerns that the recovery from 1.2435 (S1) may continue. Checking our momentum studies, I cannot rule out further upside at the moment. The RSI just crossed above its 50 line, while the MACD lies above its trigger line and is pointing up. However, since the possibility for a lower high still exists, I still see the recent up leg as a corrective move. On the daily chart, the price structure remains lower peaks and lower troughs below both the 50- and the 200-day moving averages, and this keeps the overall downtrend intact. But, taking into account that I see positive divergence between our daily oscillators and the price action, I would prefer to sit on the sidelines for now and wait for momentum and price action to confirm each other.
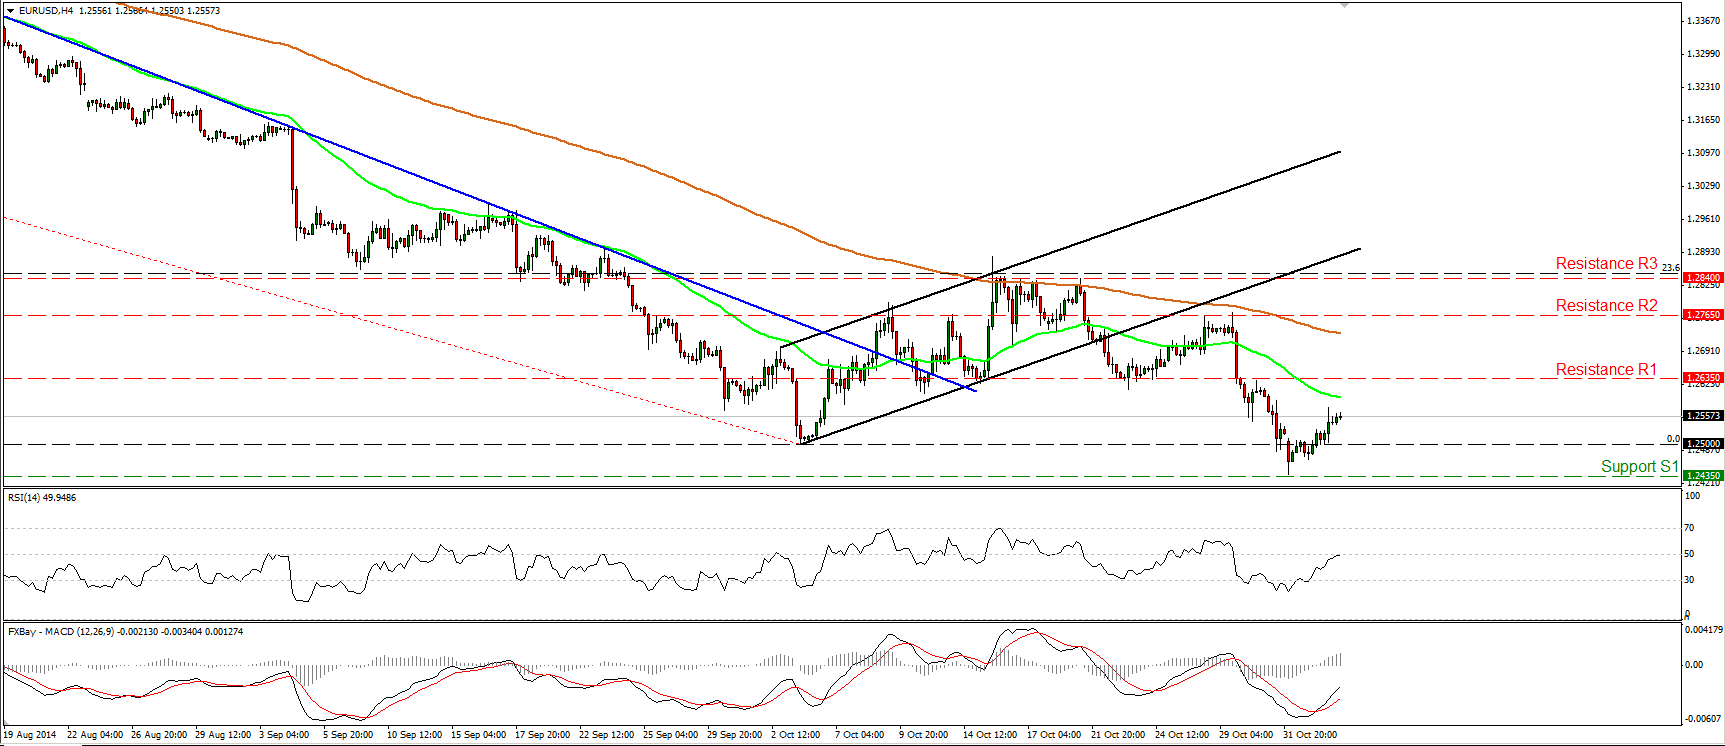
• Support: 1.2435 (S1), 1.2400 (S2), 1.2300 (S3).
• Resistance: 1.2635 (R1), 1.2765 (R2), 1.2840 (R3).
EUR/JPY maintains the strong bullish momentum
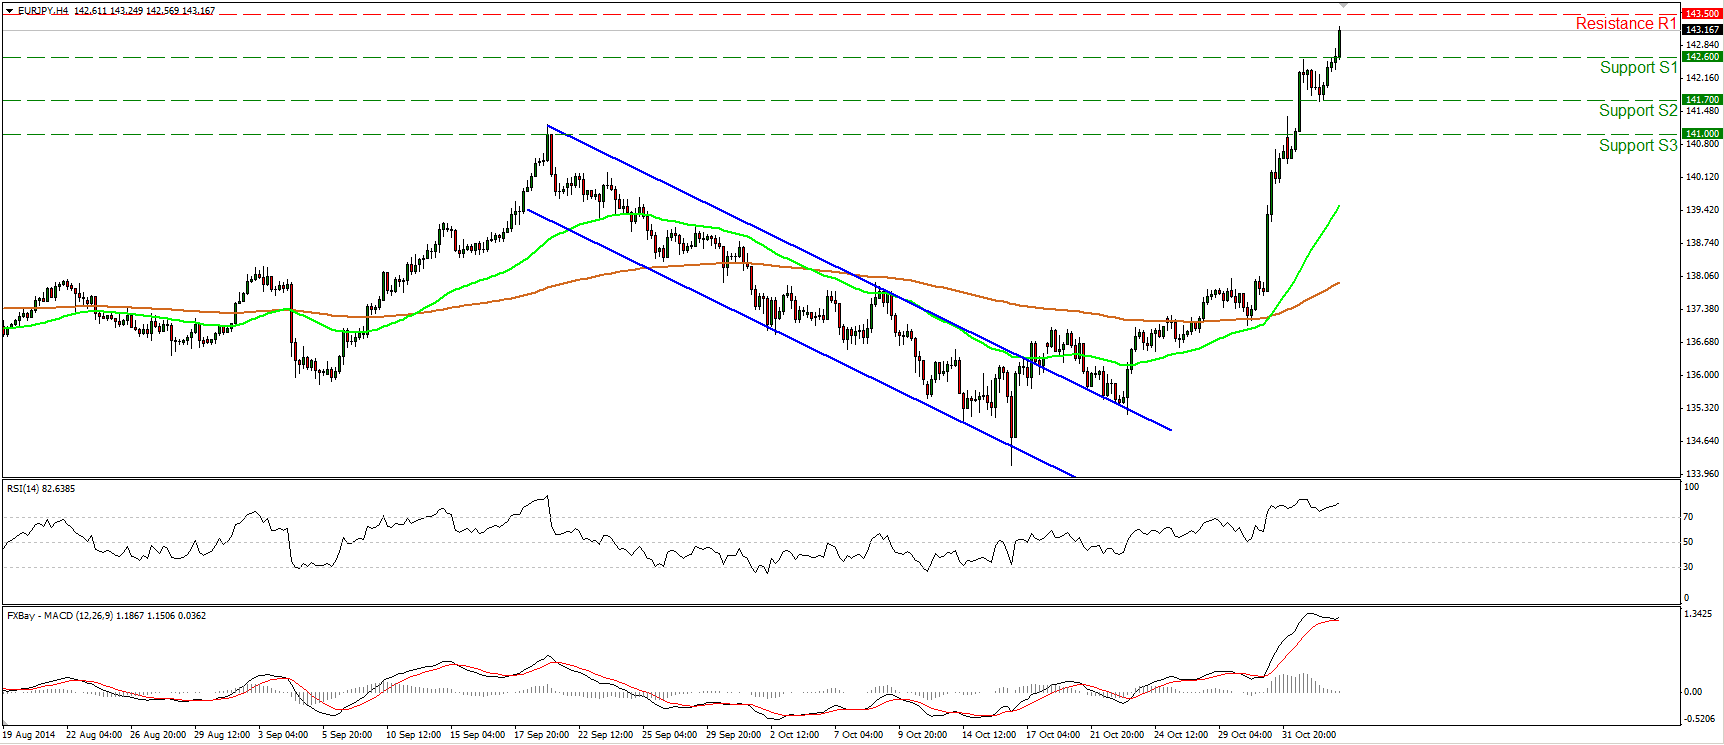
EUR/JPY firmed up yesterday, violating the resistance (turned into support) line of 142.60 (S1). Today, during the early European morning, the rate is heading towards the highs of April, at 143.50 (R1), where a decisive upside break is likely to see scope for extensions towards the support-turned-into-resistance hurdle of 144.35 (R2), defined by the low of the 31st of December 2013. In the bigger picture, the break above the highs of the 19th of September confirmed a forthcoming higher high on the daily chart and this keeps the overall outlook of EUR/JPY to the upside. Shifting my attention at our daily momentum studies, I see that the 14-day RSI entered its overbought zone and is pointing up, while the daily MACD remains above both its zero and signal lines. These signs confirm the strong bullish sentiment towards the pair and support my view that we may see the rate higher in the close future.
• Support: 142.60 (S1), 141.70 (S2), 141.00 (S3).
• Resistance: 143.50 (R1), 144.35 (R2), 145.00 (R3).
GBP/USD stays near 1.6000
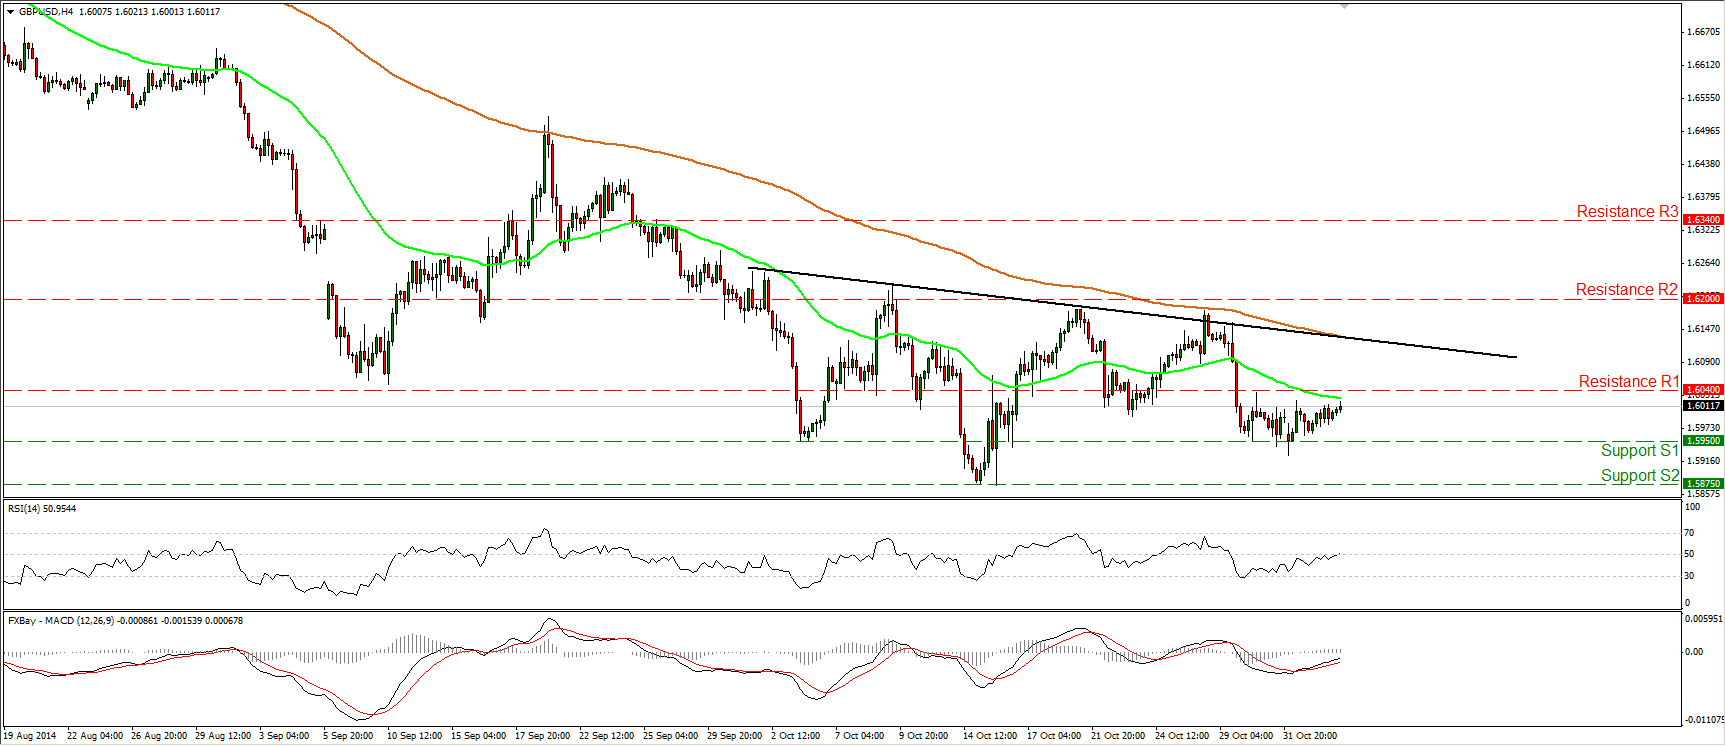
GBP/USD moved somewhat higher, staying near 1.6000. The pair appears to be oscillating between the support line of 1.5950 (S1) and the resistance of 1.6040 (R1), thus I would prefer to keep my neutral stance as far as the short-term picture is concerned. . As for the broader trend, I will maintain the view that as long as Cable is trading below the 80-day exponential moving average, the overall path remains negative. But taking into account that I still see positive divergence between both the daily momentum indicators and the price action, I would stay mindful of an upside corrective phase before the next leg down. I would prefer to see a dip below 1.5875 before getting again confident on the downside. Such a dip is likely to confirm a forthcoming lower low and perhaps trigger extensions towards the resistance-turned-into support barrier of 1.5720 (S3), defined by the high of the 21st of August 2013.
• Support: 1.5950 (S1), 1.5875 (S2), 1.5720 (S3).
• Resistance: 1.6040 (R1), 1.6200 (R2), 1.6340 (R3).
Gold stays above 1160
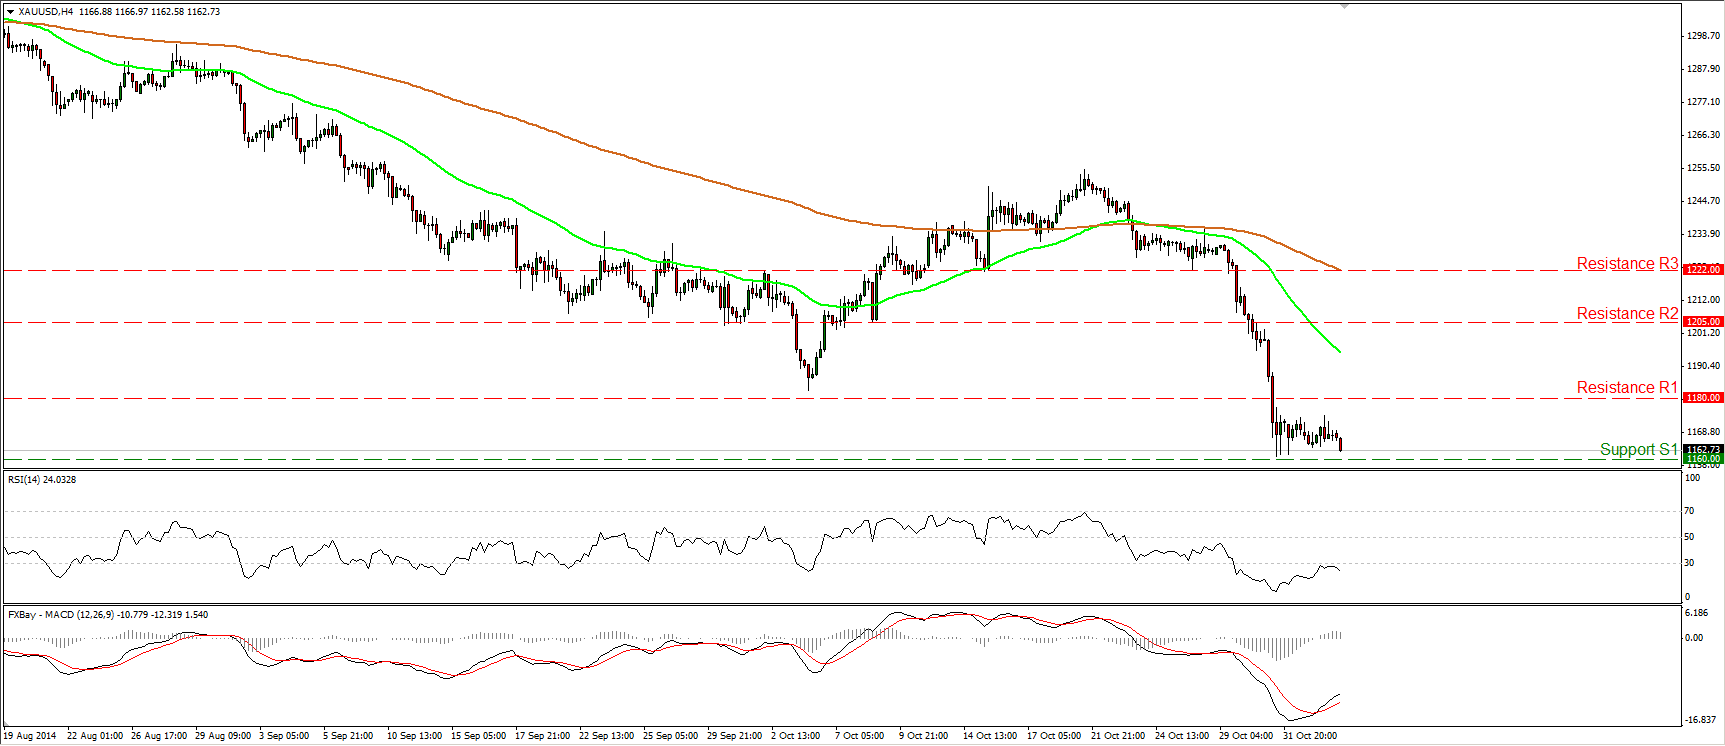
Gold continued ranging, staying between the 1160 (S1) hurdle, which coincides with the 61.8% retracement level of the October 2008 - September 2011 major advance, and the key support-turned-into-resistance barrier of 1180 (R1). Today, during the early European morning, the metal moved lower somewhat and could challenge again the 1160 (S1) area any time soon. If the bears are strong enough to overcome that obstacle, I would expect them to target the low of the 19th of April 2010, at 1125 (S2). Although the MACD remains above its trigger line and is pointing up, the RSI found resistance near its 30 line, turned down and seems willing to stay a bit longer within its extreme zone. This adds to my view that we may see the yellow metal lower in the near future.
• Support: 1160 (S1), 1125 (S2), 1100 (S3).
• Resistance: 1180 (R1), 1205 (R2), 1222 (R3).
WTI dips below 78.00
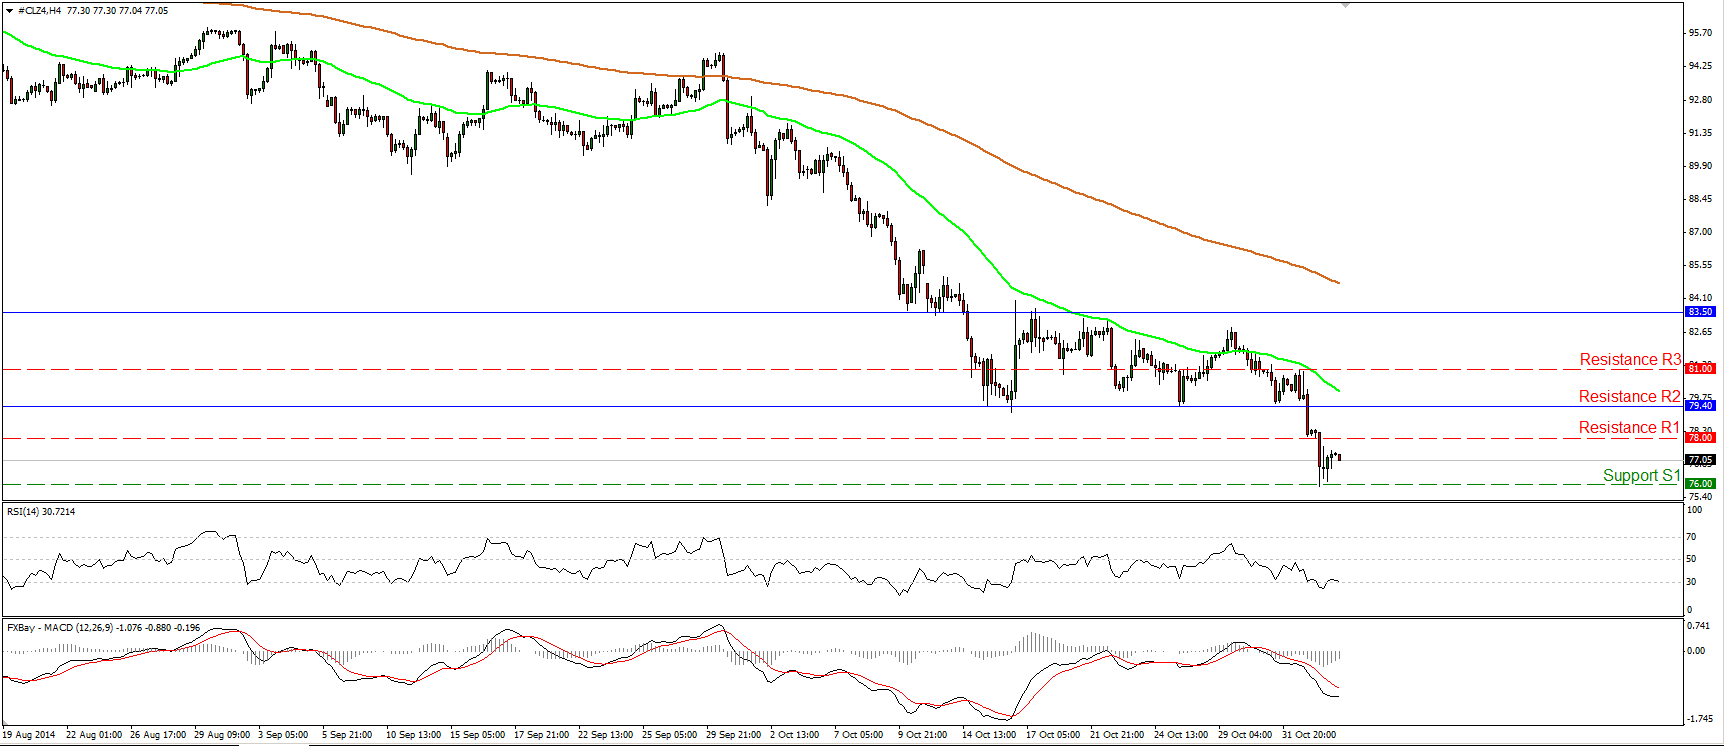
WTI continued tumbling on Tuesday, falling below the support (turned into resistance) hurdle of 78.00. However, WTI found support near 76.00 before rebounding somewhat. As long as the 79.40 (R2) line holds as a resistance, I would maintain the view that the price is likely to challenge the psychological zone of 75.00 (S2), defined by the lows of October 2010. On the daily chart, the price structure remains lower lows and lower highs below both the 50- and the 200- day moving averages, keeping the overall path to the downside. Moreover, the 14-day RSI dipped again within its oversold field, while the daily MACD, already negative, has turned down and fell below its signal line. This designates accelerating downside momentum and amplifies the case for further declines in the close future.
• Support: 76.00 (S1), 75.00 (S2), 71.00 (S3).
• Resistance: 78.00 (R1), 79.40 (R2), 81.00 (R3).
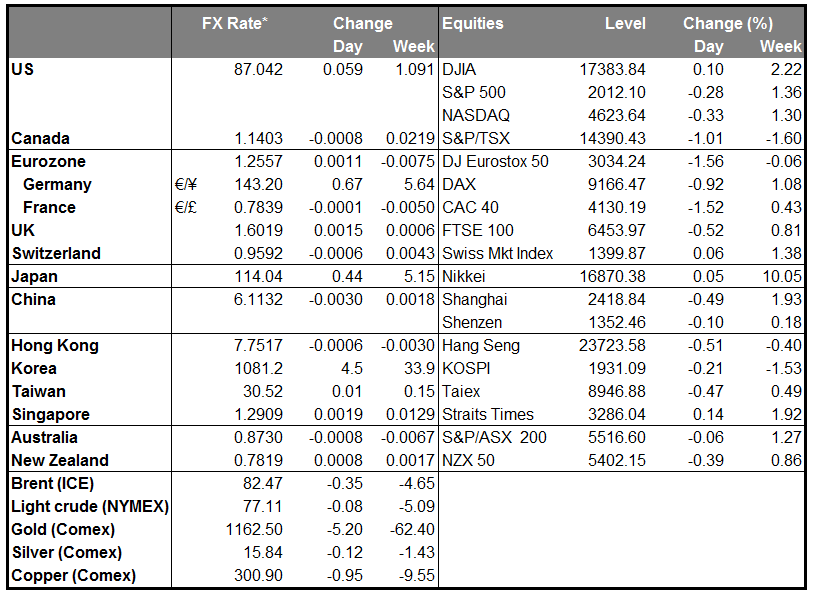
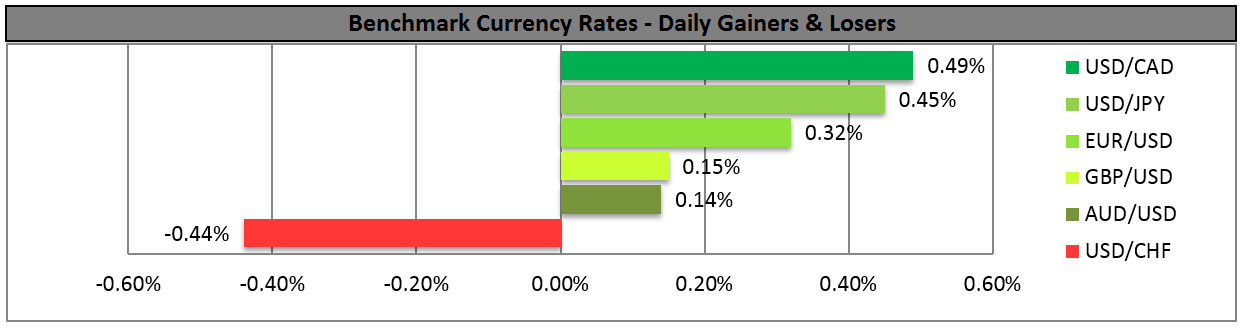
BENCHMARK CURRENCY RATES - DAILY GAINERS AND LOSERS
MARKETS SUMMARY