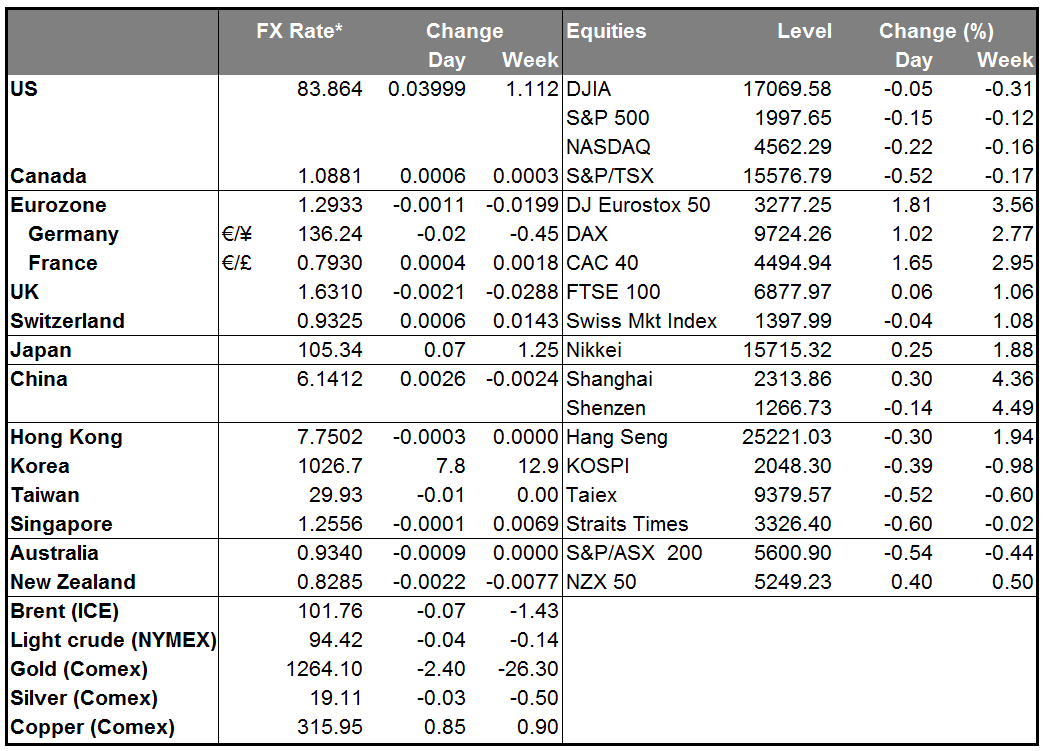
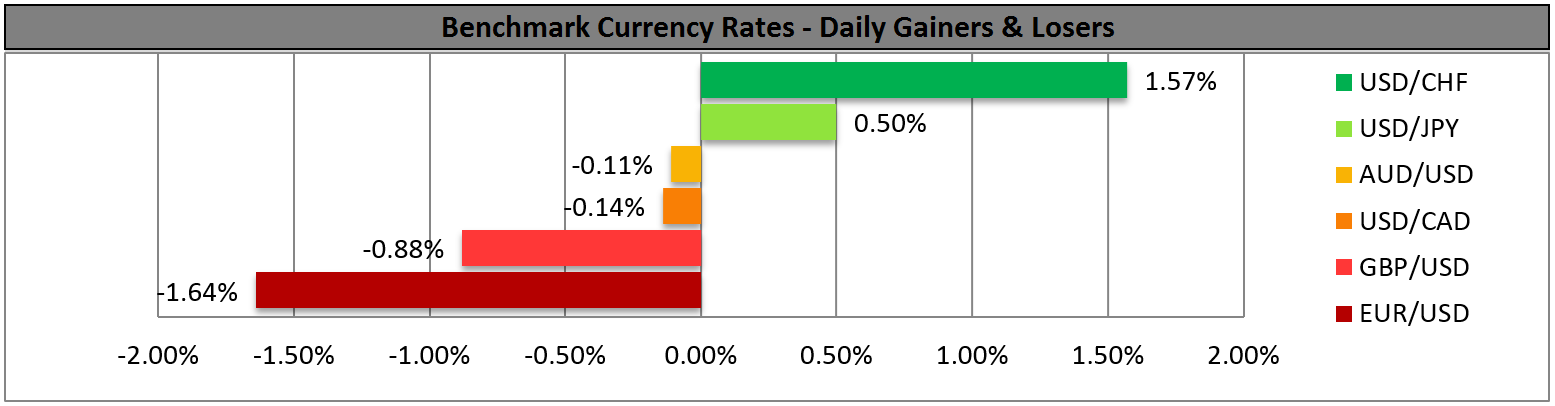
EUR/USD collapses after the ECB cuts rates
EUR/USD plunged on Thursday after the ECB decided to cut all its interest rates by 10bps and to start purchases of non-financial private sector assets. The pair fell below 1.3100 and the lower boundary of the blue downside channel (connecting the highs and the lows on the daily chart) at the rate decision, and later in the European afternoon, dipped below the psychological number of 1.3000. The tumble was halted at 1.2917 (S1), slightly above our support line of 1.2900 (S2). Although the bears may be reluctant to enter the market at these levels, a strong NFP print today is likely to encourage them to push the rate below 1.2900 (S2). Such a break is likely to pave the way towards the next key support zone of 1.2760 (S3), defined by the lows of March and July 2013.
• Support: 1.2917 (S1), 1.2900 (S2), 1.2760 (S3).
• Resistance: 1.3000 (R1), 1.3100 (R2), 1.3152 (R3).
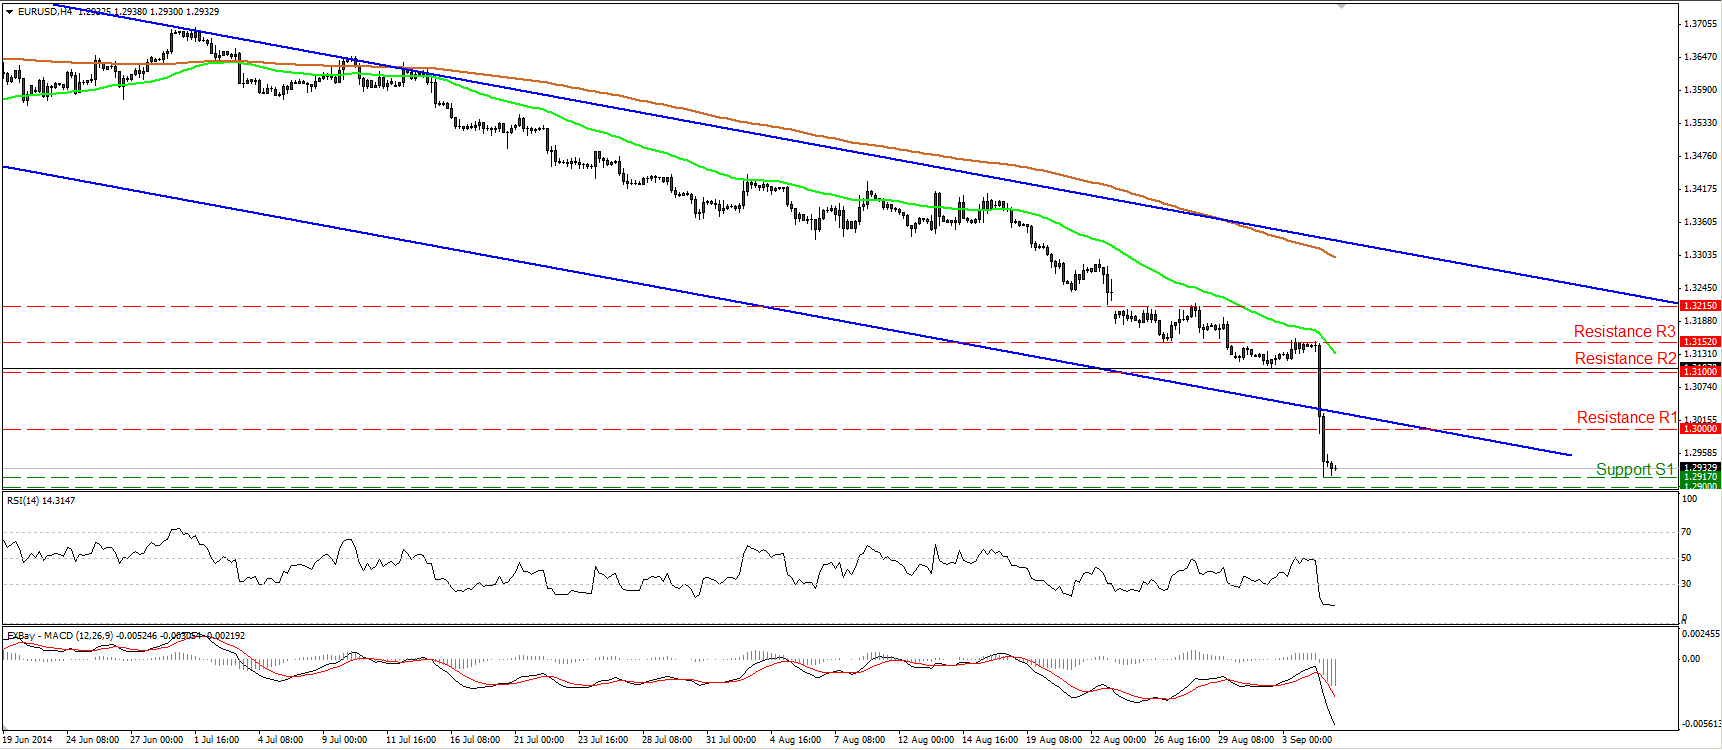
USD/JPY reaches levels last seen back in September 2008
USD/JPY rebounded from 104.75 (S2) and surged to reach levels seen back in September 2008. The rate found resistance at 105.70 (R1), where a clear break could target the 106.00 (R2) line. Nevertheless, taking a look on our momentum studies, I see negative divergence between the price action and both the RSI and the MACD. As a result, I would be cautious for a possible corrective move before the bulls take the reins again. In the bigger picture, I still see a newborn long-term uptrend, since the price structure remains higher highs and higher lows above both the 50- and the 200-day moving averages.
• Support: 105.30 (S1), 104.75 (S2), 104.26 (S3).
• Resistance: 105.70 (R1), 106.00 (R2), 107.00 (R3).
EUR/GBP plunges on the ECB rate cuts

EUR/GBP also plunged after the ECB decided to cut all its interest rates. After the fall, the pair found support near the 0.7900 (S1) zone and rose somewhat to touch the 0.7938 (R1) line. As long as the possibility for a lower high still exist, I see a cautiously bearish picture. A decisive dip below the 0.7900 (S1) line could have bearish implications and could target the low of the 23rd of July at 0.7875 (S2). On the daily chart, the major downtrend is still intact, as defined by the downtrend drawn from back the high of the 1st of August 2013. Nevertheless, I would wait for a clear dip below 0.7875 (S2) before regaining confidence on that long-term downside path.
• Support: 0.7900 (S1), 0.7875 (S2), 0.7815 (S3).
• Resistance: 0.7938 (R1), 0.7964 (R2), 0.7995 (R3).
Gold dips near 1260 again

Gold moved lower yesterday, after finding resistance near the black long-term support line, drawn from back at the low of the 30th of December. Nevertheless, the metal found some buy orders, slightly below our support line of 1260 (S1). Taking into account that the metal is trading within the purple downside channel and below the aforementioned black long-term support line, I still see a negative overall outlook. A decisive move below 1260 (S1) could trigger extensions towards our next support obstacle, at 1250 (S2). My only concern is that, on the 4-hour chart, I see positive divergence between the RSI and the price action. However, on the daily chart, both our daily momentum studies follow downside paths, adding to the negative picture of gold.
• Support: 1260 (S1), 1250 (S2), 1240 (S3).
• Resistance: 1273 (R1), 1280 (R2), 1290 (R3).
WTI finds resistance near 96.00 again
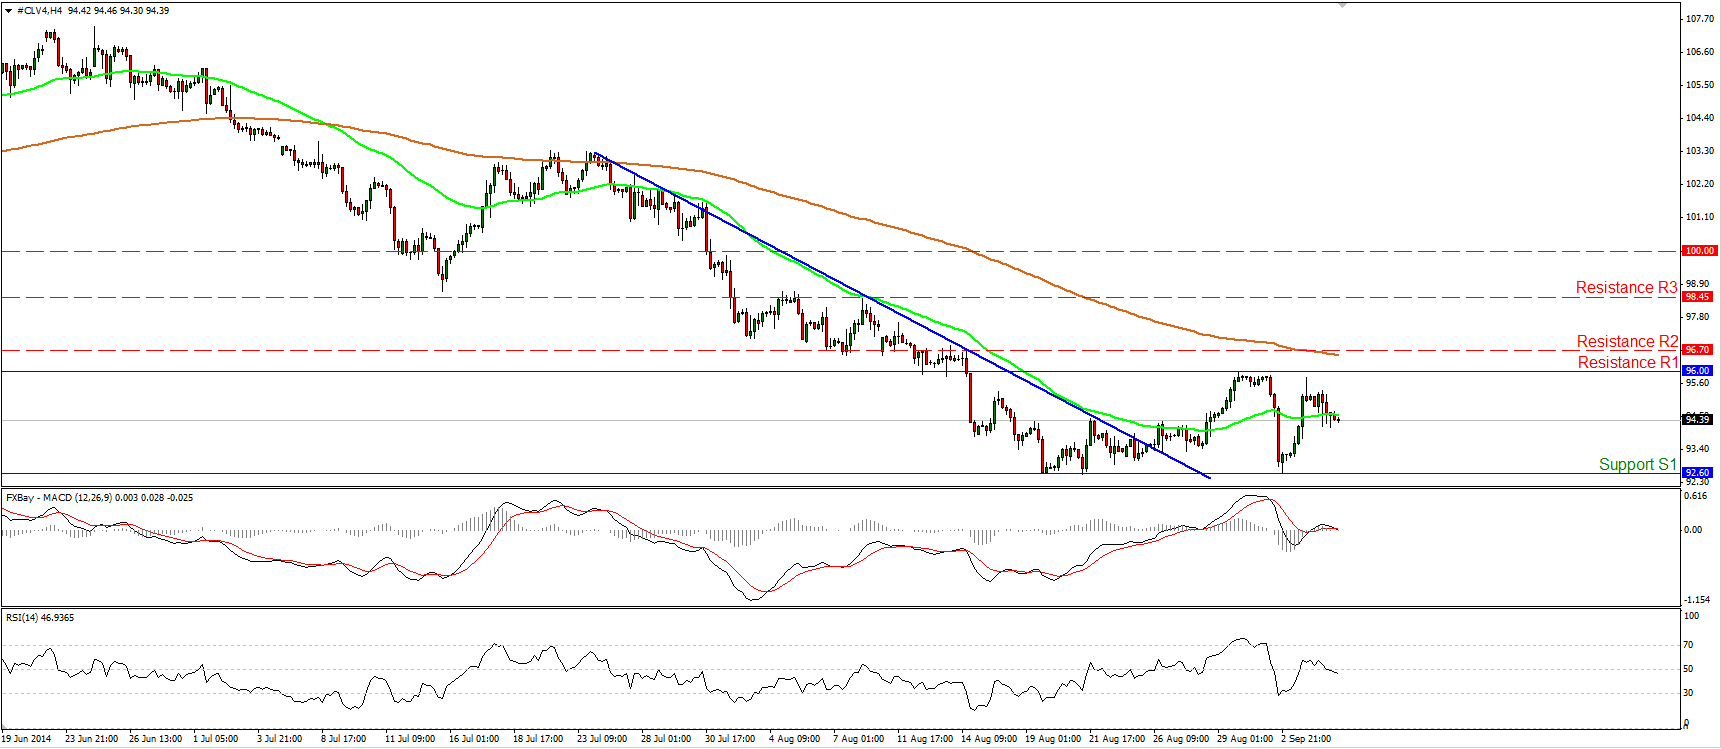
WTI moved lower after finding resistance near the 96.00 (R1) line again. As long as the price is trading between that barrier and the support of 92.60 (S1), I will consider the near-term path to be to the sideways and I will maintain my neutral stance. I will repeat that I would like to see a move above 96.70 (R2) to shift my attention to the upside. Such a move would confirm a forthcoming higher high and is likely to target the 98.45 (R3) barrier. Moving on the daily chart, although negative, the daily MACD is still in a rising mode, increasing the likelihood for the aforementioned upside break. On the downside, only a dip below 92.60 (S1), could signal the continuation of the prior downtrend.
• Support: 92.60 (S1), 91.60 (S2), 90.00 (S3).
• Resistance: 96.00 (R1), 96.70 (R2), 98.45 (R3).
BENCHMARK CURRENCY RATES - DAILY GAINERS AND LOSERS
MARKETS SUMMARY