EUR/USD somewhat lower
EUR/USD declined slightly on Monday remaining below 1.3445 (R1), the 23.6% retracement level of the 1st – 30th July decline, but still above 1.3400 (S1). The overall path remains to the downside, in my view, since on the daily chart, the pair is forming lower peaks and lower troughs within the blue downside channel, and I would see Friday’s rebound as corrective wave. The 14 day RSI remains above its 30 line, after exiting its oversold zone, while the MACD is getting closer to its signal line and could move above it in the near future. This supports my view, that although the picture of EUR/USD remains negative, we may experience the continuation of the retracement , perhaps near the psychological zone of 1.3500 (R2) and the 38.2% retracement level of the 1st – 30th July down move.
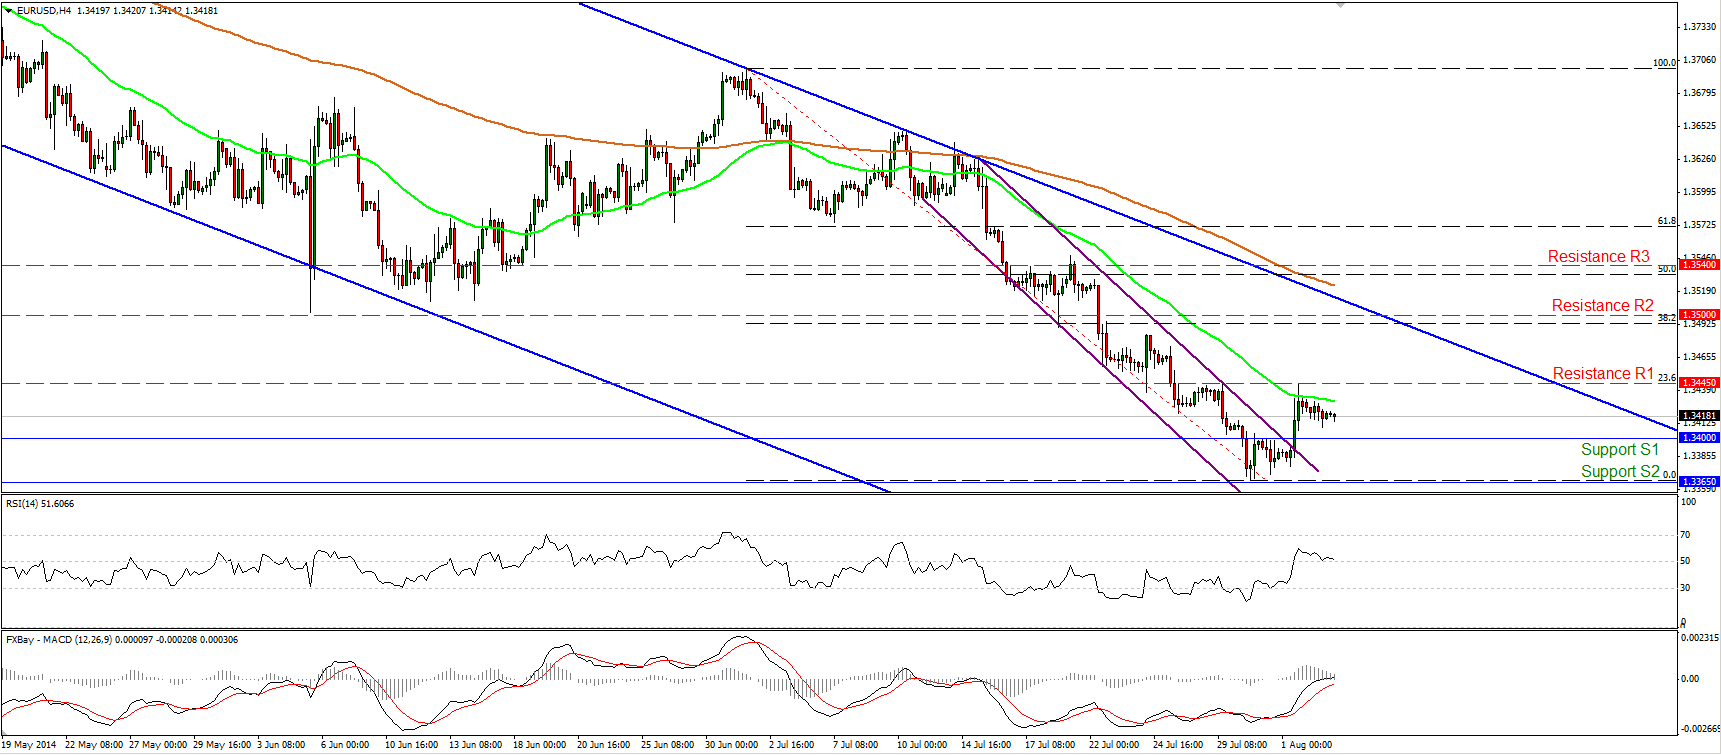
• Support: 1.3400 (S1), 1.3365 (S2), 1.3350 (S3)
• Resistance: 1.3445 (R1), 1.3500 (R2), 1.3540 (R3)
USD/JPY falls after failing to move above103.00

USD/JPY collapsed on Friday, but the decline was halted near the blue short-term uptrend line. On Monday, the pair moved in a consolidative mode remaining supported by that trend line. Although, this keeps the uptrend intact, bearing in mind that the decline was too sharp, I would stand on the sidelines for now. The RSI lies near its neutral level, while the MACD remains below its signal line and is pointing down, confirming my view that it’s not a good time to rely on the uptrend. A dip below 102.25 (S2) could confirm my worries and is likely to trigger declines towards the 101.95 area. On the upside, a move above 102.75 (R1) would signal a rebound from the trend line and could target the recent highs of 103.00 (R2). However, a clear move above 103.00 (R2) is needed to confirm a higher high and the reinforcement of the uptrend.
• Support: 102.40 (S1), 102.25 (S2), 101.95 (S3)
• Resistance: 102.75 (R1), 103.00 (R2), 103.40 (R3)
EUR/GBP moves above the downtrend line

EUR/GBP surged to violate the 0.7935 hurdle and the long-term downtrend line, drawn from back the 11th of April. The rate hit our resistance of 0.7980 (R1) and yesterday it declined somewhat. The rally confirmed a higher high and my recent stance that the downtrend was at its latest stages. As long as the rate remains above the prior trend line I would expect the longs to take control and challenge again the resistance of 0.7980 (R1). A decisive move above that hurdle is likely to pave the way towards the next resistance, at 0.8030 (R2). Relying on our momentum studies does not seem a solid strategy for now, since the MACD fell below its signal line, but the RSI bottomed slightly above 50 and is now pointing up.
• Support: 0.7935 (S1), 0.7905 (S2), 0.7875 (S3)
• Resistance: 0.7980 (R1), 0.8030 (R2), 0.8080 (R3)
Gold lower after hitting 1295
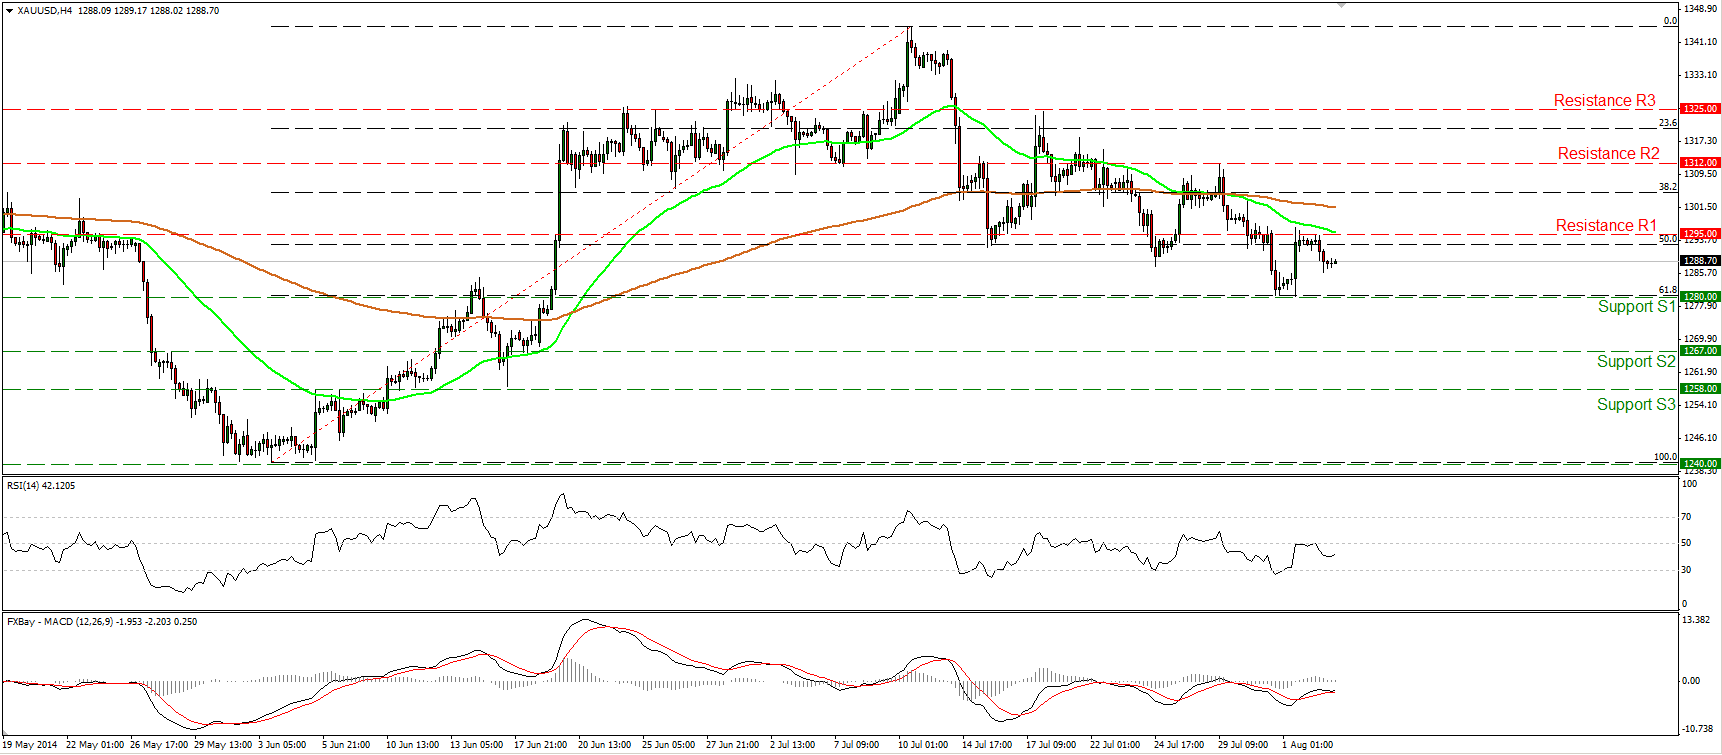
Gold remained capped by the 1295 (R1) resistance and the 50 period moving average. The metal declined yesterday to trade in the middle of the range between that resistance and the support of 1280 (S1), which coincides with the 61.8% retracement level of the 3rd June – 10th July uptrend. Although the price structure remains lower lows and lower highs, given our proximity to the 1280 (S1) key support zone, I would maintain my neutral stance. Moreover, on the daily chart, both the 50-day and the 200-day moving averages are pointing sideways, giving me another reason to remain flat. A decisive dip below the 1280 (S1) barrier is needed to signal further declines and could probably target the next support zone at 1265 (S2), while a move above the high of 1312 (R2) could be a sign that the 10th- 31st July decline was just a 61.8% correction of the 3rd June – 10th July uptrend.
• Support: 1280 (S1), 1265 (S2), 1258 (S3)
• Resistance: 1295 (R1), 1312 (R2), 1325 (R3)
WTI touches the resistance of 98.65
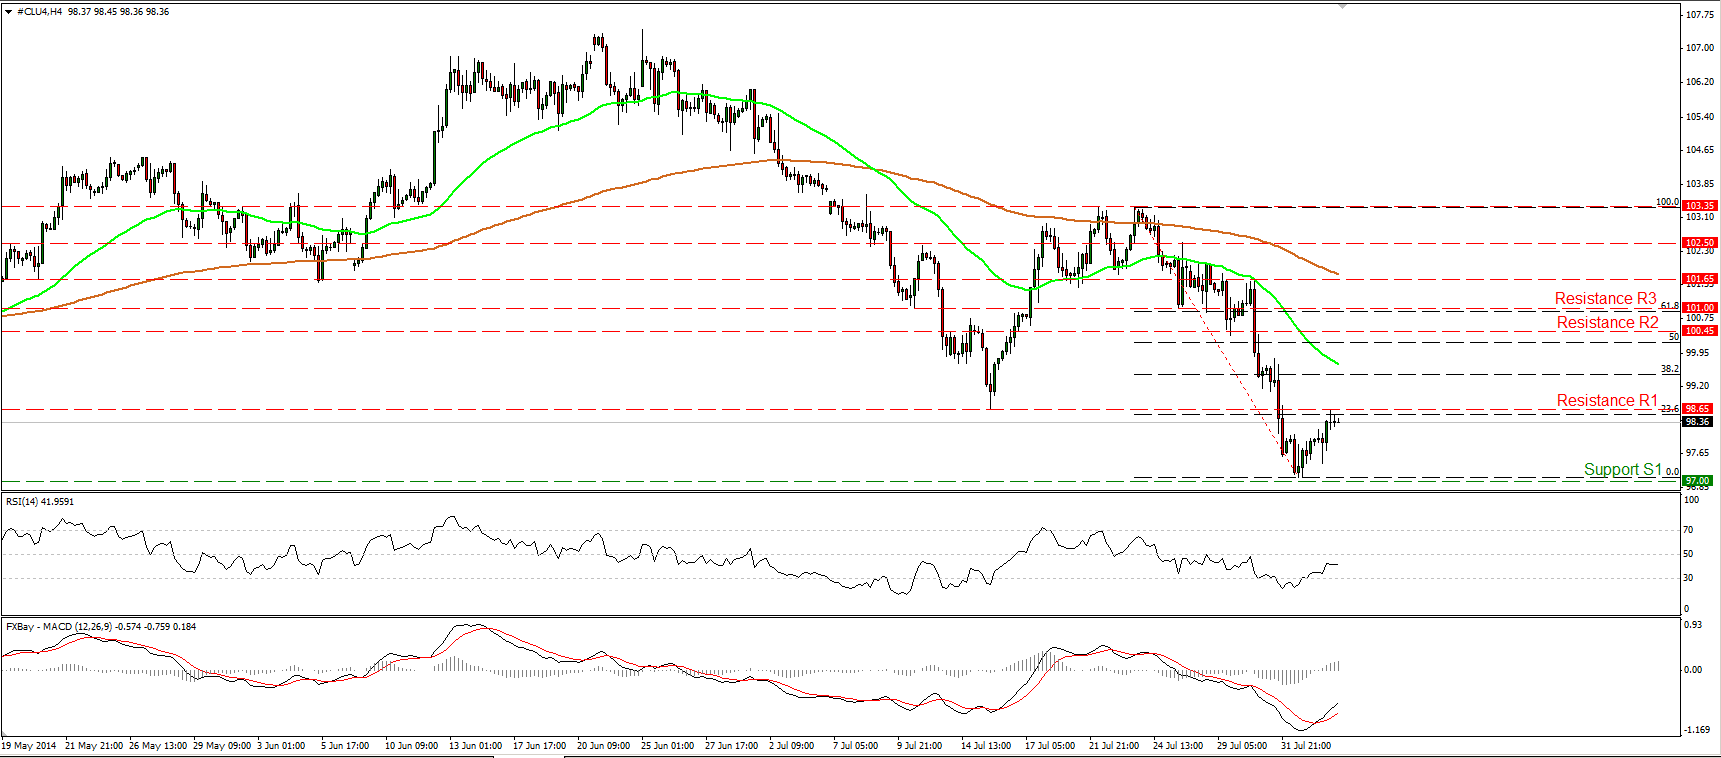
WTI continued yesterday’s rebound, confirming my expectations for further rebound. The price reached our resistance of 98.65 (R1), which lies near the 23.6% retracement level of the 23rd of July – 1st of August decline. The price structure remains lower lows and lower highs below both the moving averages, but although I still see a downtrend, taking into account our momentum signs, I believe that the upside wave has further to go. The RSI moved higher after leaving its oversold territory, while the MACD moved above its signal line and is now pointing up. I will stick to the view that it is better to wait for a clear dip below 97.00 (S1) before regaining confidence on the downside path.
• Support: 97.00 (S1), 95.85 (S2), 94.00 (S3)
• Resistance: 98.65 (R1), 100.45 (R2), 101.00 (R3)
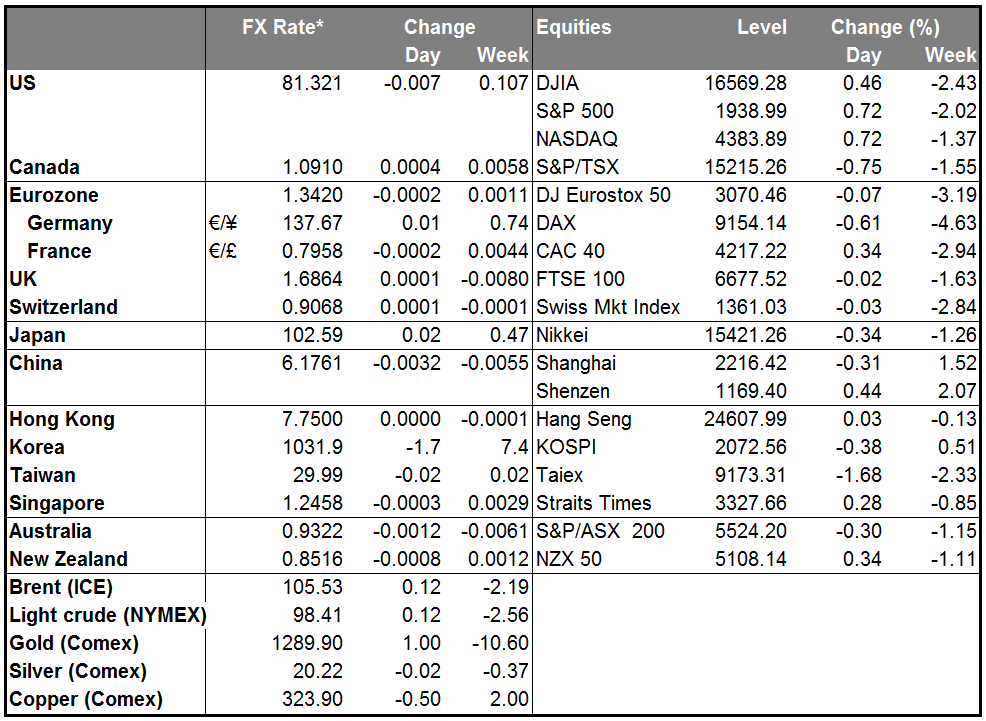
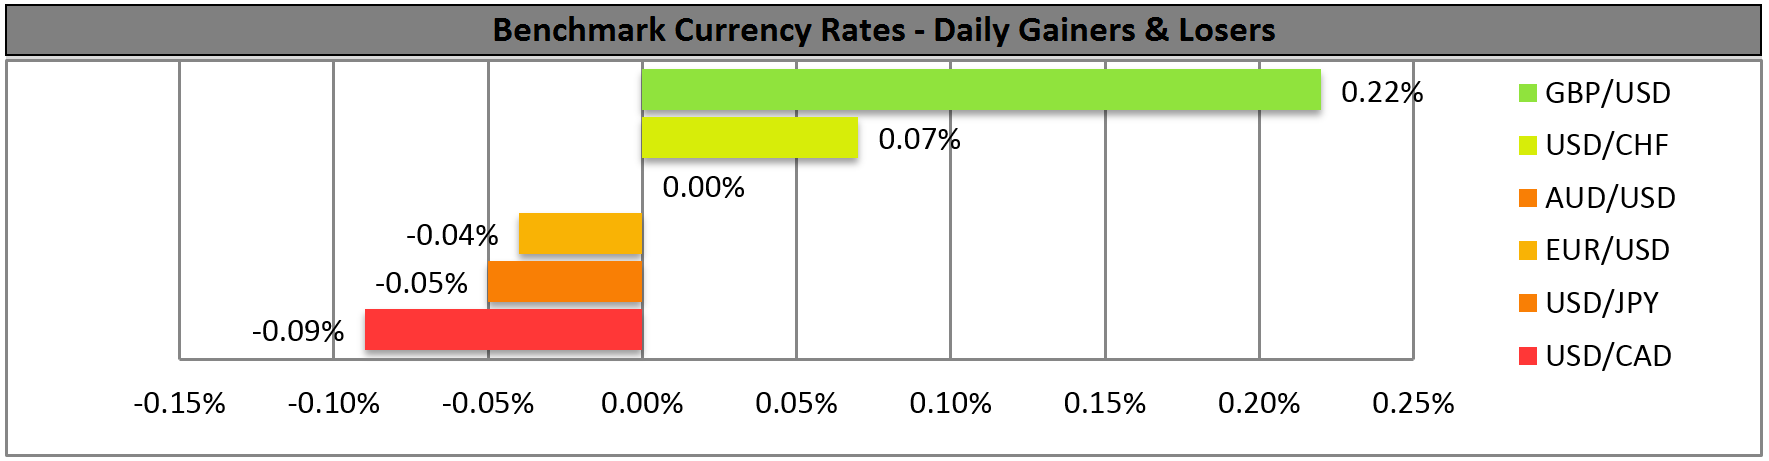
BENCHMARK CURRENCY RATES - DAILY GAINERS AND LOSERS
MARKETS SUMMARY