EUR/USD tumbles to hit support at the uptrend line
EUR/USD declined on Wednesday to hit support at the near-term black downtrend line. The rate remains above that line, something that keeps alive the scenario for a rebound and another test near the 1.1540 (R1) resistance area. On the other hand, our short-term momentum studies provide signs of weakness. The RSI broke below its upside support line and dipped below its 50 barrier, while the MACD has topped and moved below its trigger line. Personally, I would prefer to see a break below 1.1260 (S1) in order to adopt the negative view. Such a move is likely to prompt bearish extensions towards the support of 1.1100 (S2), defined by the low of the 26th of January. Having these mixed signs in mind, I would prefer to take the sidelines at the moment as far as the short-term picture is concerned, and wait for more actionable directional signals. Switching to the daily chart, we see that the price structure still suggests a longer-term downtrend. EUR/USD is printing lower peaks and lower troughs below both the 50- and the 200-day moving averages.
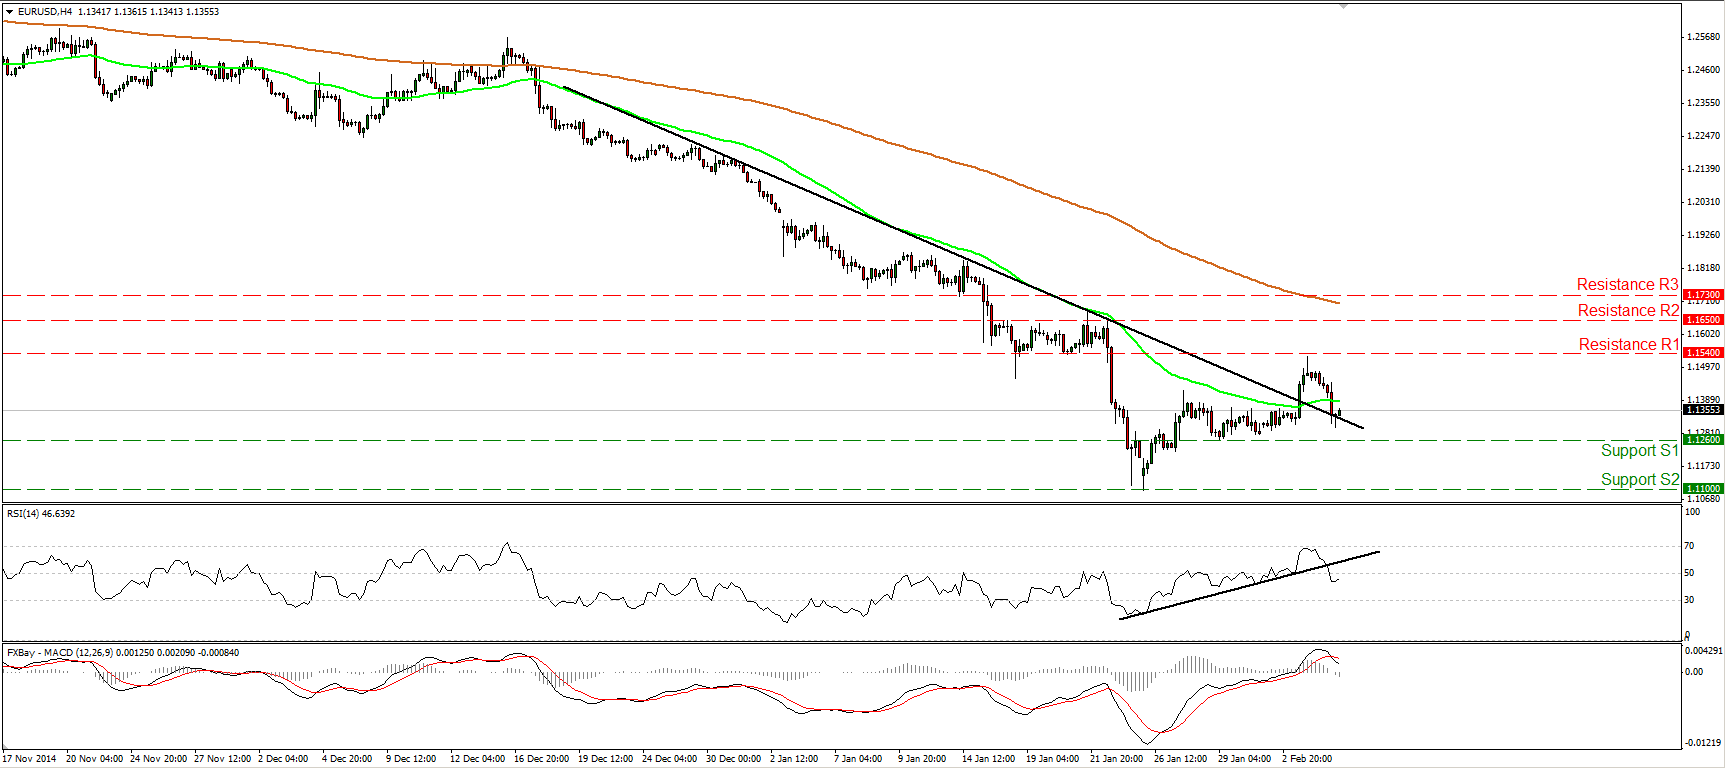
• Support: 1.1260 (S1), 1.1100 (S2), 1.1020 (S3).
• Resistance: 1.1540 (R1), 1.1650 (R2), 1.1730 (R3).
GBP/JPY stuck in a range
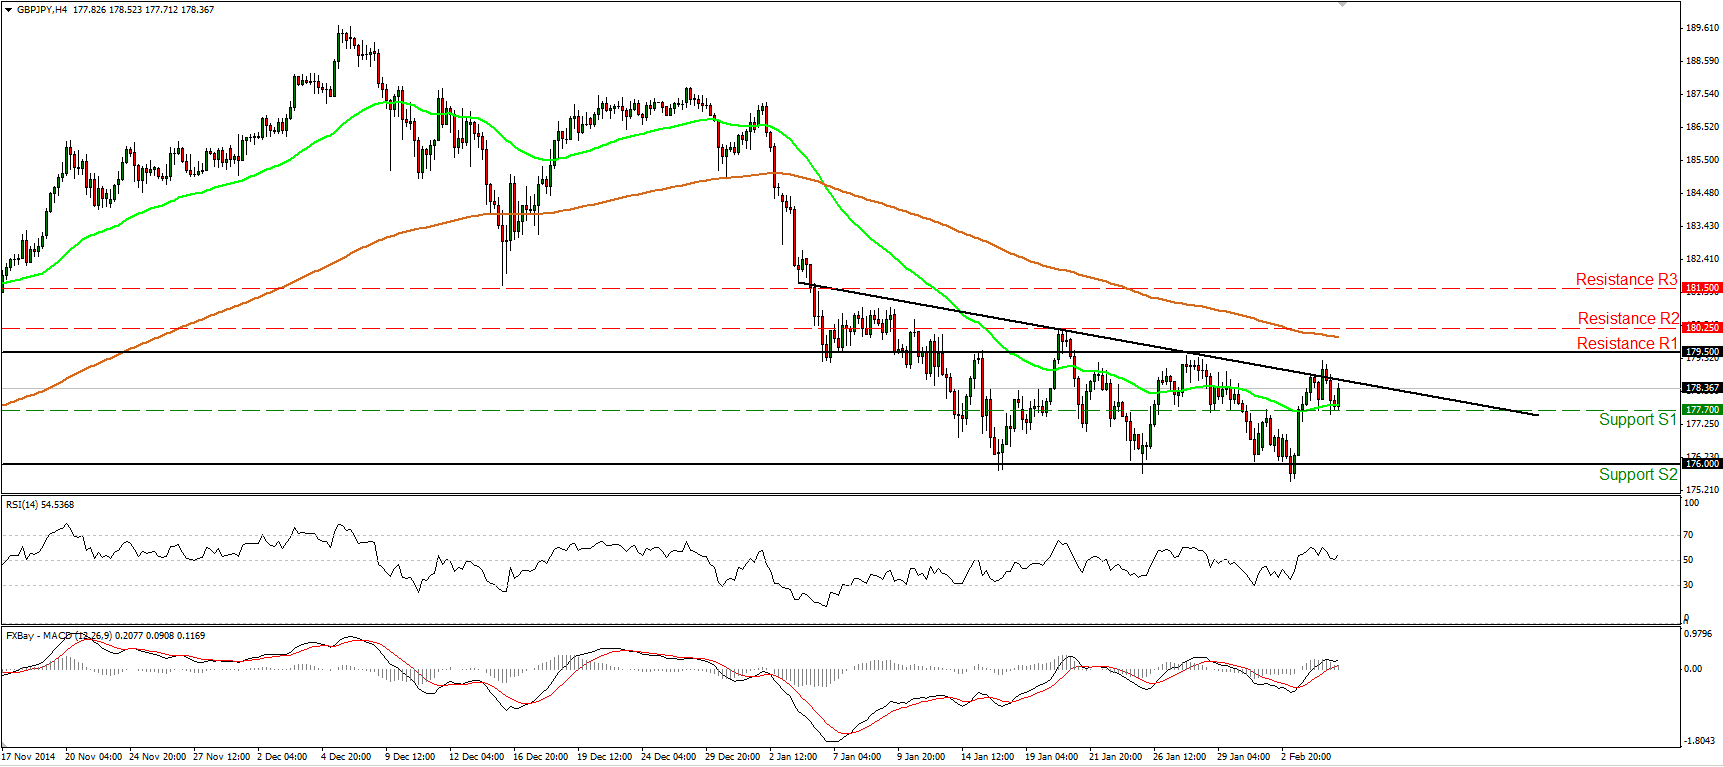
GBP/JPY rebounded from near the 176.00 (S2) key support obstacle, moved above the resistance (turned into support) of 177.70 (S1), and hit resistance between the near-term black downside resistance line and the resistance of 179.50 (R1). Bearing that in mind, I would consider the near-term bias to be neutral and I would prefer to adopt a “wait and see” stance for now. Zooming out to the daily chart, I see that the 176.00 (S2) area lies near the 200-day moving average, coincides with the 61.8% retracement level of the 15th of October – 5th of December rally and also stands near the 161.8% extension level of the width of the failure swing top completed on the 6th of January. These technical signs make the 176.00 (S2) support area even stronger in my view. I also see positive divergence between both the daily oscillators and the price action, something that supports my view to stay on the sidelines and wait for more actionable directional signals.
• Support: 177.70 (S1), 176.00 (S2), 175.00 (S3).
• Resistance: 179.50 (R1), 180.25 (R2), 181.50 (R3).
Is AUD/USD ready to correct higher?
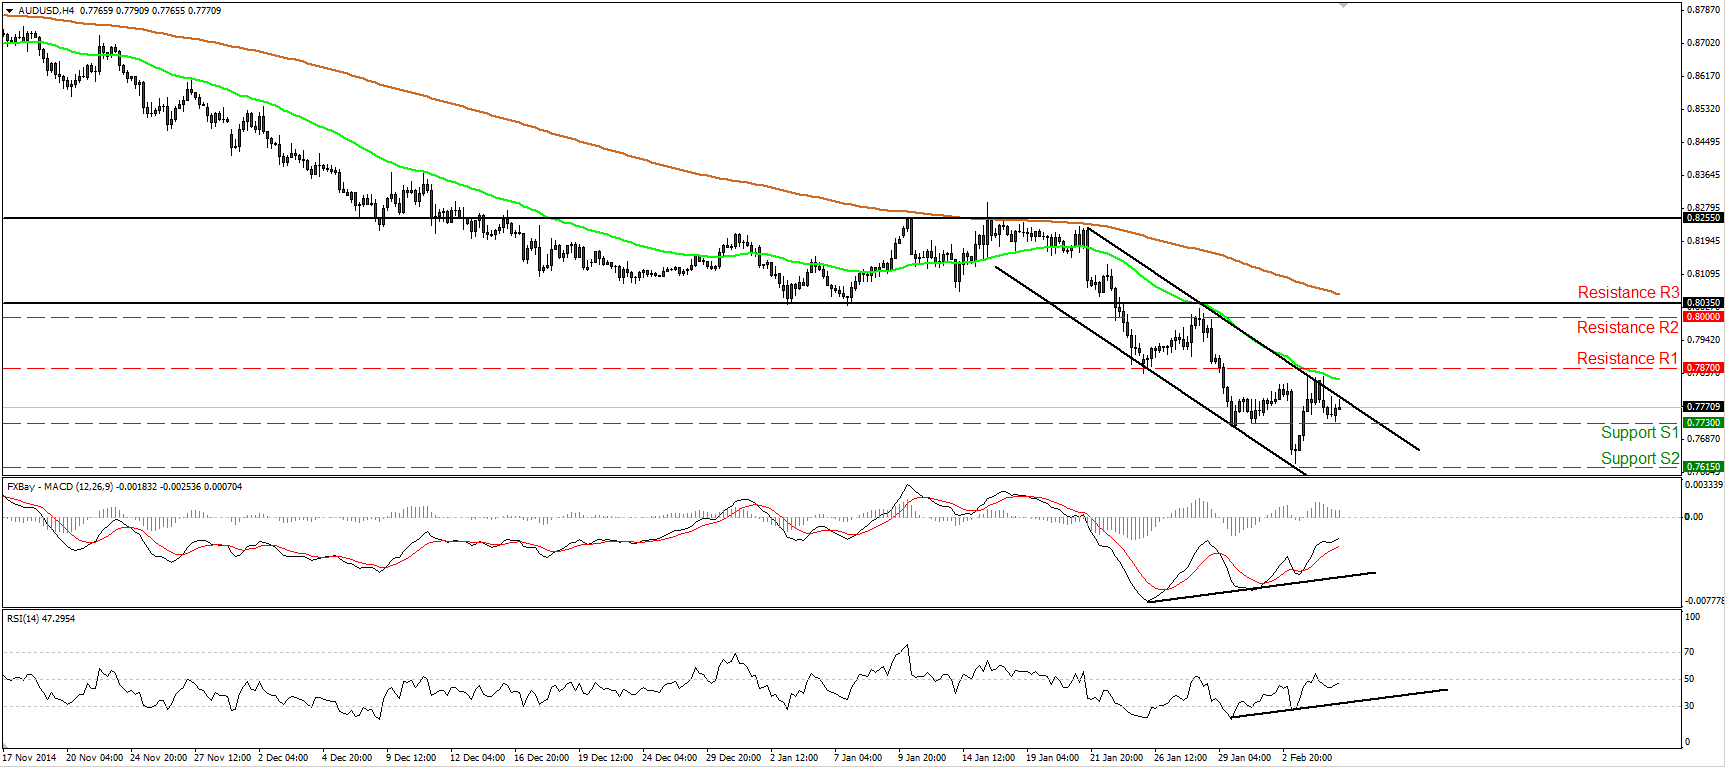
AUD/USD rebounded from 0.7615 (S2) to hit resistance near the upper boundary of the short-term downside channel. Given that there is positive divergence between both of our short-term momentum indicators and the price action, I would be careful that the rebound may continue above the aforementioned boundary. As far as the bigger picture is concerned, the break below the 0.8000 (R2) psychological hurdle is the move that triggered the continuation of the longer-term downtrend in my view. Therefore, I would treat any possible upside extensions as a corrective move before sellers seize control again. I still expect the rate to challenge the psychological line of 0.7500 (S3) in the not-to-distant future.
• Support: 0.7730 (S1), 0.7615 (S2), 0.7500 (S3).
• Resistance: 0.7870 (R1), 0.8000 (R2), 0.8035 (R3).
Gold rebounds from 1255
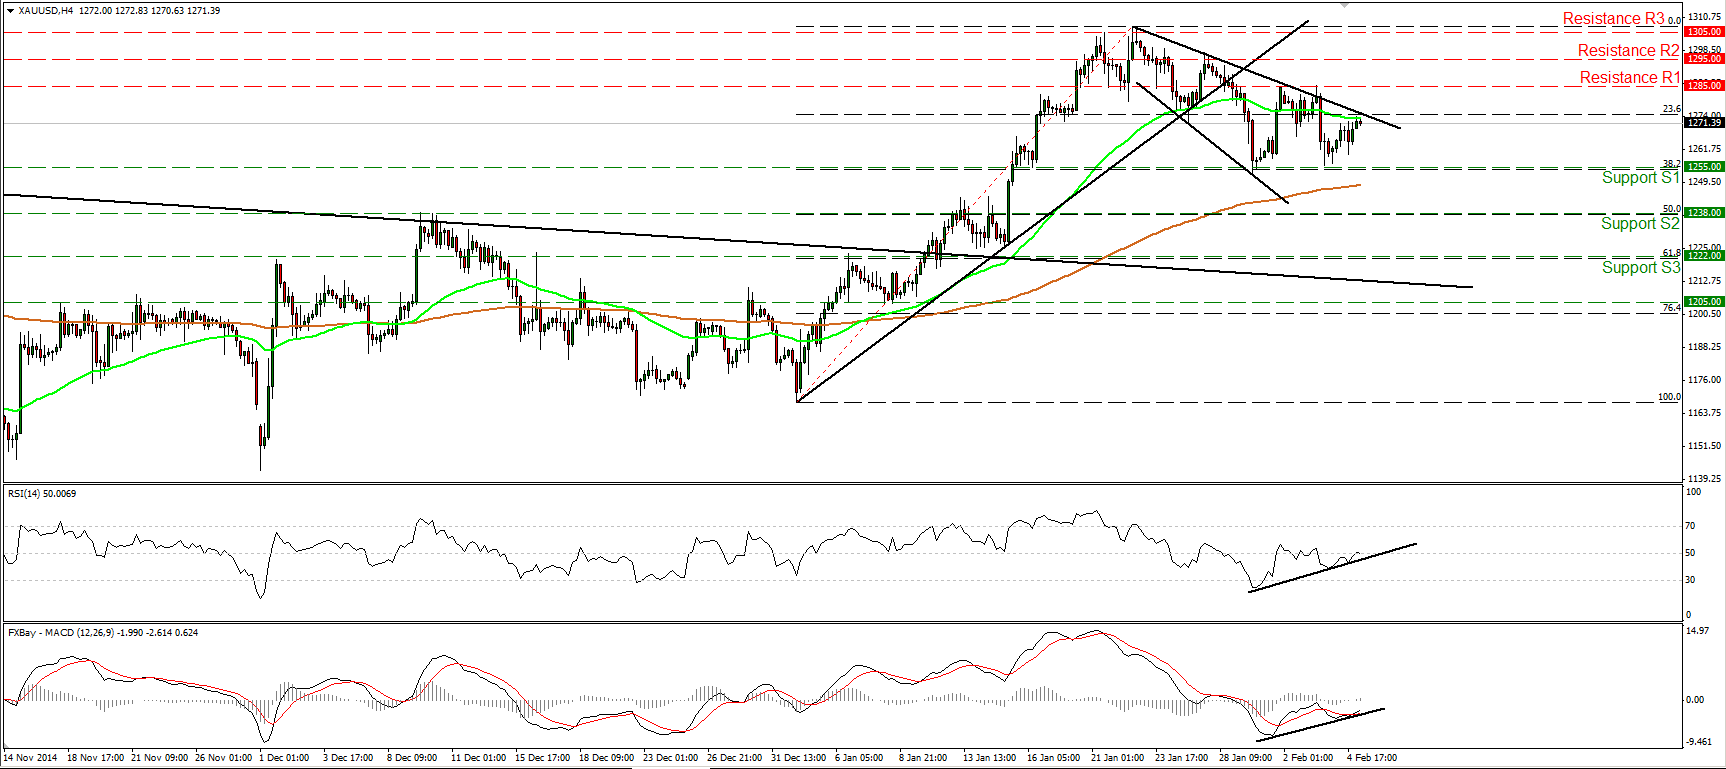
Gold rebounded after triggering some buy orders near the 1255 (S1) support barrier, which happens to be the 38.2% retracement level of the 2nd – 22nd of January. Nevertheless, the metal is still trading below the downside resistance line taken from the high of the 22nd of January, thus I would prefer to keep my flat stance. As for the overall path, after the completion of an inverted head and shoulders formation on the 12th of January, on the daily chart, the price structure has been suggesting an uptrend. The possibility for a higher low still exist and thus I would treat the current down wave as a corrective phase.
• Support: 1255 (S1), 1238 (S2), 1222 (S3).
• Resistance: 1285 (R1), 1295 (R2), 1305 (R3).
WTI collapses
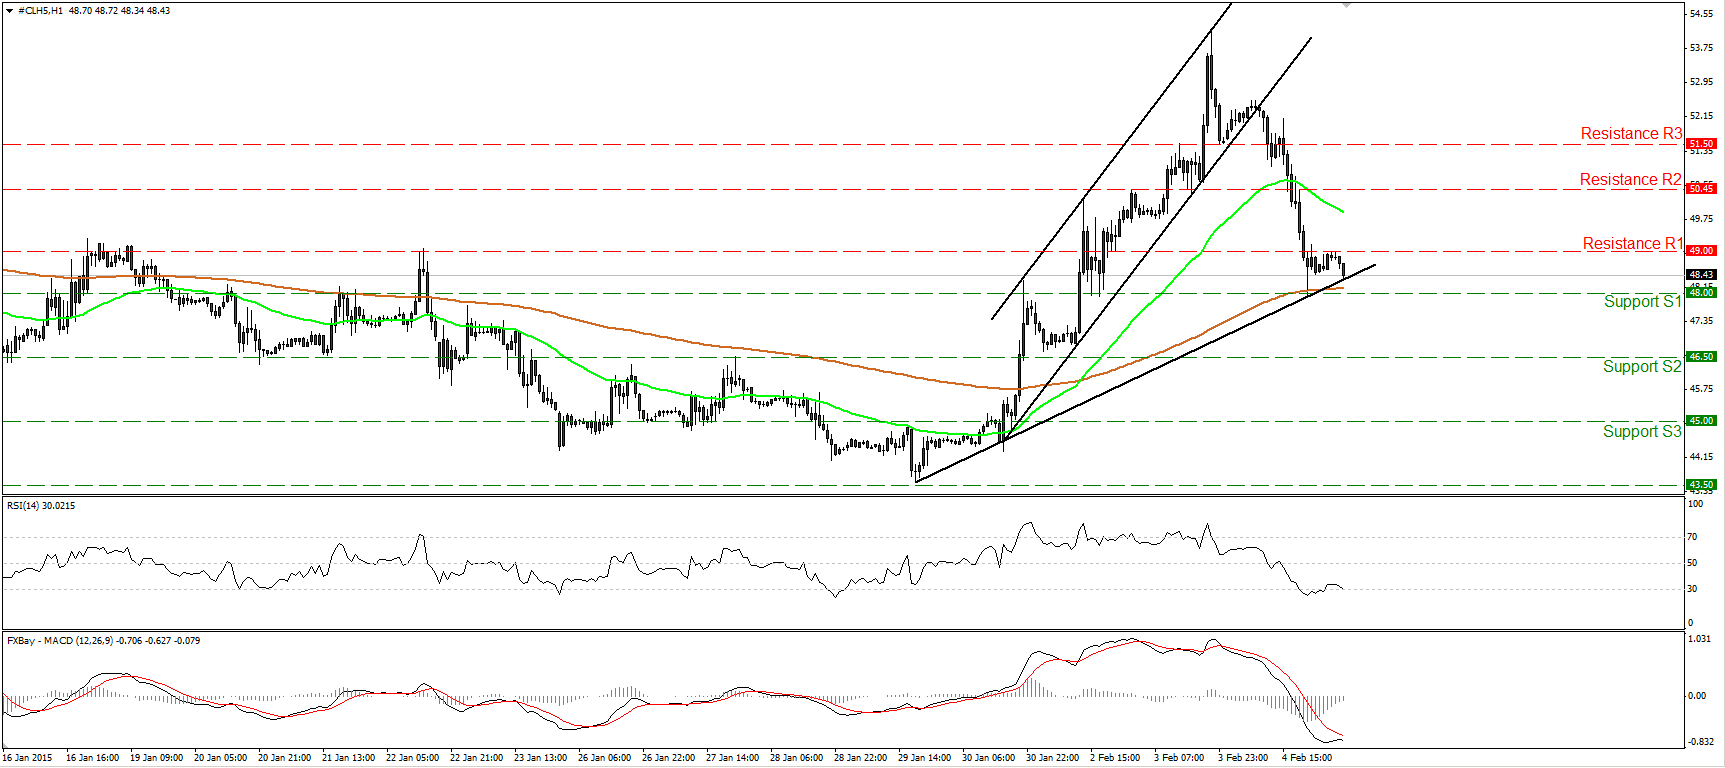
WTI plunged yesterday, breaking below the lower bound of the steep black upside channel. The collapse was halted by the black uptrend line taken from the low of the 29th of January, but I see signs that the bears are willing to drive the battle below it. A clear violation of the 48.00 (S1) support hurdle will confirm that and perhaps lead the rate towards the 46.50 (S2) area. On the daily chart, WTI is still trading below both the 50- and the 200-day moving averages, and this keeps the overall downtrend intact. However, given that the positive divergence between the daily oscillators and the price action is still in effect, I would prefer to stand aside and wait for more actionable signals that bears are willing to extend the down path.
• Support: 48.00 (S1), 46.50 (S2), 45.00 (S3).
• Resistance: 49.00 (R1) 50.45 (R2), 51.50 (R3).
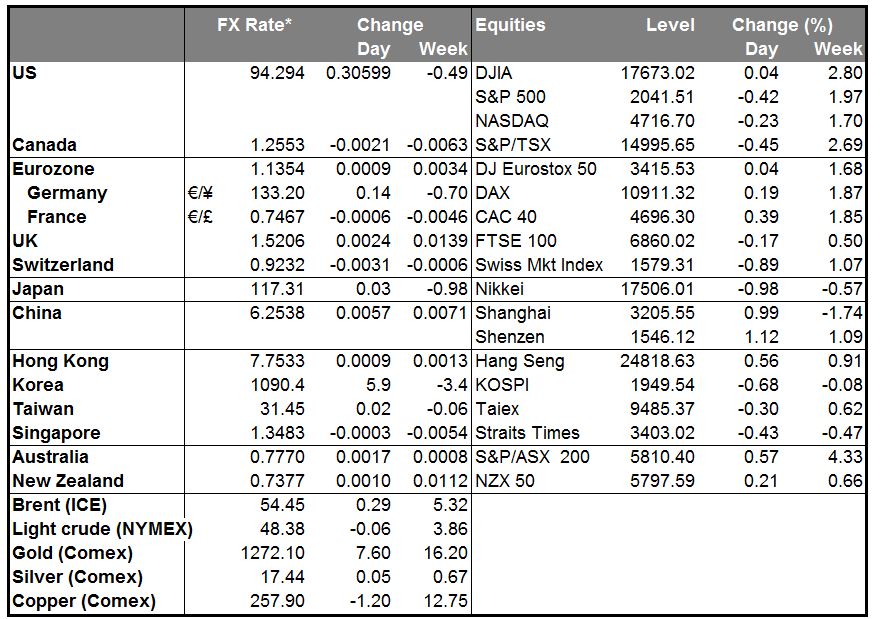
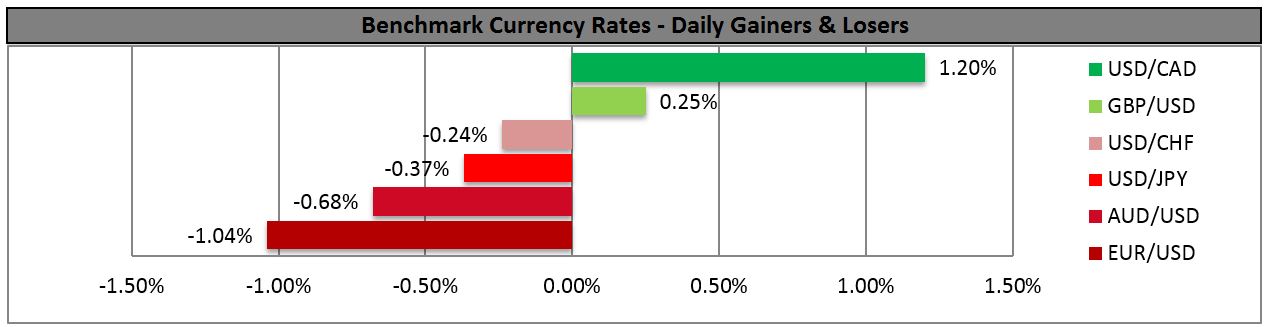
BENCHMARK CURRENCY RATES - DAILY GAINERS AND LOSERS
MARKETS SUMMARY