EUR/USD tumbles below 1.2000
EUR/USD tumbled on Friday, breaking below the 1.2040 (R2) line and reaching the psychological zone of 1.2000 (R1). On Monday, the pair opened with a gap down and fell to hit support at 1.1860 (S1) before rebounding to trade near 1.1940. Given the dip below the 1.2000 (R1) area, the short-term picture remains to the downside and I would expect another test at the 1.1860 (S1) hurdle. Today, the German inflation rate for December is expected to have slowed, which could pull the trigger for the aforementioned move. Our short-term oscillators corroborate the negative bias of EUR/USD. The RSI fell deeper into its oversold territory, while the MACD, already negative, moved further below its signal line. These signs designate accelerating bearish momentum and amplify the case for further declines. As far as the broader trend is concerned, I still see a longer-term downtrend. On the daily chart, we still have lower peaks and lower troughs below both the 50- and the 200-day moving averages.

• Support: 1.1860 (S1), 1.1775 (S2), 1.1700 (S3)
• Resistance: 1.2000 (R1), 1.2040 (R2), 1.2130 (R3)
GBP/USD plunged after the disappointing UK manufacturing PMI
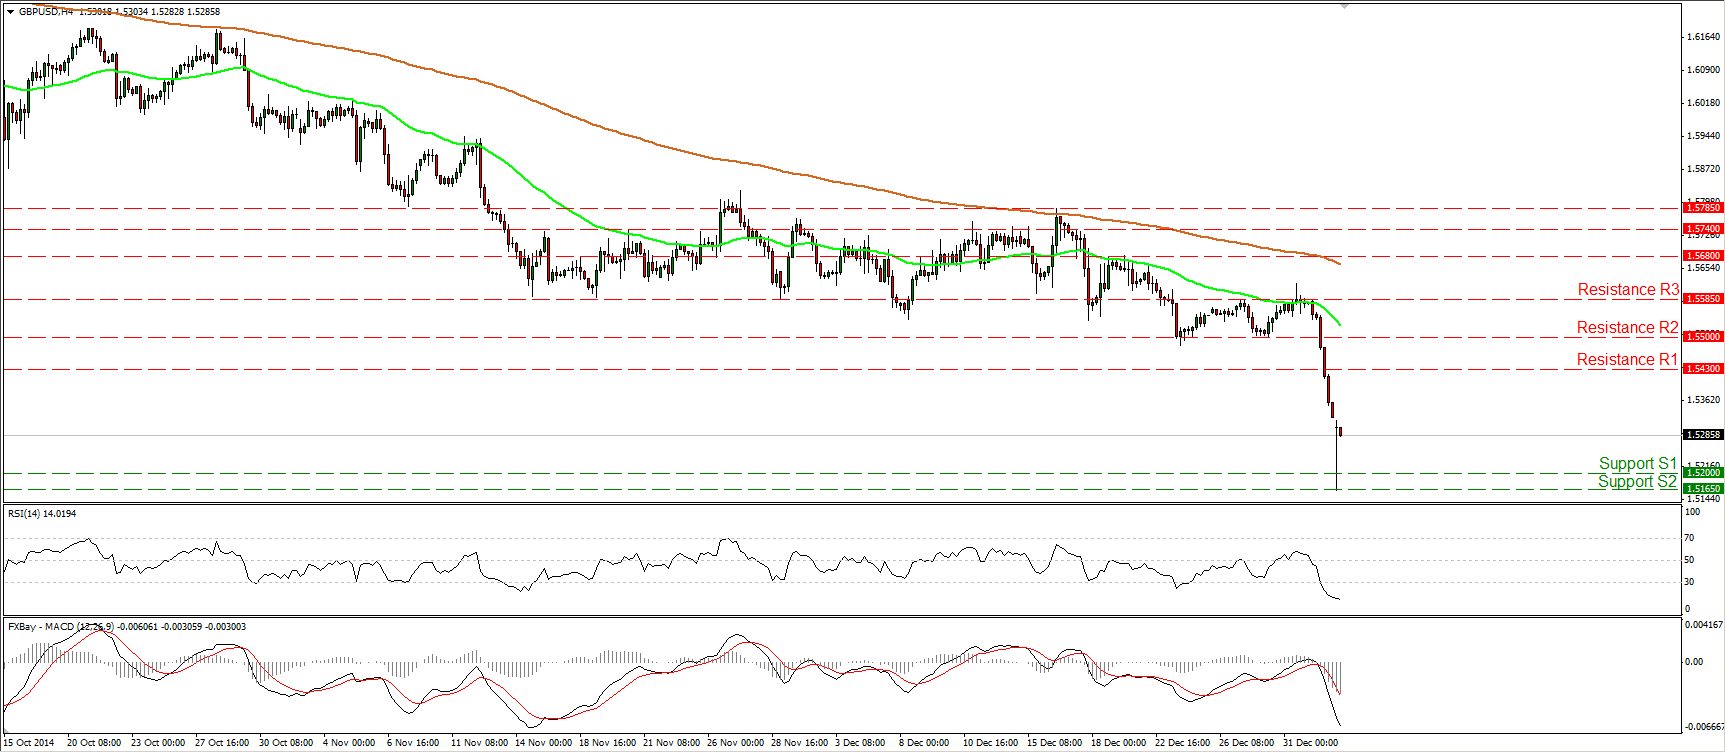
GBP/USD collapsed on Friday after the UK manufacturing PMI for December disappointed. The rate dipped below the psychological zone of 1.5500 (R2) and ignored our support (turned into resistance) obstacle of 1.5430 (R1), defined by the lows of the 14th and the 28th of August 2013. On Monday the pair continued its plunge to hit support below the 1.5200 (S1) area (the low of the 7th of August 2013) before rebounding to trade near 1.5285. If today’s UK construction PMI for December is disappointing, it could set the stage for another move down towards the support obstacles of 1.5200 (S1) or 1.5165 (S2). As for the broader trend, I still say that as long as Cable is trading below the 80-day exponential moving average, the overall path remains to the downside.
• Support: 1.5200 (S1), 1.5165 (S2), 1.5100 (S3)
• Resistance: 1.5430 (R1), 1.5500 (R2), 1.5585 (R3)
EUR/JPY slides below 144.75
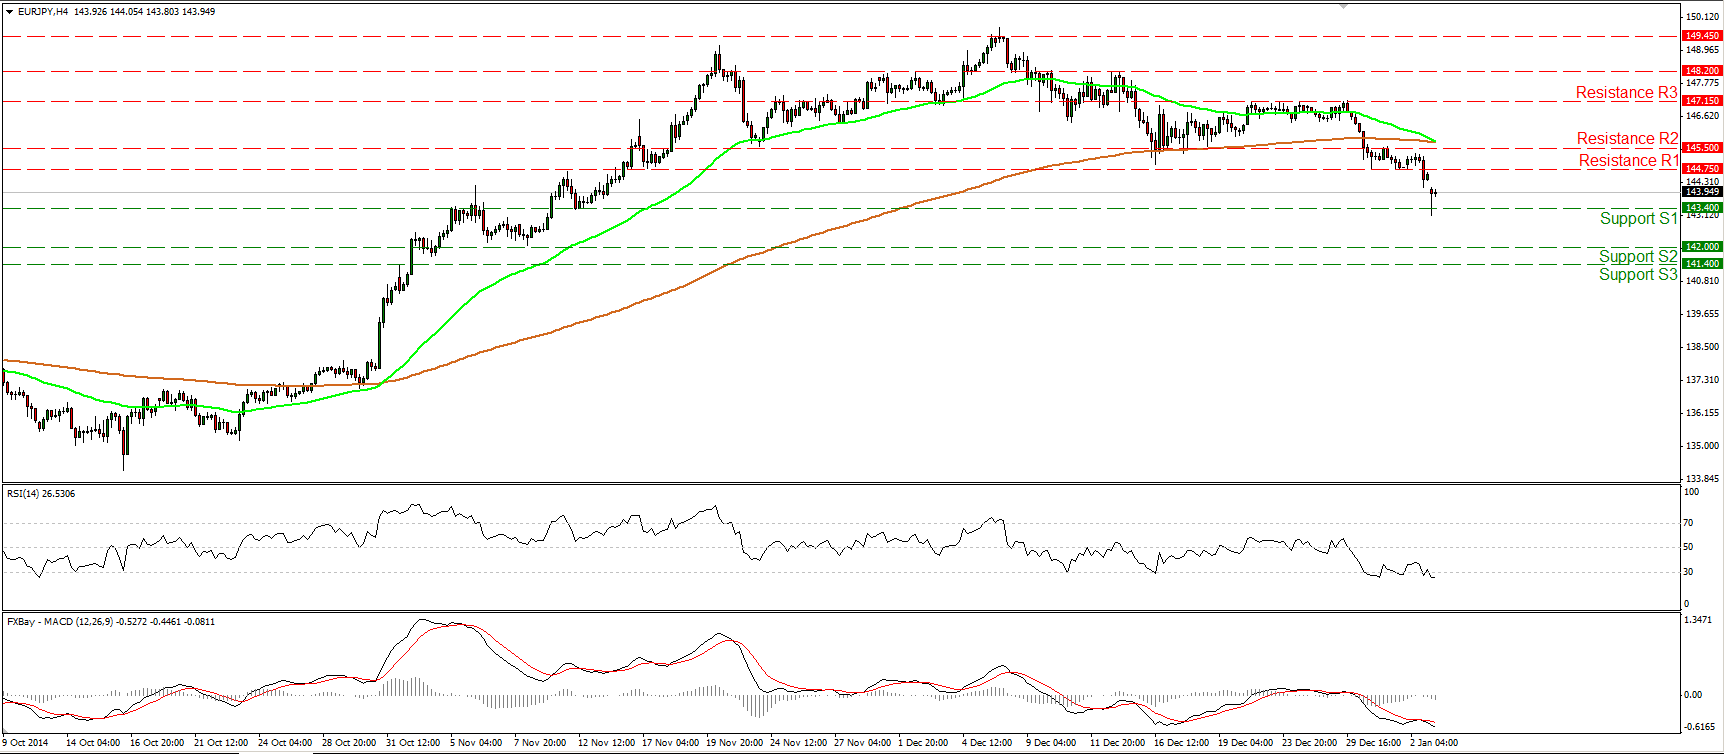
EUR/JPY declined and broke below the support (turned into resistance) barrier of 144.75 (R1). Today, this rate hit support slightly below the 143.40 line, where a clear violation could prompt extensions towards the 142.00 (S2) zone, defined by the low of the 10th of November. Taking a look at our near-term momentum studies, I see that the RSI is back within its oversold territory, while the MACD remains below both its zero and signal lines pointing south.
On the daily chart, I see a possible head and shoulders formation completed, something that increases the probabilities for further bearish extensions in the short term. Our daily momentum indicators support the notion. The 14-day RSI fell below its 50 line, while the MACD obtained a negative sign.
• Support: 143.40 (S1), 142.00 (S2), 141.40 (S3)
• Resistance: 144.75 (R1), 145.50 (R2), 147.15 (R3)
Gold rebounds from near 1173
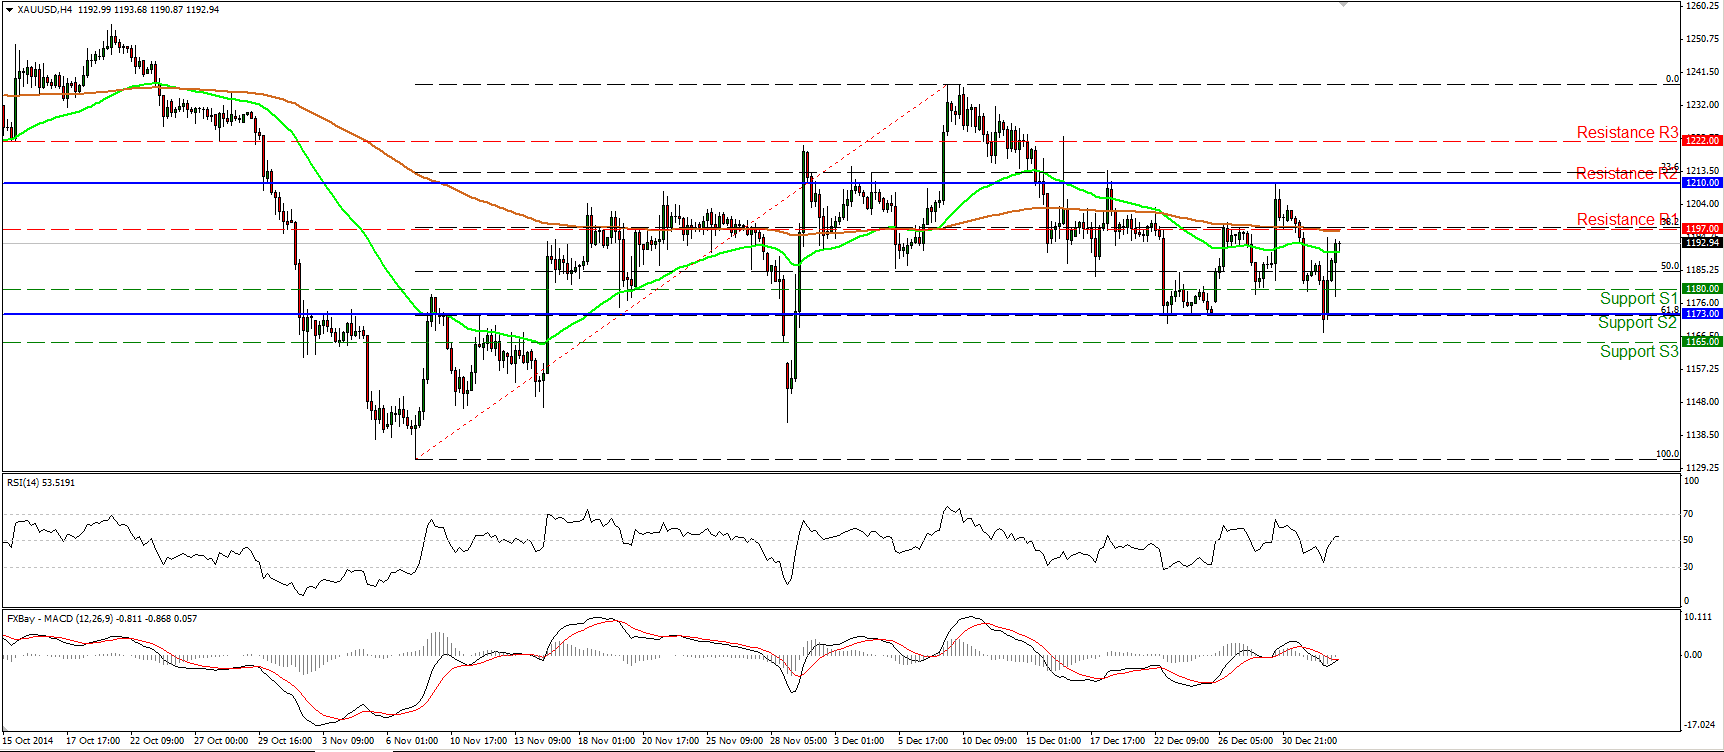
Gold declined but triggered buy orders slightly below the 1173 (S2) area which coincides with the 61.8% retracement level of the 7th of November – 9th of December advance. Given that the precious metal remains above that Fibonacci retracement level and below the resistance of 1210 (R2), and with no clear trending conditions in the near-term, I would prefer to maintain my “wait and see stance”, at least for now. A dip below the 1173 (S2) barrier would probably shift the near term bias to the downside. On the other hand, only a move above 1210 (R2) could confirm a forthcoming higher high on the daily chart. Once again our oscillators do not confirm each other, adding to the mixed picture for the yellow metal. The RSI crossed above its 50 line, but looks able to dip back below it, while the MACD has crossed above its trigger, is pointing up, and could become positive soon.
• Support: 1180 (S1), 1173 (S2), 1165 (S3)
• Resistance: 1197 (R1), 1210 (R2), 1222 (R3)
WTI getting closer to the 50.00 zone
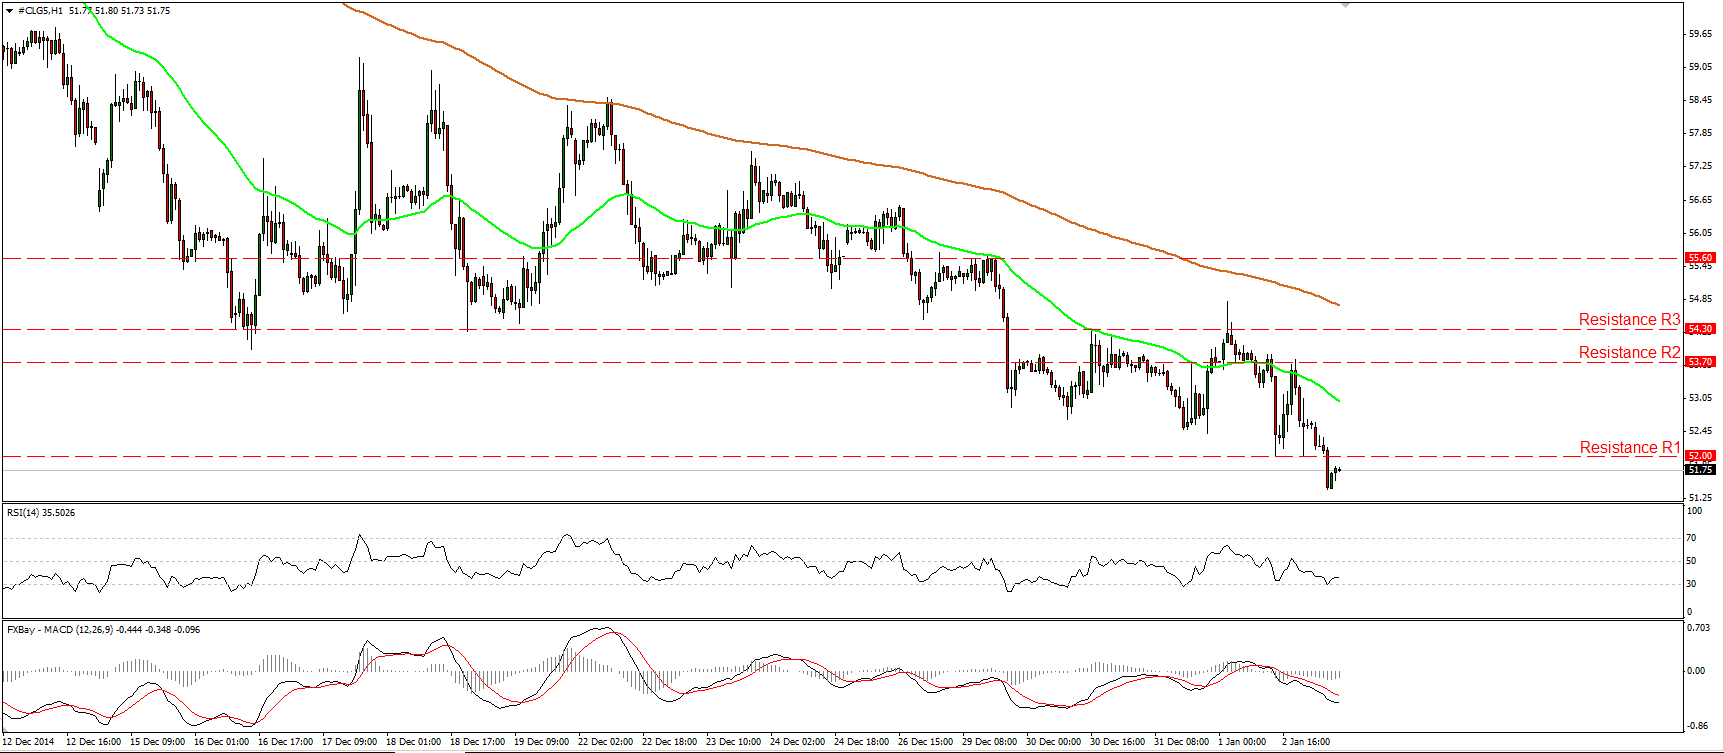
WTI moved lower on Friday, breaking below 52.00 (R1). This move confirmed a forthcoming lower low on the 1-hour chart and corroborates my view that the decline is likely to continue and challenge the psychological area of 50.00 (S1) in the not-too-distant future. As for our oscillators, the MACD remains below both its zero and signal lines, indicating strong bearish momentum, but the RSI rebounded somewhat after hitting its 30 line. As I result, I would be careful of a minor bounce before sellers pull the trigger again. In the bigger picture, as long as WTI is printing lower peaks and lower troughs below both the 50- and the 200-day moving averages, the overall path stays to the downside.
• Support: 50.00 (S1), 48.00 (S2), 46.70 (S3)
• Resistance: 52.00 (R1), 53.70 (R2), 54.30 (R3)
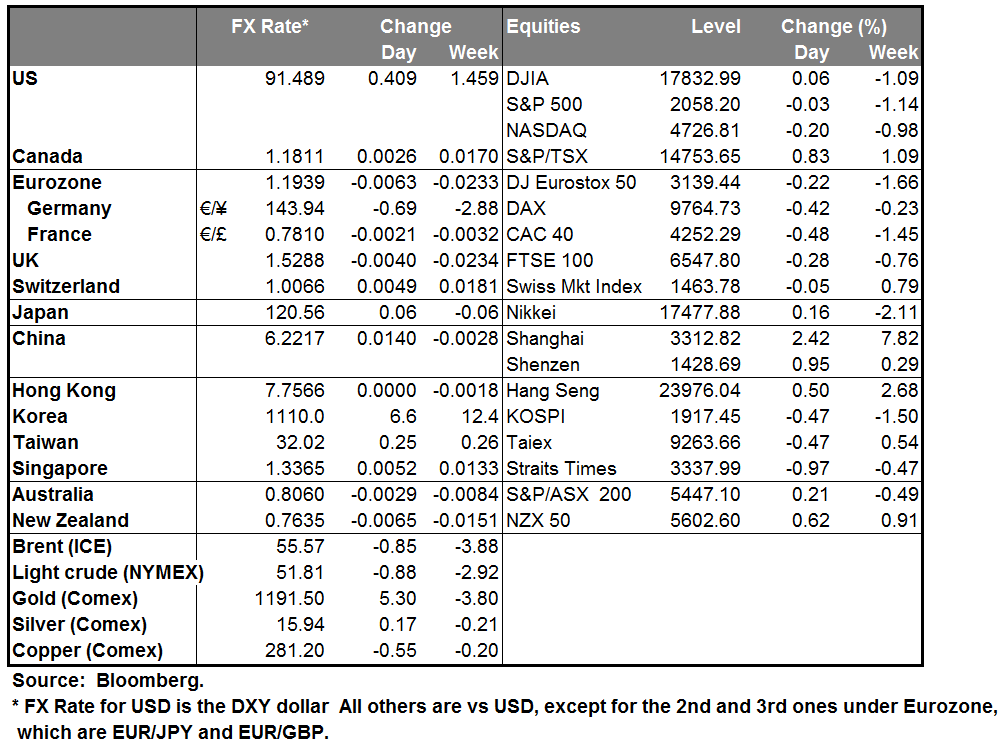
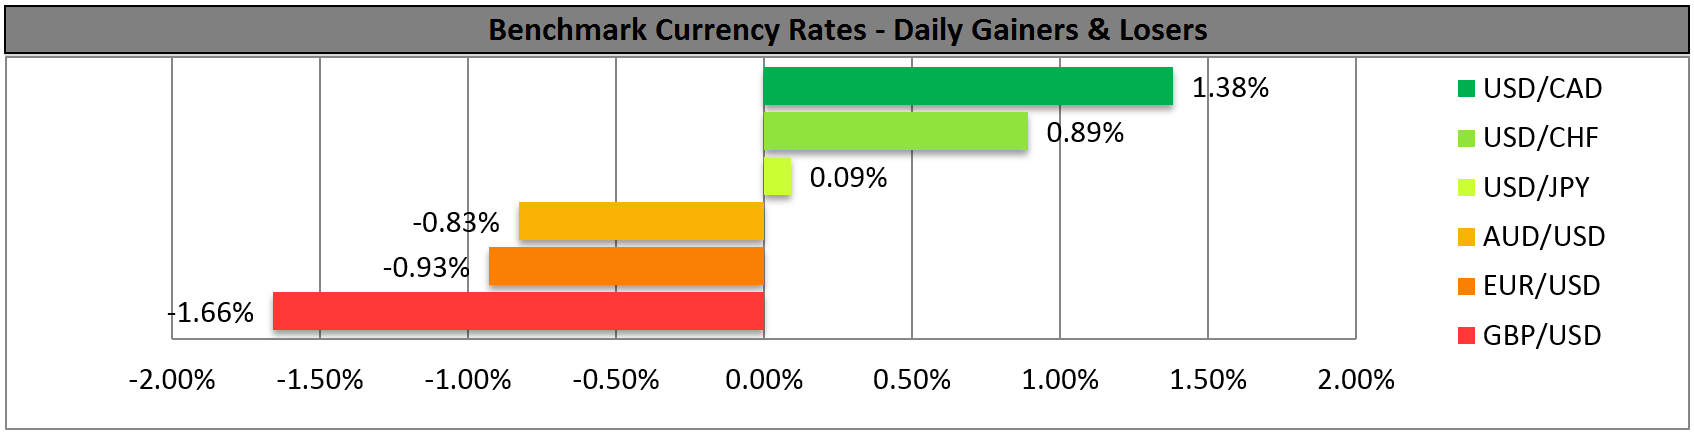
BENCHMARK CURRENCY RATES - DAILY GAINERS AND LOSERS
MARKETS SUMMARY